EduNinja
[Maximum number: 2]

Fig. 2.1 shows a dwarf sunflower and a tall sunflower, Helianthus annuus. The height of the dwarf sunflower is 0.45 m and the height of the tall sunflower is 4.5 m .
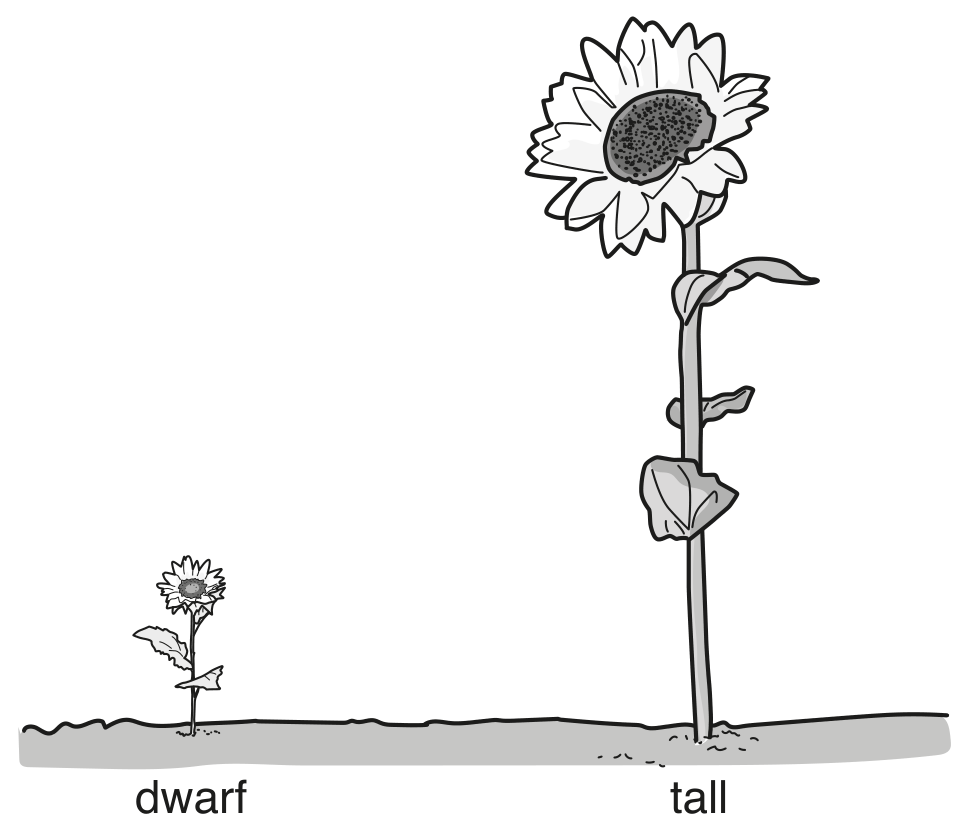
not to scale

not to scale

Dwarf plants like the one in Fig. 2.1 have mutant alleles.

(a)

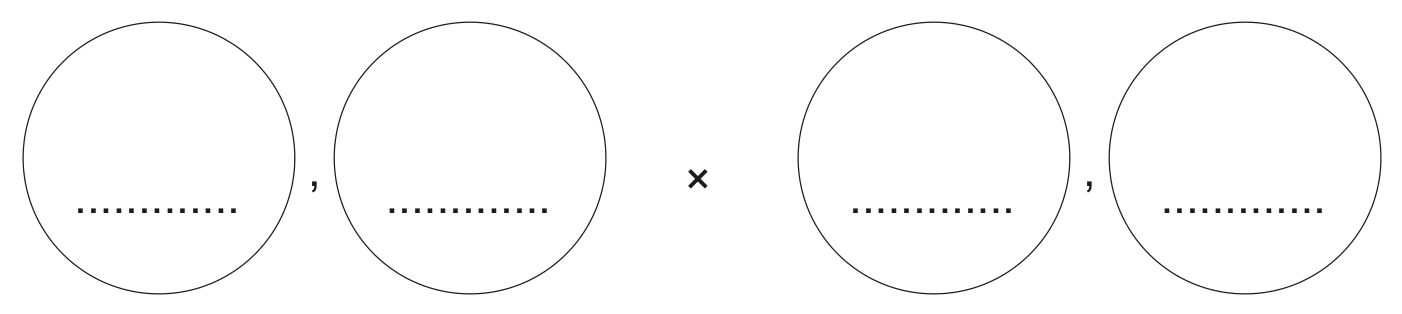
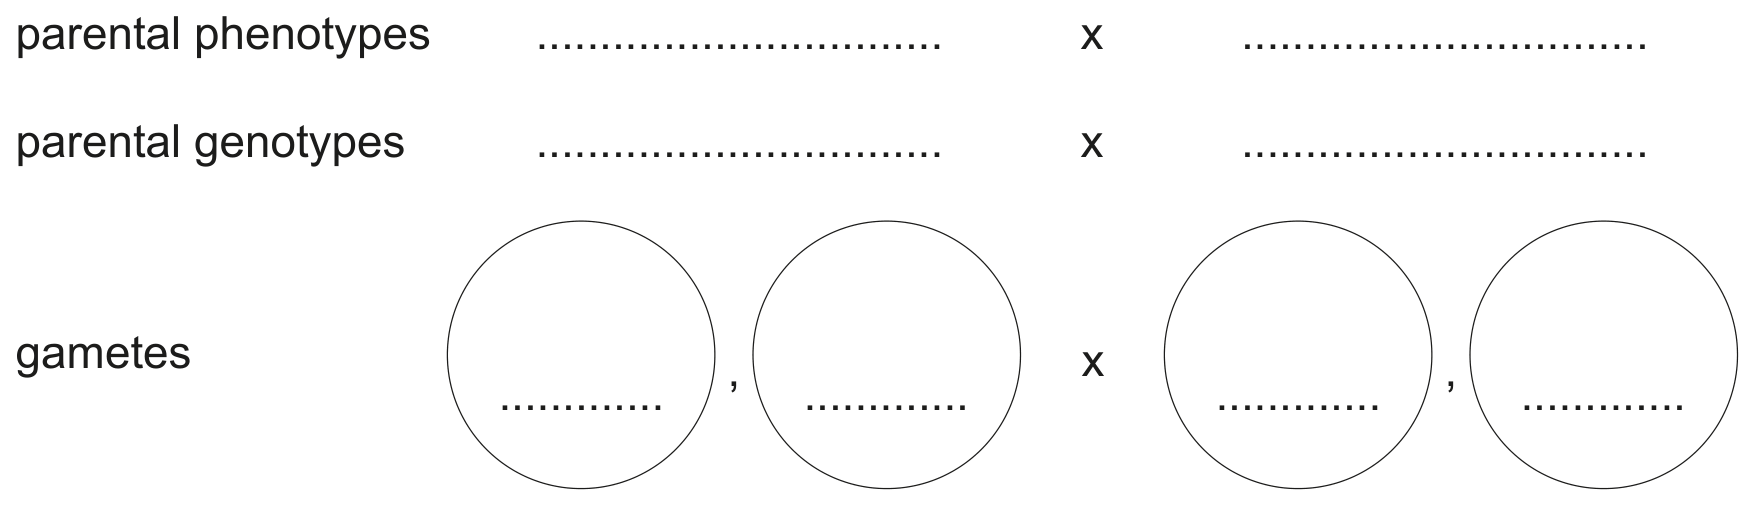
Two tall sunflower plants were crossed. 25\% of the offspring produced were dwarf.

Explain how it is possible for two tall parent plants to have this percentage of dwarf offspring.

[ 2 ]
(a)

Petal colour in the flowers of snapdragon plants shows co-dominance.

The gene for petal colour has two co-dominant alleles:
- CR\quad \mathbf{C}^{\mathbf{R}} for red petals
- CW\quad \mathbf{C}^{\mathbf{W}} for white petals

Table 2.1 shows the genotypes and phenotypes of snapdragon plants with different petal colours.

Table 2.1

Table 2.1

[ 8 ]
(i)

Explain the term co-dominance.

[ 2 ]
(ii)

A botanist crossed two snapdragon plants with pink flowers.

Complete the genetic diagram to show the ratio of expected phenotypes in the offspring.
parental phenotypes
pink flower
pink flower
parental genotypes
CRCW\mathbf{C}^{\mathbf{R}} \mathbf{C}^{\mathbf{W}}CRCW\mathbf{C}^{\mathbf{R}} \mathbf{C}^{\mathbf{W}}
gametes

Question image
Question image
Question image
Question image

offspring genotypes
offspring phenotypes
phenotypic ratio

[ 4 ]
(iii)

The botanist wanted to produce a generation of snapdragons that all had pink flowers.

State the phenotypes of the parent plants that the botanist would need to cross.
Explain your answer. parent phenotypes
explanation

[ 2 ]
(a)

Two tomato plants that produce red fruit were bred together.
This cross produced 71 offspring plants with red fruit and 26 offspring plants with yellow fruit.
Complete the genetic diagram to show this cross.
Select a suitable letter to represent the alleles and decide which allele will need a capital letter and which allele will need a lower case letter.
letter representing the allele for red fruit
letter representing the allele for yellow fruit
parental phenotypes
red fruit
×
red fruit
parental genotypes
gametes

Question image

offspring genotypes
expected phenotype ratio red fruit : yellow fruit
actual phenotype ratio
71
red fruit :
26
yellow fruit

[ 6 ]
(b)

Researchers carried out some experiments on tomato plants that were homozygous for fruit colour.

State how the researchers could be sure that the fruit came from homozygous plants.

[ 1 ]
[Maximum number: 10]

Red blood cells contain the protein haemoglobin.

(a)

The allele for the normal form of haemoglobin is HbA\mathbf{H b}^{\mathbf{A}}.

The allele for the abnormal form of haemoglobin is HbS\mathbf{H b}^{\mathbf{S}}.
Draw a genetic diagram to determine the probability of two heterozygous parents having a child who does not have the HbS\mathbf{H b}^{\mathbf{S}} allele.

Question image

offspring genotypes
probability of offspring not having the HbS\mathbf{H b}^{\mathbf{S}} allele

[ 5 ]
(b)

Fig. 2.2 and Fig. 2.3 are maps showing some of the different regions in a country. Scientists studied the distribution of the HbS\mathbf{H b}^{\mathbf{S}} allele in the country.

Fig. 2.2 shows the estimated frequency of the allele within the population.

Fig. 2.3 shows the estimated number of babies born with sickle cell anaemia in each region.

Fig. 2.3 shows the estimated number of babies born with sickle cell anaemia in each region.

Fig. 2.3

Fig. 2.3

The scientists made a statement:
'There is a relationship between the frequency of the HbS\mathbf{H b}^{\mathbf{S}} allele and the number of babies born with sickle cell anaemia in regions A, B and C.'

[ 5 ]
(i)

Using the information in Fig. 2.2 and Fig. 2.3, discuss the evidence for and against this statement for regions A, B and C only.

[ 5 ]
(a)

The plant Camellia japonica has flowers that can be white, red or a mixture of these two colours. When red-flowered plants are crossed with white-flowered plants, all the offspring plants have flowers with petals that are a mixture of red and white, as shown in Fig. 2.2.

Fig. 2.2

Fig. 2.2

- The gene for petal colour in C. japonica is given the symbol P.
- The allele for white petals is given the symbol PWW\mathbf{P W}^{\mathbf{W}}.
- The allele for red petals is given the symbol PRR\mathbf{P R}^{\mathbf{R}}.

[ 4 ]
(i)

Table 2.1 shows the phenotypes of three different pairs of parent plants.
Complete Table 2.1 by giving all the possible genotypes of the offspring plants that could be produced by these parent plants.
.

Table 2.1

Table 2.1

[ 3 ]
(ii)

State the type of inheritance that is shown by petal colour in C. japonica.

[ 1 ]
[Maximum number: 6]

Colour blindness in humans is caused by a fault in some of the light receptor cells in the retina of the eye. Rod cells and cone cells are two types of light receptor.

(a)

Colour blindness is a sex-linked characteristic.

The gene for colour vision is on the X chromosome.
There are two alleles of this gene:
- B is the allele for normal colour vision
- b is the allele for colour blindness.

Fig. 3.2 is a pedigree chart showing the inheritance of colour blindness in a family. The key shows the sex chromosomes and the alleles of the gene for colour vision.

Fig. 3.2

Fig. 3.2

Describe evidence from Fig. 3.2 that shows that colour blindness is a sex-linked characteristic.

[ 2 ]
(b)

A man with normal colour vision ( XBY\mathrm{X}^{\mathrm{B}} \mathrm{Y} ) and a woman who is colour-blind ( XbXb\mathrm{X}^{\mathrm{b}} \mathrm{X}^{\mathrm{b}} ) have a baby.

Complete the genetic diagram to predict the probability that the baby is colour-blind.
parental phenotypes
male with normal colour vision
parental genotypes
XBY\mathrm{X}^{\mathrm{B}} \mathrm{Y}

Question image
Question image
Question image
Question image

offspring genotypes
offspring phenotypes
probability that the baby is colour-blind:

[ 4 ]
[Maximum number: 5]

Apple scab is a disease that infects apple trees.
Fig. 3.1 shows apples from uninfected and infected apple trees.

Fig. 3.1

Fig. 3.1

There is a gene that determines whether or not apple trees are resistant to apple scab disease.
There are two alleles for this gene:
- disease-resistant, R
- not disease-resistant, r

(a)
(i)

A farmer wanted to do a test cross to identify the genotype of disease-resistant apple trees. This would tell him whether his trees were either homozygous dominant or heterozygous.

Determine the phenotypes of the offspring if the unknown parent apple tree was heterozygous.

Complete the genetic diagram:
parental phenotypes
disease-resistant
× not disease-resistant
parental genotypes
gametes ×

Question image
Question image
Question image
Question image

offspring genotype
offspring phenotype

[ 5 ]
[Maximum number: 7]

The pancreas is an organ that has roles in the digestive and hormonal systems of humans.
Fig. 3.1 shows part of the alimentary canal and some of the associated organs.

Fig. 3.1

Fig. 3.1

(a)

If CFTR proteins do not move chloride ions, the liquid in the pancreatic duct becomes very sticky and the duct can become blocked.

Blocked pancreatic ducts are one effect of cystic fibrosis, which is an inherited disease. Cystic fibrosis is caused by a mutation of the gene that codes for the CFTR protein.

Fig. 3.3 shows the pedigree diagram of a family that has two people who have cystic fibrosis.

Fig. 3.3

Fig. 3.3

Key: female without cystic fibrosis
□ male without cystic fibrosis female with cystic fibrosis male with cystic fibrosis

[ 7 ]
(i)

The allele that causes cystic fibrosis is a recessive allele.

Describe and explain the evidence shown in Fig. 3.3 that cystic fibrosis is caused by a recessive allele.

[ 2 ]
(ii)

Person 7 is expecting a child with a man who is heterozygous for cystic fibrosis.

Complete the genetic diagram to predict the probability of person 7 and the heterozygous man having a child with cystic fibrosis.

Use the symbol A for the dominant allele and a for the recessive allele.
parental genotypes
gametes

Question image

genotypes of offspring
phenotypes of offspring
probability of having a child with cystic fibrosis

[ 5 ]
[Maximum number: 6]

Fig. 3.1 shows a photomicrograph of human blood.

Fig. 3.1

Fig. 3.1

(a)

Haemophilia is a sex-linked blood disorder. The blood of people with haemophilia takes longer to clot.

Fig. 3.3 is a pedigree diagram showing the inheritance of haemophilia.

Fig. 3.3

Fig. 3.3

□ male with normal clotting time

Question image

male with haemophilia female with normal clotting time
- The allele for normal clotting time is represented by XH\mathbf{X}^{\mathrm{H}}.
- The allele for haemophilia is represented by Xh\mathbf{X}^{\mathrm{h}}.

[ 6 ]
(i)

State the genotypes of the people identified as P, Q and R in Fig. 3.3.

P

Q

R

[ 3 ]
(ii)

The couple S and T are expecting another child.

State the probability that the child will have haemophilia.

[ 1 ]
(iii)

Describe what is meant by the term sex-linked characteristic.

[ 2 ]
(a)

A scientist investigated the inheritance of fur colour in cats.

The gene for coat colour is located on the X chromosome. The gene has two alleles:
- B black
- b orange.

The X chromosome with the allele for black is represented by XB\mathbf{X}^{\mathbf{B}}.
The X chromosome with the allele for orange is Xb\mathbf{X}^{\mathbf{b}}.
A female cat can be a mixture of these colours, described as calico.
Fig. 3.1 shows the inheritance of this condition in a family of cats.

Fig. 3.1

Fig. 3.1

[ 3 ]
(i)

State the genotypes of cats 1, 4, and 5 in Fig. 3.1.
cat 1
cat 4
cat 5

[ 3 ]
0