EduNinja
(a)

Fig. 1.2 shows the pressure of blood flowing through different blood vessels as it travels around the body. (Venules are narrow vessels that connect capillaries to veins.)
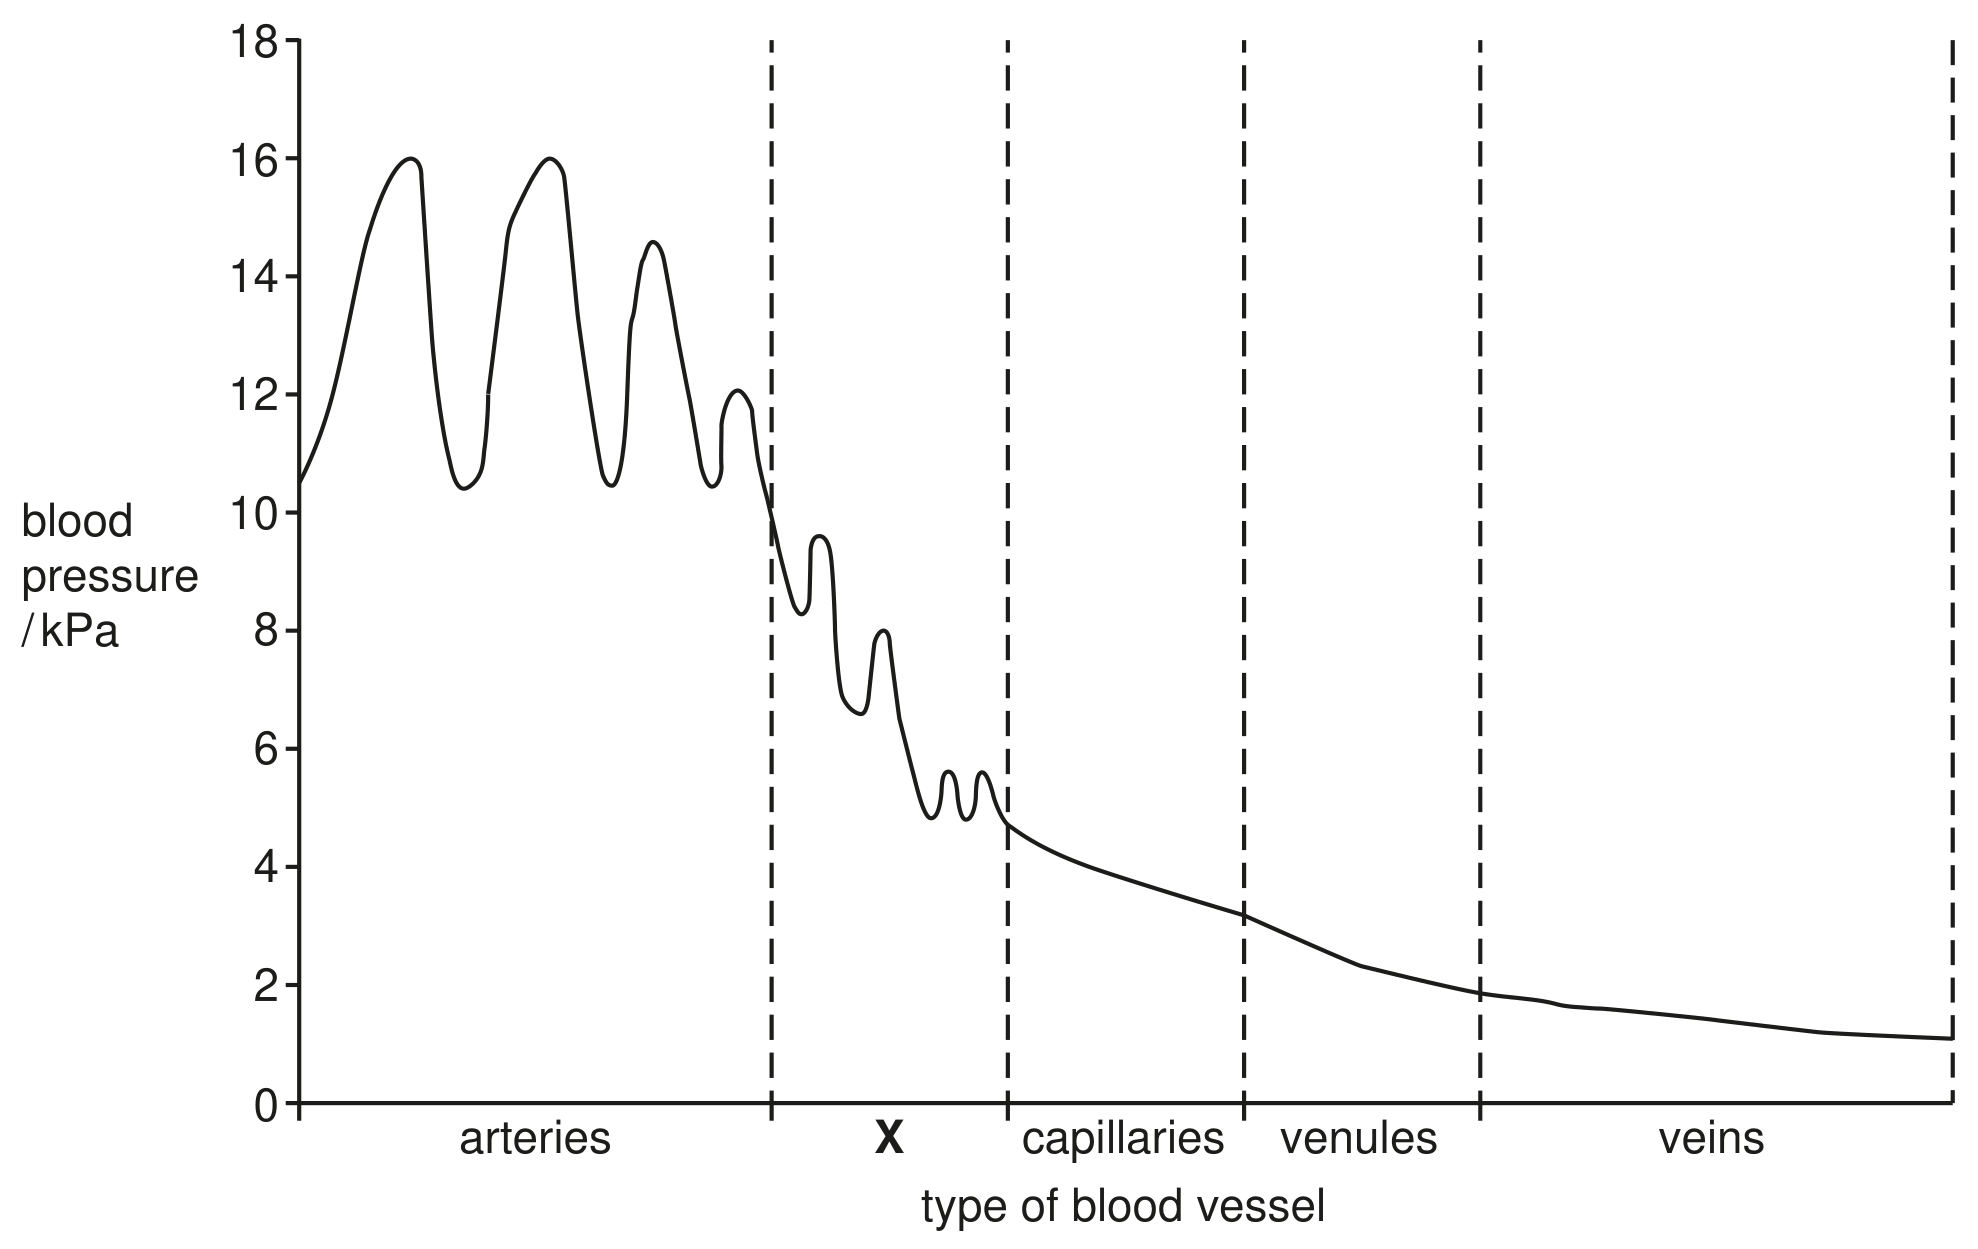
Fig. 1.2

Fig. 1.2

[ 1 ]
(i)

Blood vessels X in Fig. 1.2 supply blood to skin-surface capillaries and have a role in maintaining a constant internal temperature.

State the name of the blood vessels that are represented by the letter X in Fig. 1.2.

[ 1 ]
[Maximum number: 7]

Homeostasis is the maintenance of a constant internal environment.

(a)

Human skin is involved in the maintenance of a constant internal body temperature.

[ 7 ]
(i)

Skin is an organ.

State why the skin is an organ.

[ 1 ]
(ii)

State the names of structures A, B and C in Fig. 1.1.

A

B

C

[ 3 ]
(iii)

Structure [ is a shunt vessel and E is an arteriole.

Describe how these blood vessels are involved in maintaining a constant internal body temperature in a cold environment.

[ 3 ]
[Maximum number: 5]

Fig. 2.1 shows a person sitting in a room. A thermometer shows the temperature of the room.

Fig. 2.1

Fig. 2.1

(a)

The run results in changes in the skin involving the blood vessels and the sweat glands. Describe what happens to the blood vessels and sweat glands during the run. Explain why these changes happen.

[ 5 ]
(a)

Describe the functions of arterioles in the skin.

[ 3 ]
[Maximum number: 12]

Insulin is a hormone that regulates the concentration of glucose in the blood.

(a)

Person A and person B were monitored to see how well they could control their blood glucose concentration.

They did not eat or drink anything other than water for eight hours before the monitoring began. They then drank a glucose solution.

Blood samples were taken at 30 -minute intervals.
The blood samples were tested for glucose concentration.
The results are shown in Fig. 2.1.
blood glucose concentration
/ mg per 100 cm3100 \mathrm{~cm}^{3}

Fig. 2.1

Fig. 2.1

[ 12 ]
(i)

Calculate the percentage increase in the blood glucose concentration in person A between 60 and 90 minutes.

Give your answer to the nearest whole number.

[ 3 ]
(ii)

Using Fig. 2.1, compare the response of person A with the response of person B after the ingestion of glucose.

[ 3 ]
(iii)

Using Fig. 2.1, explain the response of person B after 90 minutes.

[ 4 ]
(iv)

Person A had Type 1 diabetes.

Outline the treatment of Type 1 diabetes.

[ 2 ]
[Maximum number: 4]

The kidneys filter blood, separate useful molecules from excretory wastes and control the water content of the blood.

Fig. 2.1 is a diagram of a kidney tubule and associated blood vessels. The arrows show the direction of blood flow.

Fig. 2.2 is a drawing of a vertical section through a cell from the lining of region 2 of the tubule.

Fig. 2.1

Fig. 2.1

Fig. 2.2

Fig. 2.2

(a)

The kidneys are examples of organs that help the body to maintain a constant internal environment.

[ 4 ]
(i)

State the term for maintaining a constant internal environment by negative feedback.

[ 1 ]
(ii)

Explain how negative feedback controls the blood glucose concentration of a person who has not eaten for a day.

[ 3 ]
[Maximum number: 4]

Insulin is a protein made by cells in the pancreas.
Fig. 2.1 shows how insulin is made in a pancreatic cell.

Fig. 2.1

Fig. 2.1

(a)

Insulin is secreted from cells in the pancreas when the concentration of glucose in the blood increases.

Outline the role of insulin.

[ 4 ]
[Maximum number: 1]

Bacteria are used in many biotechnological processes.

(a)

Insulin is one of many human proteins that are made by genetically engineered bacteria.

Some people cannot produce insulin because their immune system has destroyed the cells that make insulin.

[ 1 ]
(i)

State the name of the disease caused by the destruction of these cells.

[ 1 ]
[Maximum number: 17]

Fig. 3.1 shows a section through a kidney.

Fig. 3.1

Fig. 3.1

(a)

The half-life of a drug is the time it takes for the concentration in the blood to decrease by a factor of a half. The half-life of one form of testosterone taken to improve sporting performance is 7 days.

A person received an injection of this form of testosterone. A blood sample taken almost immediately showed its concentration to be 50ngcm350 \mathrm{ng} \mathrm{cm}^{-3}.

Predict the concentration after 14 days, assuming the person does not have another injection, and show your working.

0