EduNinja
[Maximum number: 8]

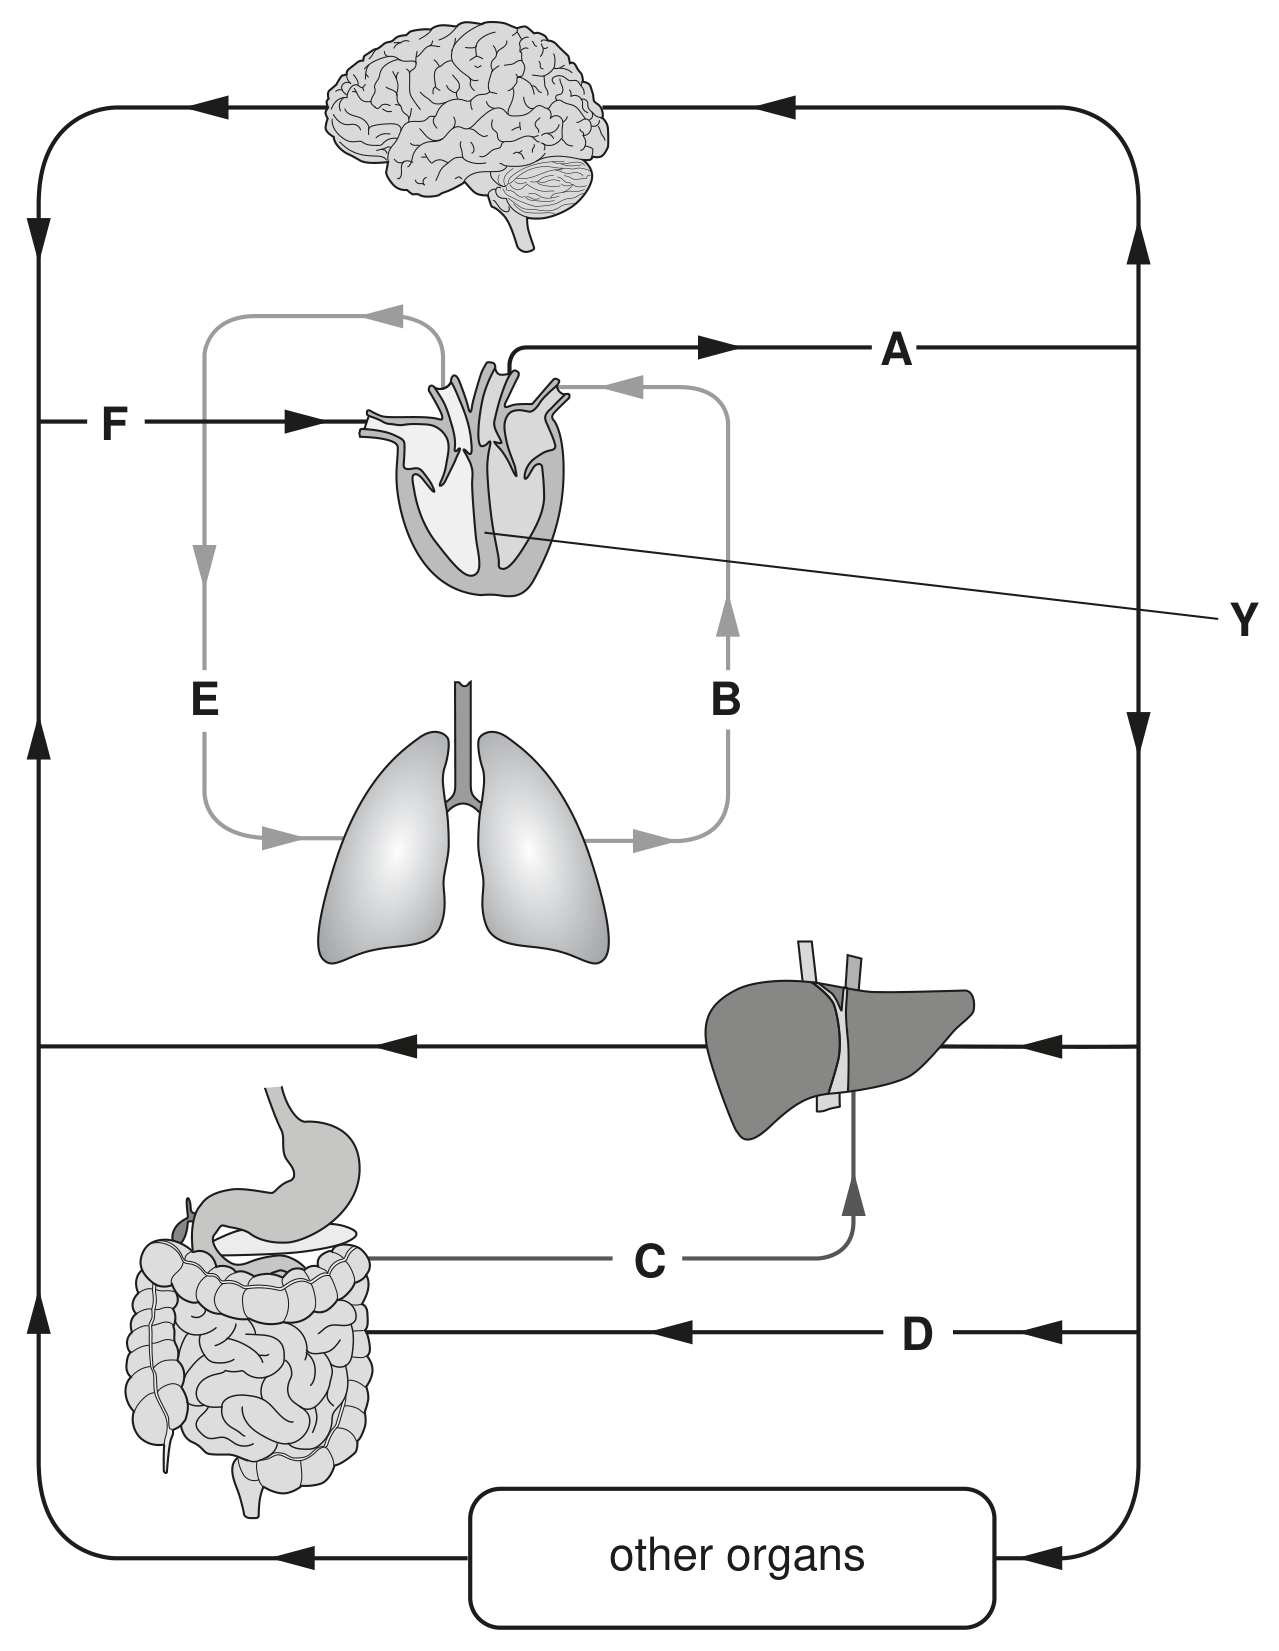
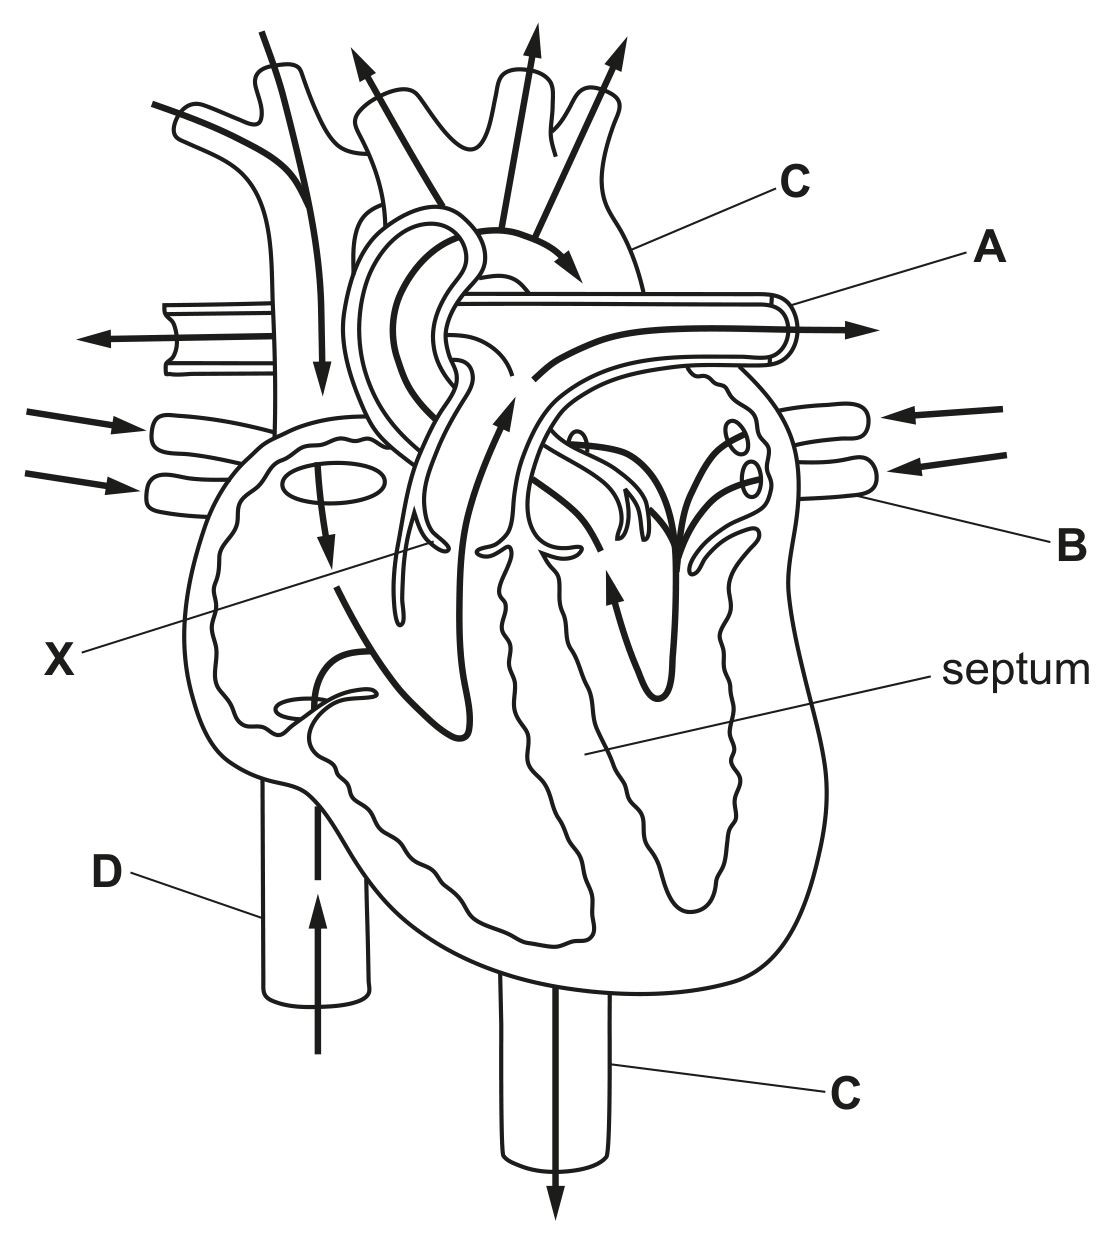
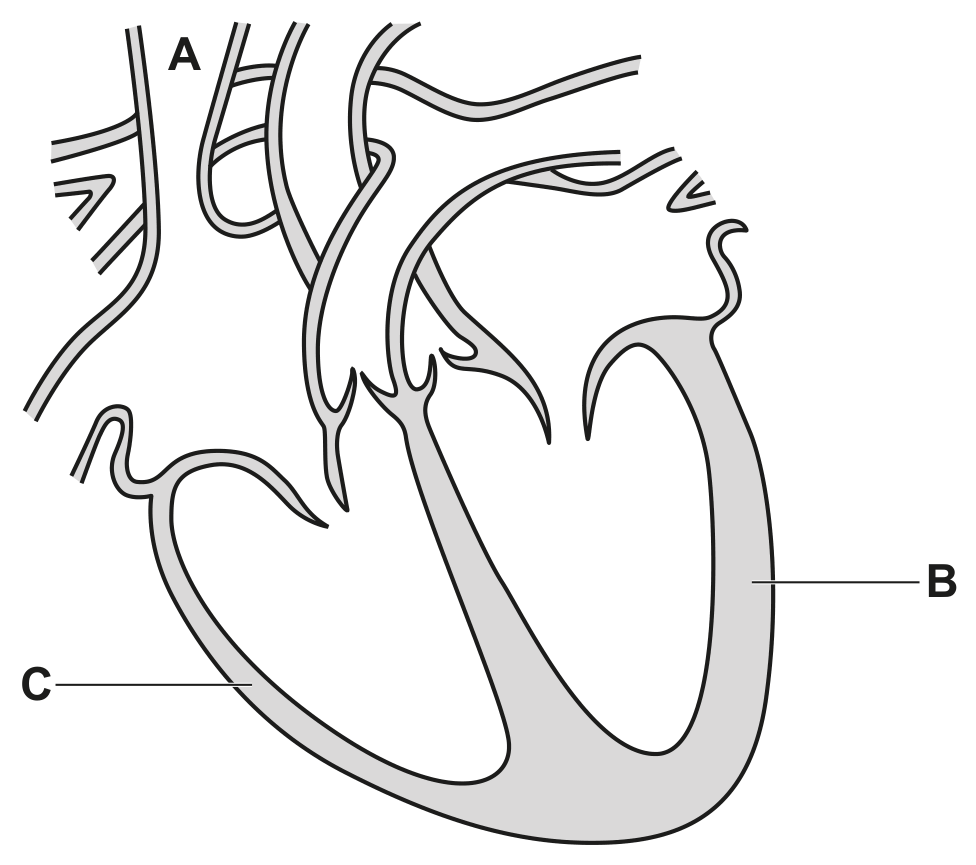
All mammals have a double circulatory system. Fig. 1.1 shows part of the human double circulatory system.
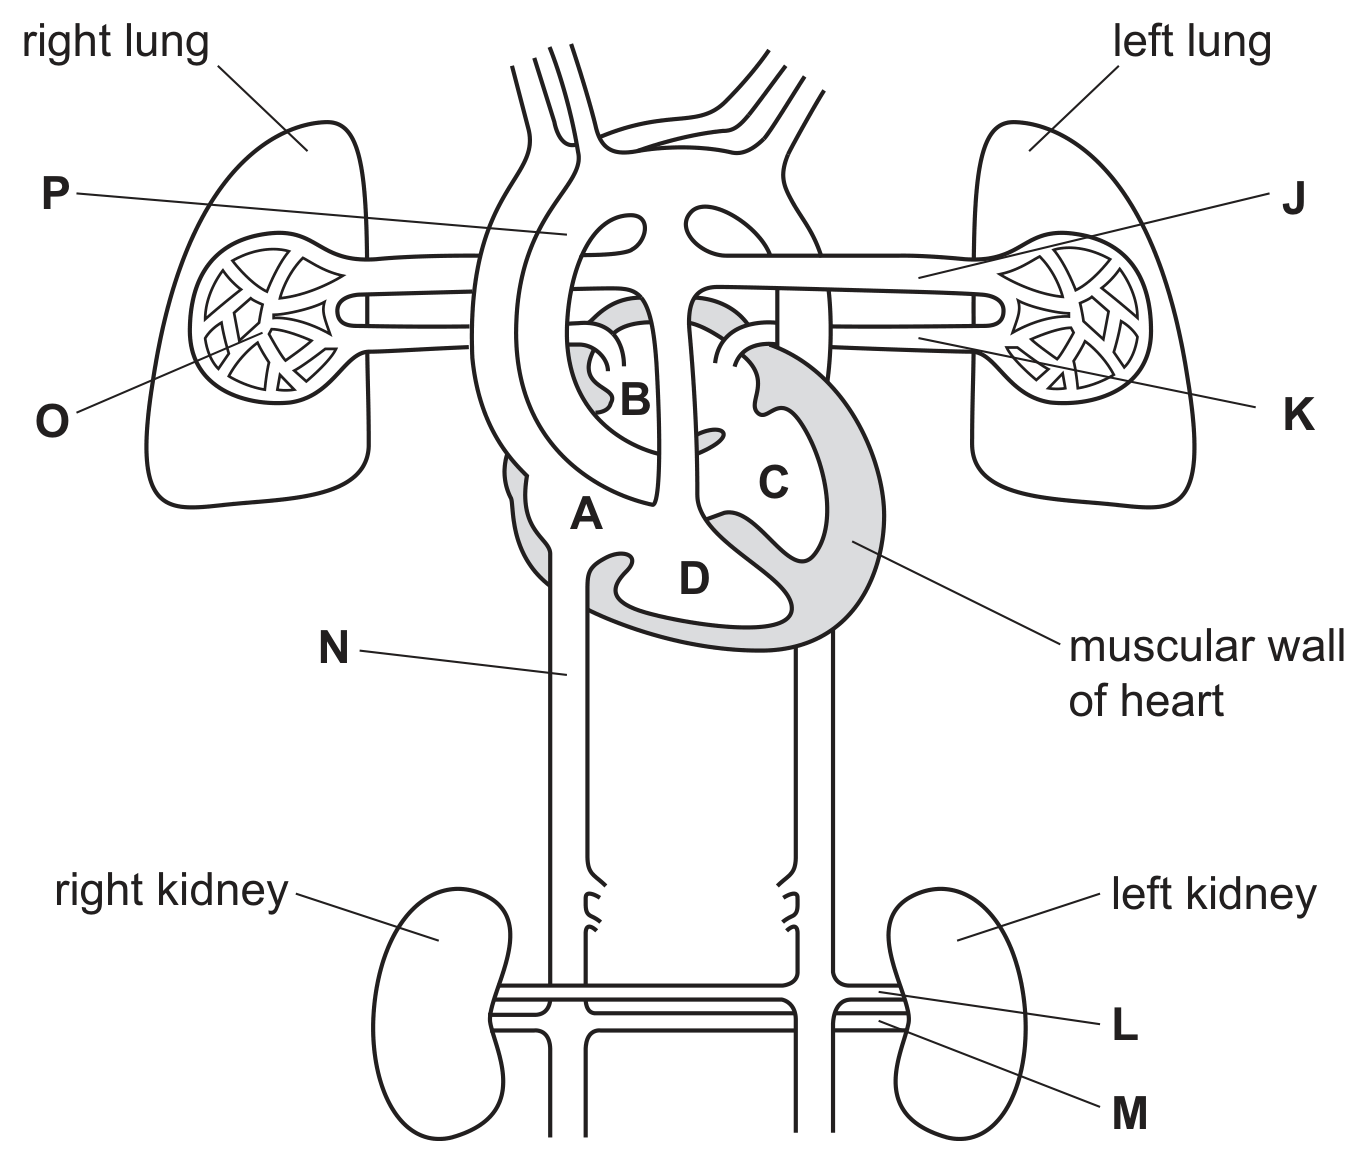
Fig. 1.1

Fig. 1.1

(a)

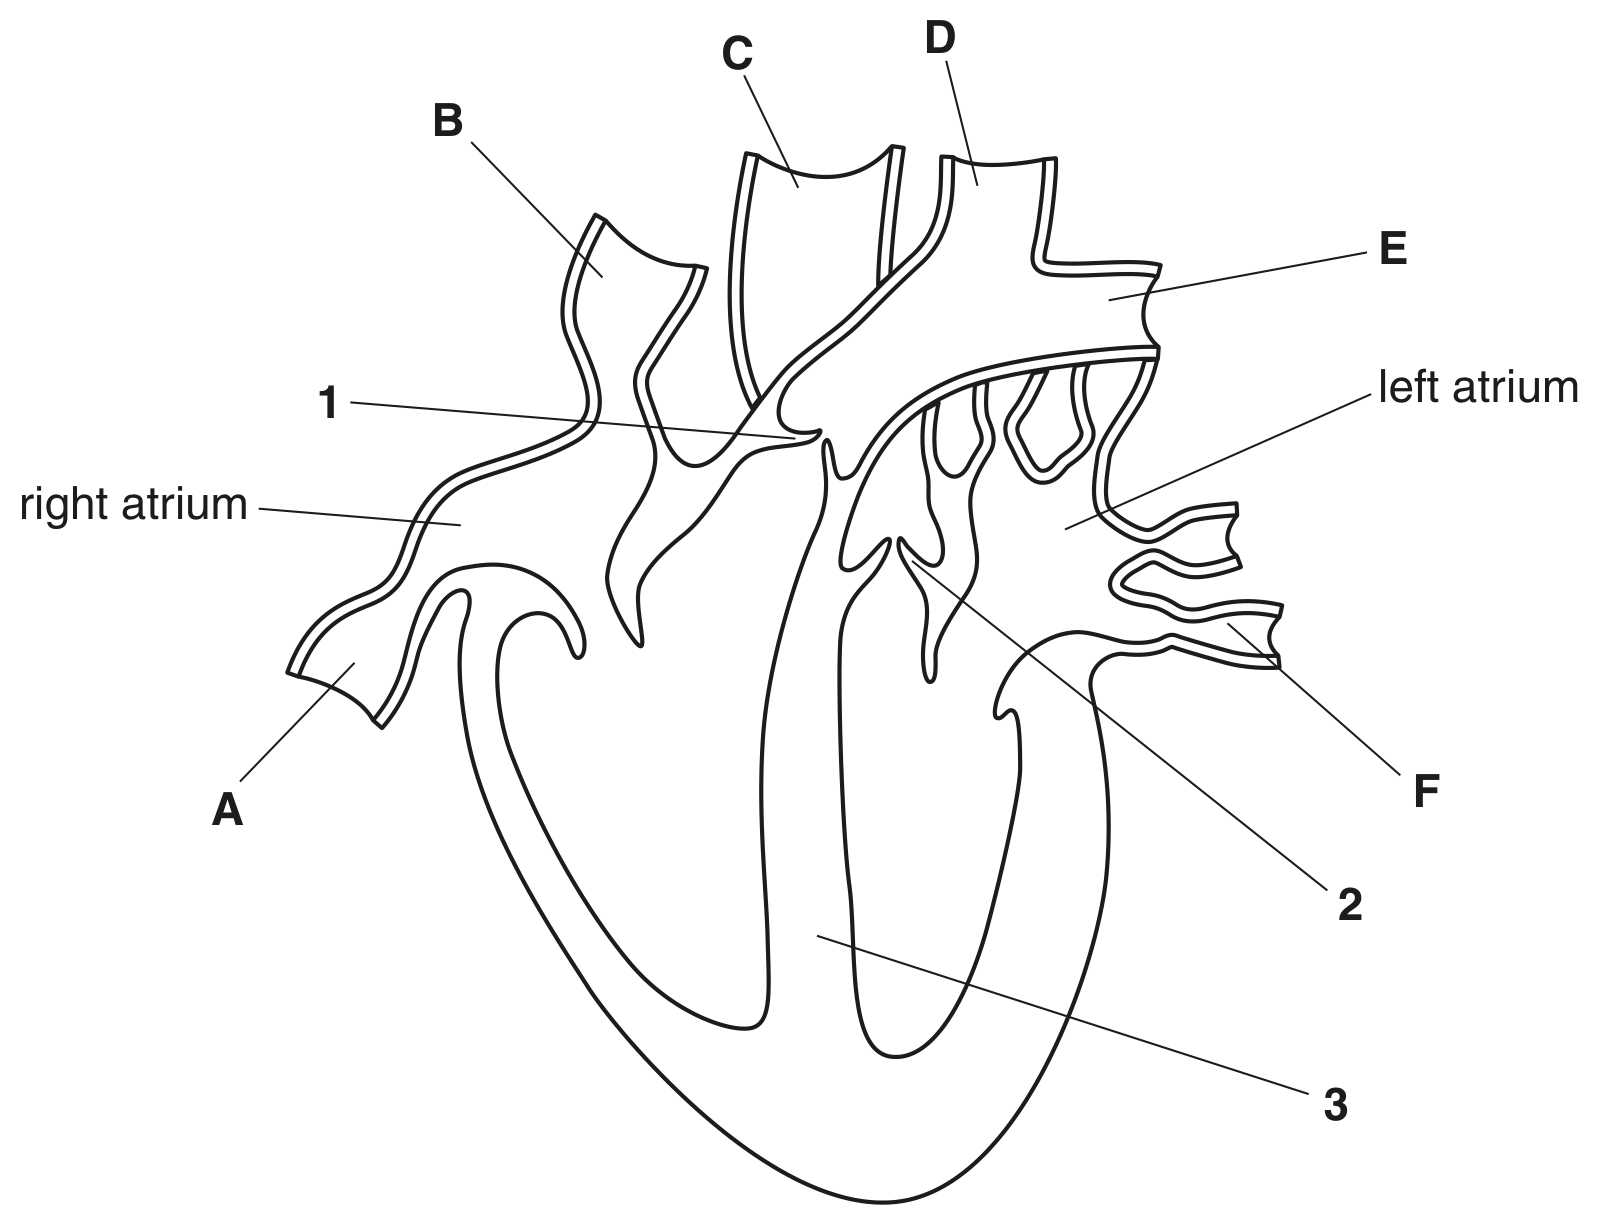
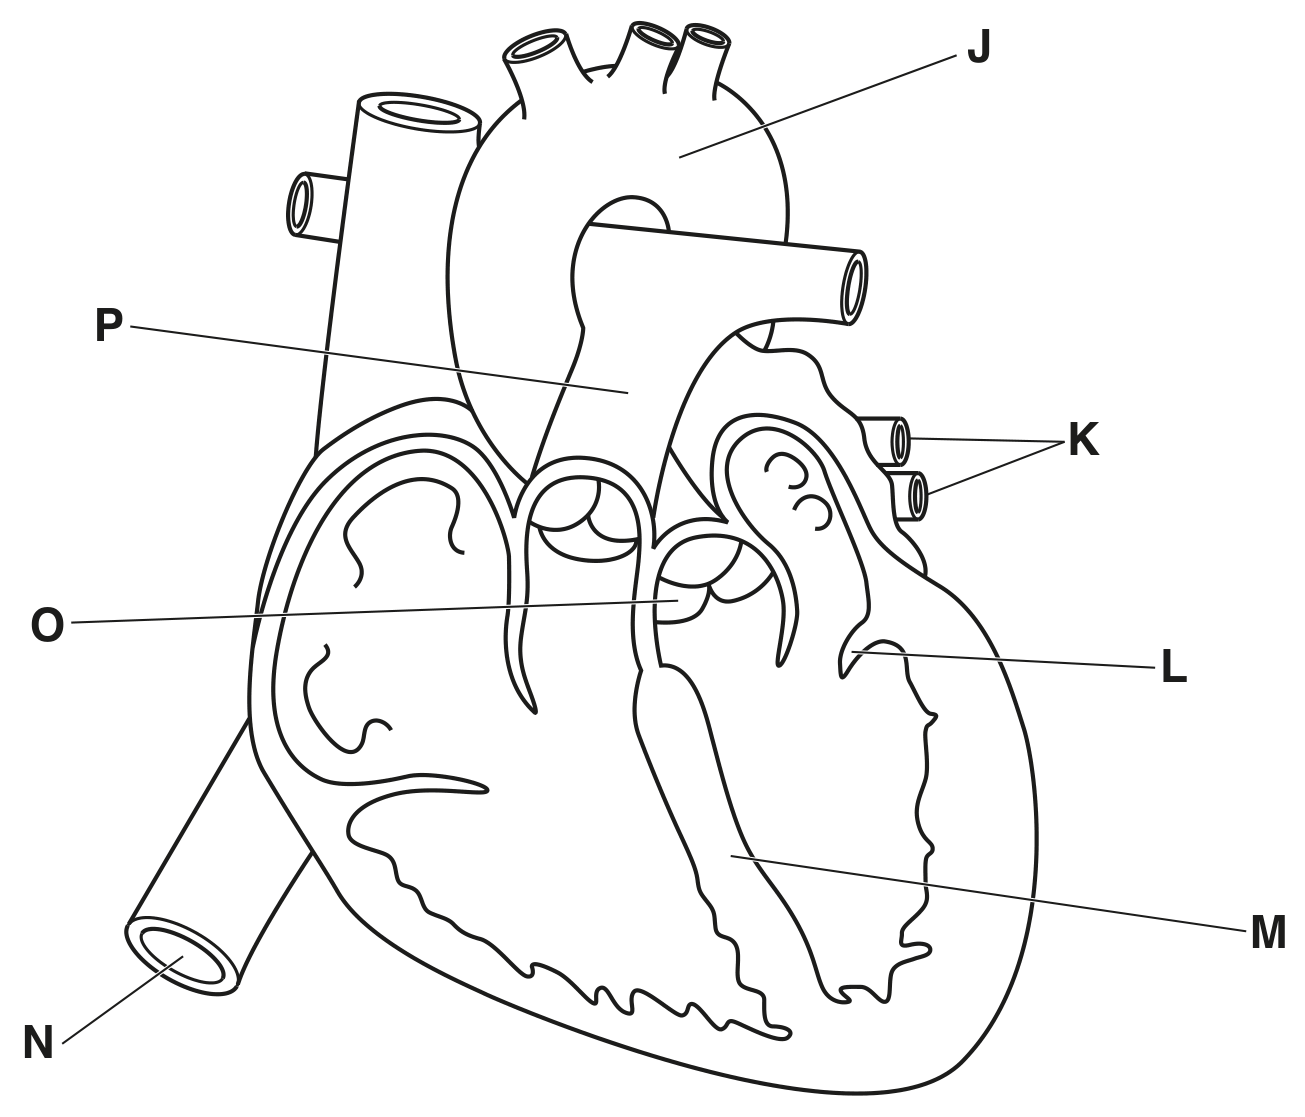
Name the muscular wall that separates the left and right sides of the human heart.

[ 1 ]
(b)

Table 1.1 describes some of the structures of the human circulatory system shown in Fig.1.1. Complete the table.

One row has been done for you.
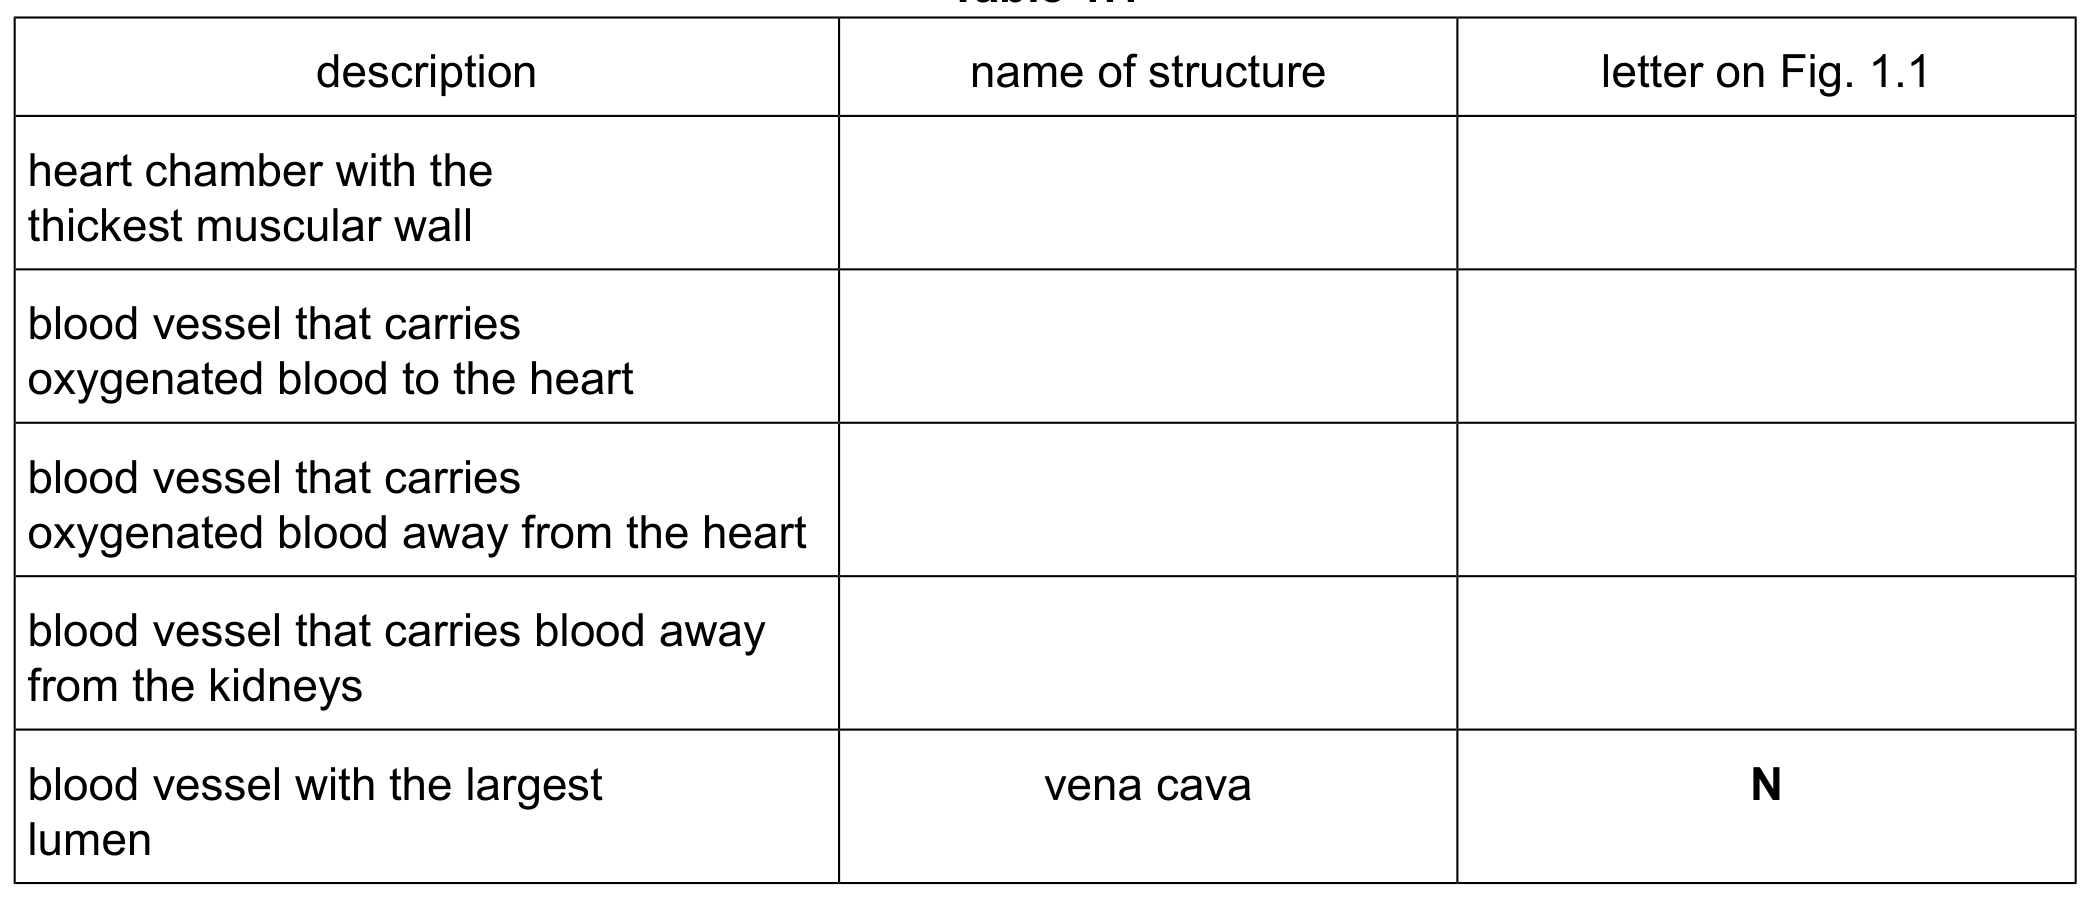
Table 1.1

Table 1.1

[ 4 ]
(c)
(i)

Doctors recommend that a healthy diet can reduce the risk of coronary heart disease. Give one other lifestyle improvement patients can make that can reduce the risk of coronary heart disease.

[ 1 ]
(ii)

Sometimes surgery is required to treat coronary heart disease.

Describe one named example of surgery that can treat coronary heart disease.

[ 2 ]
(a)

Fig. 1.1 is a simplified diagram of the circulatory system in humans.

Fig. 1.1

Fig. 1.1

[ 2 ]
(i)

Explain the importance of the part labelled Y in Fig. 1.1.

[ 2 ]
(b)

Fig. 1.2 shows the pressure of blood flowing through different blood vessels as it travels around the body. (Venules are narrow vessels that connect capillaries to veins.)

Fig. 1.2

Fig. 1.2

[ 2 ]
(i)

Explain reasons for the changes in pressure seen in the arteries in Fig. 1.2.

[ 2 ]
[Maximum number: 8]

Fig. 1.1 is a diagram of the human heart. The diagram shows the phase during the heart beat when the atria contract. The blood vessels that carry blood to and from the heart are labelled A to F.

Fig. 1.1

Fig. 1.1

(a)
(i)

Draw one arrow on Fig. 1.1 to show the pathway taken by blood from a vein into the right ventricle.

[ 1 ]
(b)
(i)

Suggest what causes the valves at 1 and 2 to close during a heart beat.

[ 1 ]
(c)

Fig. 1.1 shows the phase of the heartbeat when the ventricles are filling with blood.

Using Fig. 1.1, describe and explain how the blood travels from the right ventricle to the lungs.

[ 4 ]
(d)

State the name of the part of the heart labelled 3 and state its role in the mammalian circulation.
name
role

[ 2 ]
[Maximum number: 13]

Fig. 1.1 shows a vertical section through a human heart and the major blood vessels.

Fig. 1.1

Fig. 1.1

(a)
(i)

State the names of the structures labelled L, M and O as shown in Fig. 1.1.

L

M

0

[ 3 ]
(ii)

Identify a letter on Fig. 1.1 that represents a blood vessel that has:
blood with the highest concentration of carbon dioxide
blood with the highest concentration of oxygen
the highest pressure

[ 3 ]
(b)
(i)

Describe how blood is moved by the heart from blood vessel K to blood vessel J.

[ 5 ]
(ii)

Explain why the wall of the left ventricle is thicker than the wall of the right ventricle.

[ 2 ]
[Maximum number: 9]

Fat is a necessary component of the human diet.

(a)

Describe how too much fat in the diet may cause coronary heart disease.

[ 3 ]
(b)

Describe and explain how coronary heart disease can be treated.

[ 6 ]
[Maximum number: 3]

Mammals have a double circulation.
Fig. 2.1 is a diagram of a section through the heart of a mammal. The arrows show the direction of blood flow through the heart and blood vessels.

Fig. 2.1

Fig. 2.1

(a)
(i)

State the name of the chamber of the heart with the thickest wall.

[ 1 ]
(ii)

Identify the structure labelled X in Fig. 2.1 and state its role in the heart.

[ 2 ]
[Maximum number: 13]

A group of students investigated the effect of exercise on their heart rates.
They measured their heart rates:
- before exercise
- immediately after running 1 km
- one minute after running 1 km

Before doing the investigation they wrote a hypothesis.

(a)
(i)

Write a hypothesis for this investigation.

[ 2 ]
(ii)

The students measured their pulse as an indicator of heart rate.

Describe how the students could measure their pulse.

[ 2 ]
(b)

In another investigation, a doctor tested some of her patients to determine the effect of exercise on coronary heart disease.

Coronary heart disease is caused by a blockage in the coronary artery.
Describe the effect on the heart of a blockage in the coronary artery.

[ 2 ]
(c)

The doctor divided her coronary heart disease patients randomly into two equal groups.

Each group was given different instructions:
- group A - patients were given a daily exercise plan
- group B - patients were told to make their own exercise plan.

The doctor measured the heart rate (HR) of each patient immediately after doing exercise and again one minute later.

She calculated their heart rate recovery using this formula:
heart rate recovery = HR immediately after exercise - HR one minute after exercise.
She then calculated the average heart rate recovery for each of the two groups of patients.
The doctor repeated these measurements after three months and after six months.
The results are shown in Fig. 2.1.

Fig. 2.1

Fig. 2.1

Describe and explain the effect of exercise on the average heart rate recovery of the coronary heart disease patients in group A and group B.

Use data from Fig. 2.1 to support your answer.

[ 6 ]
(d)

Exercise may reduce the risk of coronary heart disease.

State one other possible way of reducing the risk of developing coronary heart disease.

[ 1 ]
[Maximum number: 6]

Fig. 2.1 shows a cross-section of a human heart.

Fig. 2.1

Fig. 2.1

(a)
(i)

On Fig. 2.1, label with an R the position of the right ventricle.

[ 1 ]
(ii)

State the names of the structures labelled A and B on Fig. 2.1.

A
B

[ 2 ]
(b)

Fig. 2.2 shows a cross-section of part of a heart that has an incomplete structure.

Fig. 2.2

Fig. 2.2

Explain how the incomplete heart structure shown in Fig. 2.2 may affect a person's ability to transport oxygen.

[ 3 ]
[Maximum number: 10]

Fig. 3.1 is a diagram of a section through a human heart.

Fig. 3.1

Fig. 3.1

(a)

Draw an X on the septum in Fig. 3.1.

[ 1 ]
(b)

Explain the reason for the difference between the thickness of the walls at B and at C in Fig. 3.1.

[ 2 ]
(c)

An athlete measured her heart rate during a running race. She recorded it before the race, during the race and during her recovery.

Her results are shown in Fig. 3.2.

Fig. 3.2

Fig. 3.2

[ 7 ]
(i)

Suggest how the athlete could monitor the activity of her heart.

[ 1 ]
(ii)

Calculate the percentage change in heart rate from the maximum heart rate reached during the race until the heart rate recorded at 18 minutes.
Give your answer to three significant figures.
.

[ 3 ]
(iii)

Explain why heart rate must increase during exercise.

[ 3 ]
[Maximum number: 9]

Heart rate is influenced by electrical impulses from the brain.

(a)

The electrical activity of the heart can be recorded on an ECG.

Fig. 3.1 shows an ECG of one heartbeat.

Fig. 3.1

Fig. 3.1

[ 4 ]
(i)

Table 3.1 shows how the electrical activity, during one heartbeat, corresponds to the opening and closing of the valves in the heart.

Complete Table 3.1 using the words 'open' and 'closed'.

Table 3.1

Table 3.1

[ 3 ]
(ii)

State the function of heart valves.

[ 1 ]
(b)

Fig. 3.2 shows the ECG of an athlete before and during exercise.

Fig. 3.2

Fig. 3.2

[ 5 ]
(i)

Calculate the heart rate, in beats per minute, before exercise begins.

Show your working and give your answer to the nearest whole number. beats per minute

[ 2 ]
(ii)

Using Fig. 3.2, describe how the electrical activity of the heart during exercise differs from the electrical activity before exercise begins.

[ 3 ]
0