A student investigated the effect of bile on the digestion of fat in milk.
They set up three different test-tubes:
- test-tube A contained milk and bile
- test-tube B contained milk and lipase
- test-tube C contained milk, lipase and bile.
They used an indicator that is pink in alkaline solutions and colourless in acidic solutions. They added the same volume of indicator to each test-tube.
The student observed and recorded the colour of the contents of each test-tube at 0 minutes, 20 minutes and 40 minutes.
Table 1.1 shows the results of the investigation.
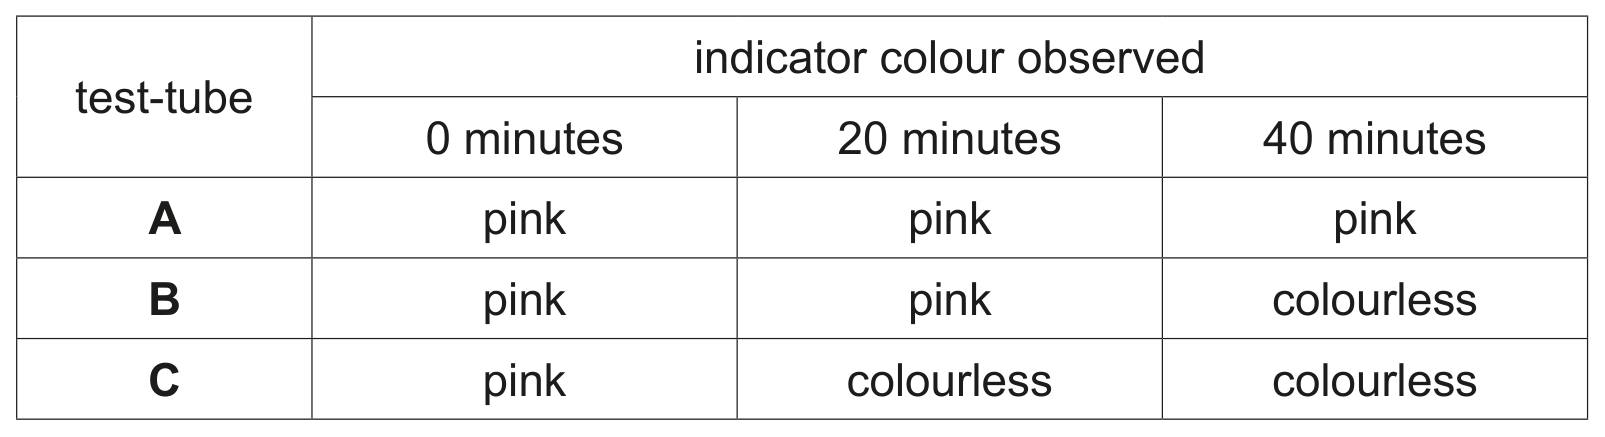
Table 1.1
Explain the results for test-tubes B and C in Table 1.1.
Explain the purpose of test-tube A in Table 1.1.
The action of lipase is affected by temperature.
Fig. 1.2 shows the axes for a graph of the effect of temperature on the activity of lipase.
Complete the graph by:
- drawing a line to show the expected effect of temperature on the activity of lipase
- adding a label line and a label to show the point at which all the lipase has been denatured.
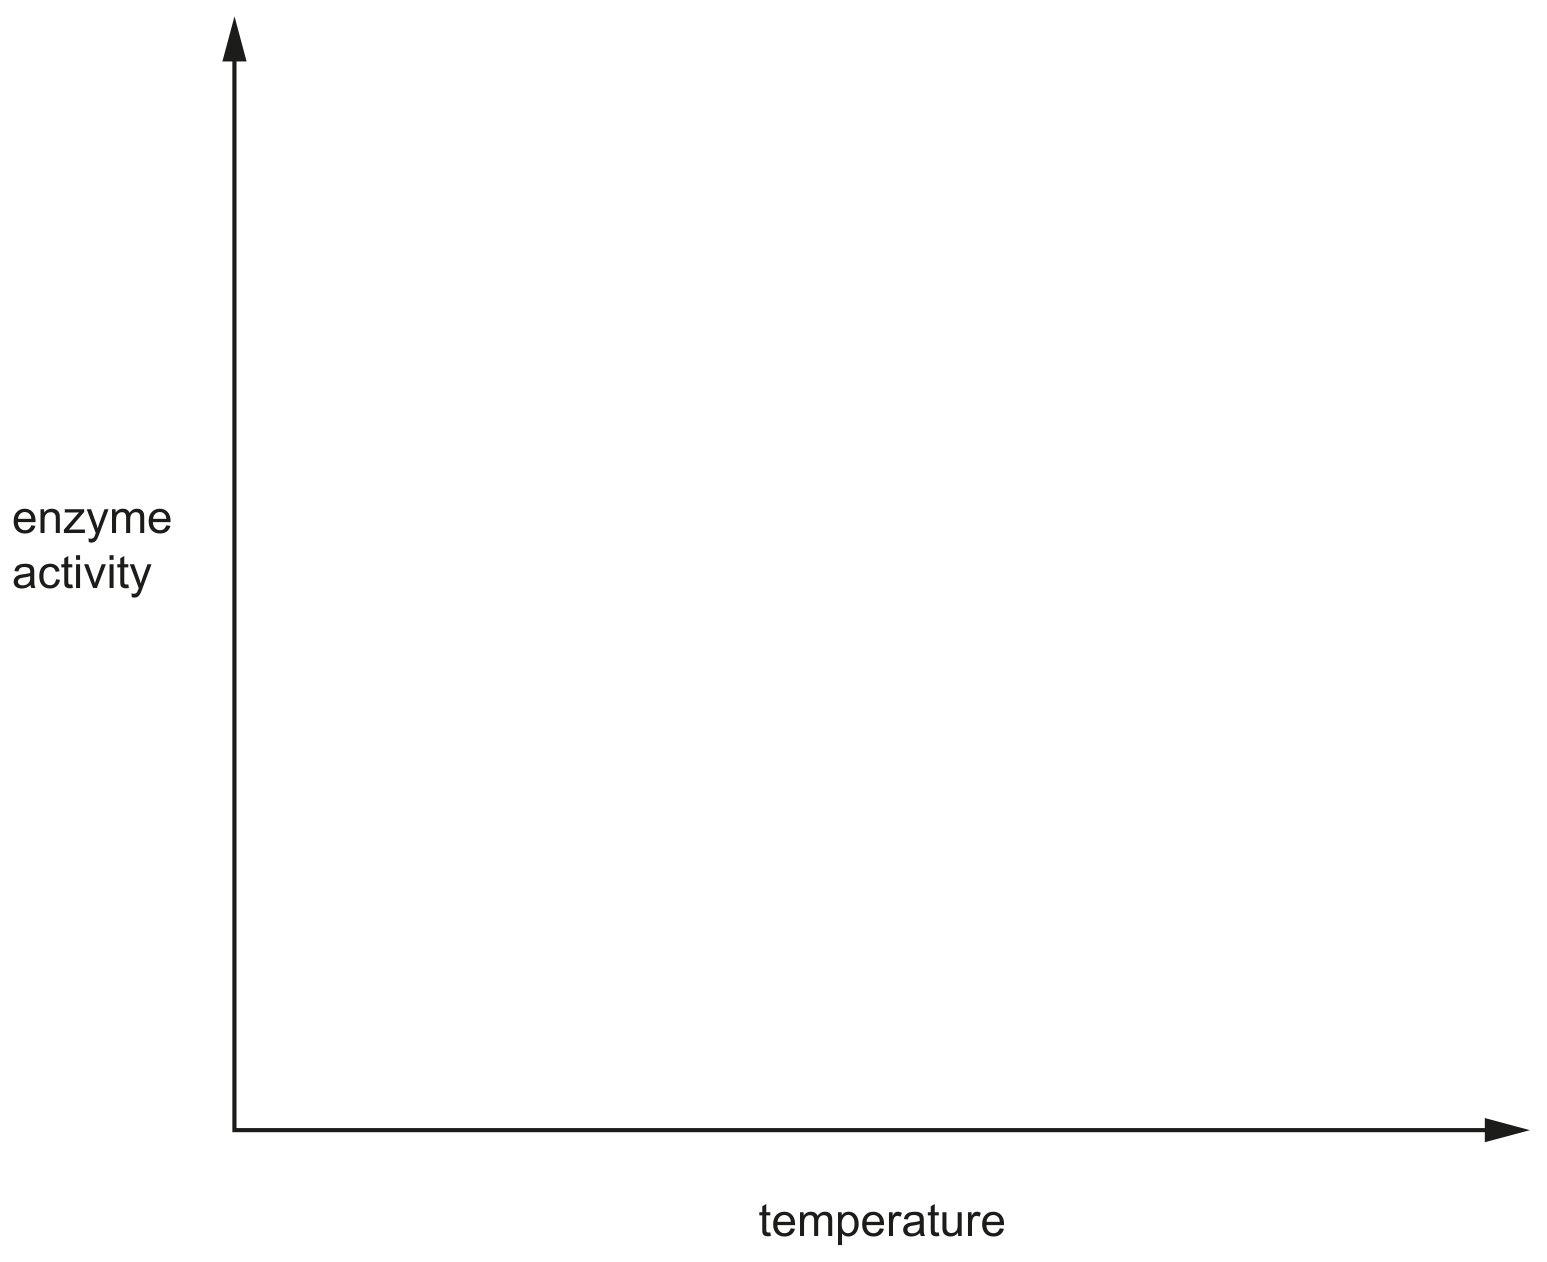
Fig. 1.2