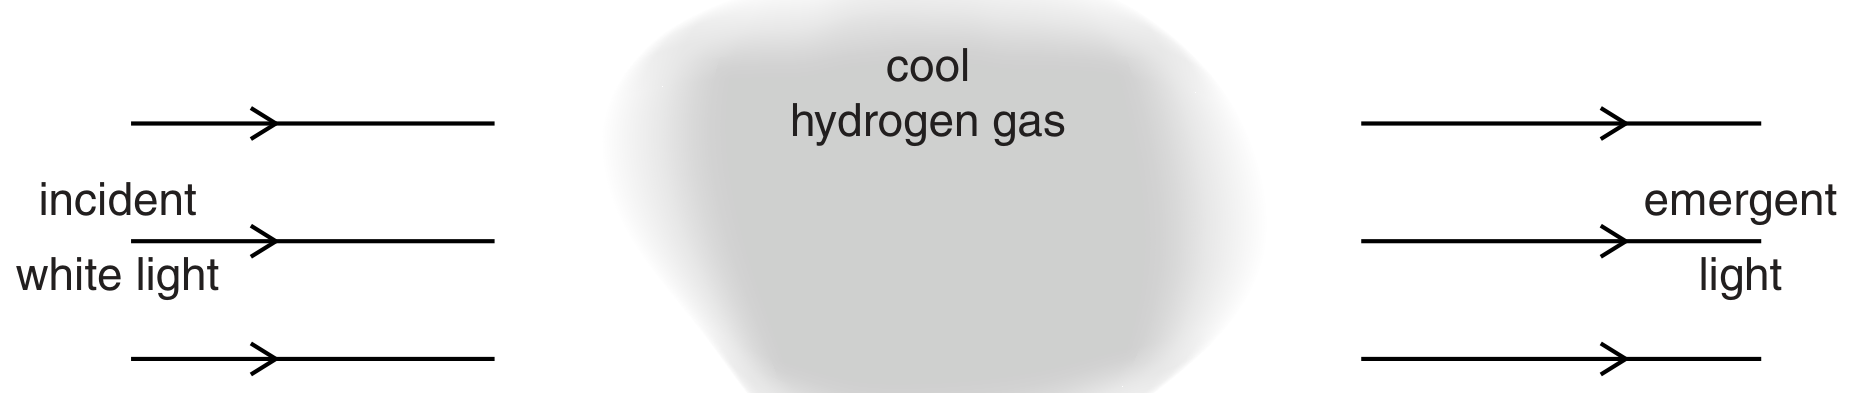
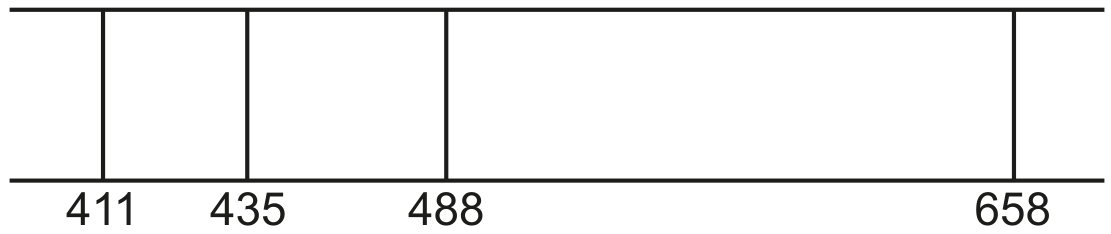
The emission spectrum of atomic hydrogen consists of a number of discrete wavelengths. Explain how this observation leads to an understanding that there are discrete electron energy levels in atoms.
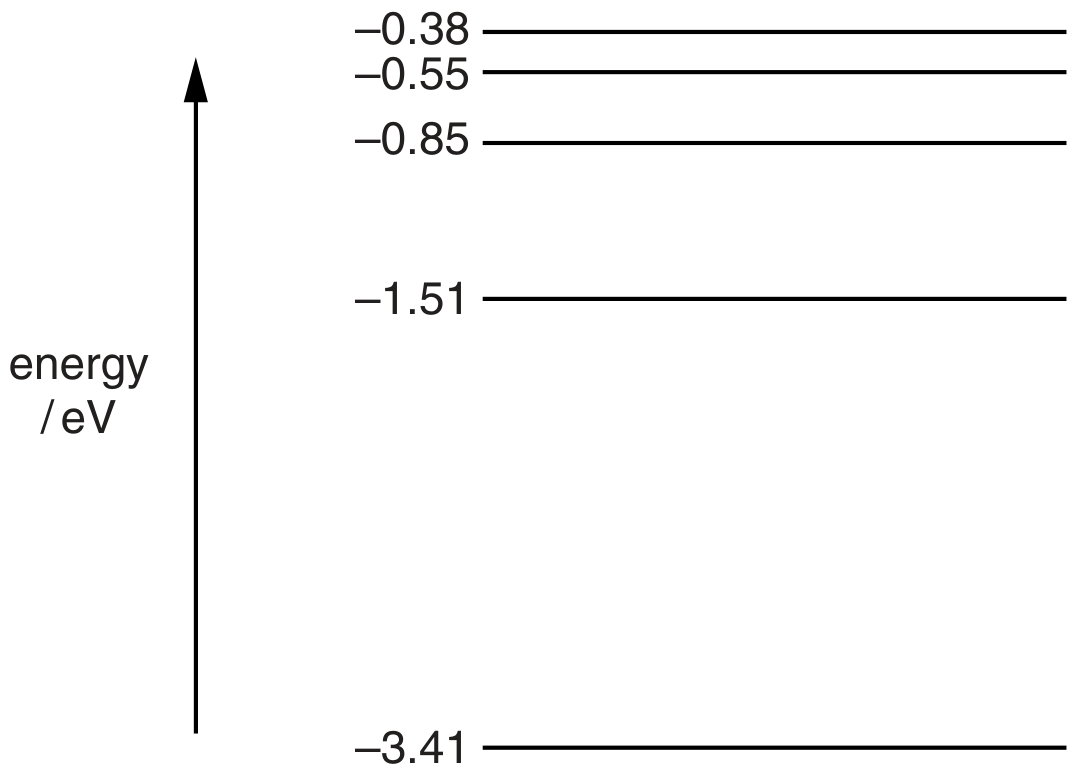
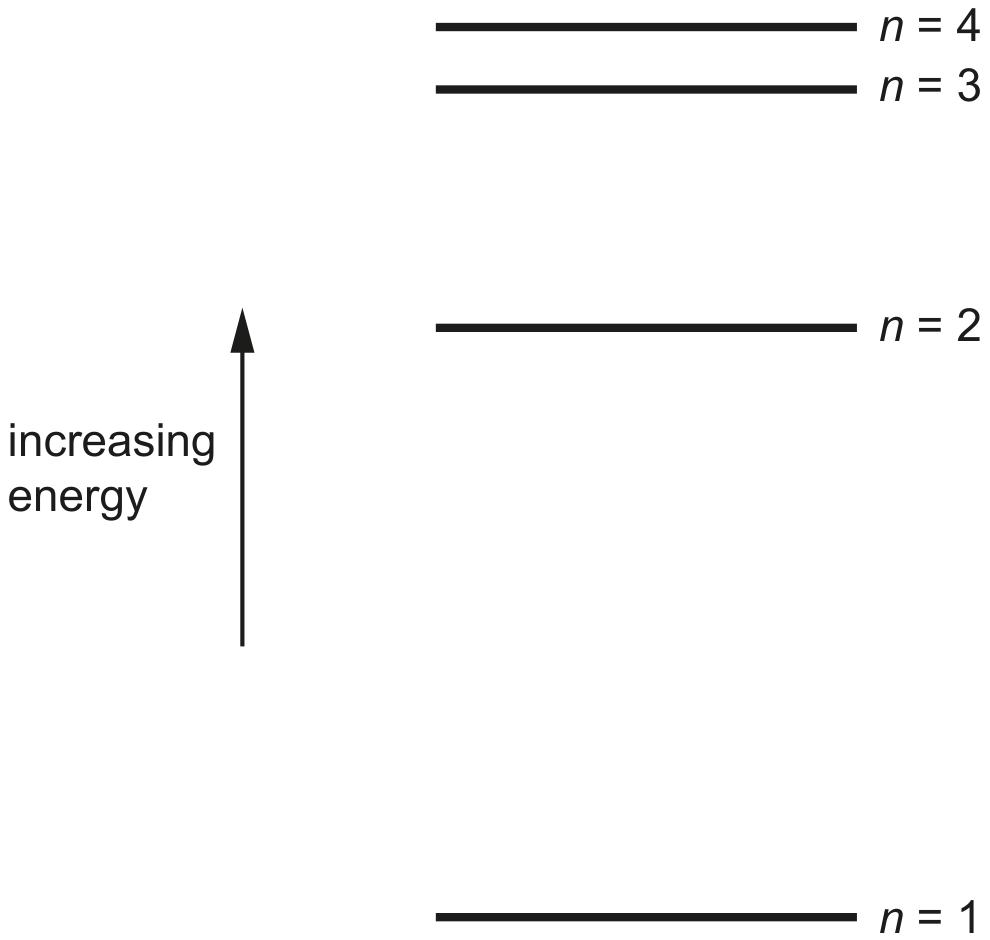
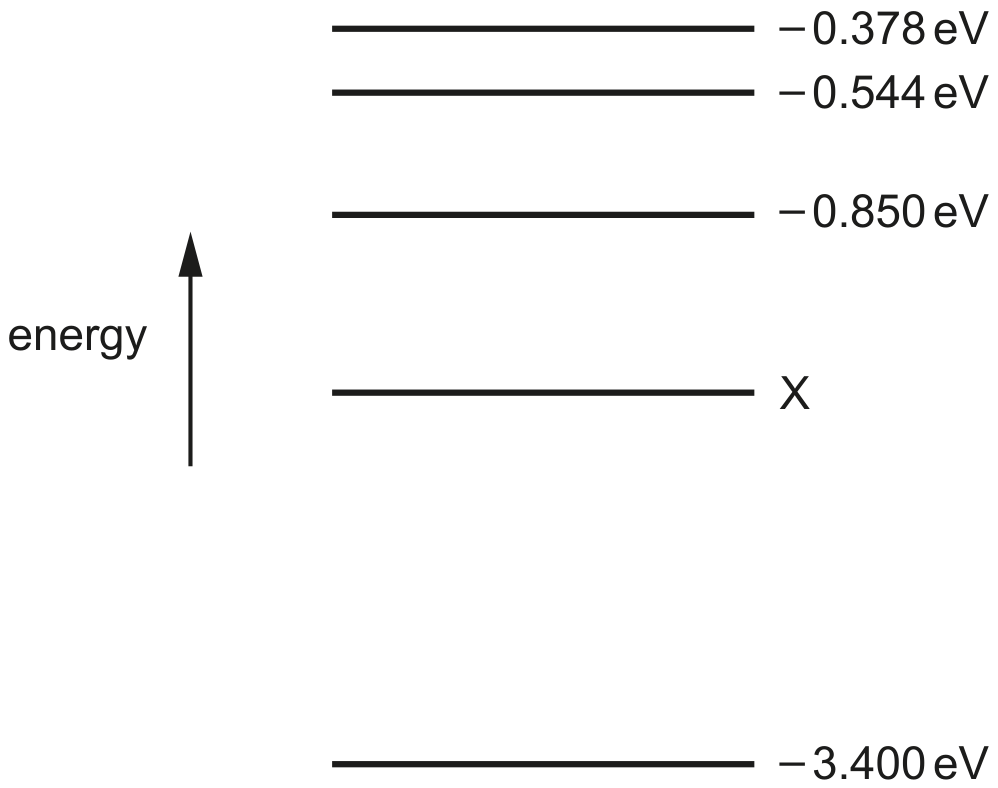
Some electron energy levels in atomic hydrogen are illustrated in Fig. 7.1.
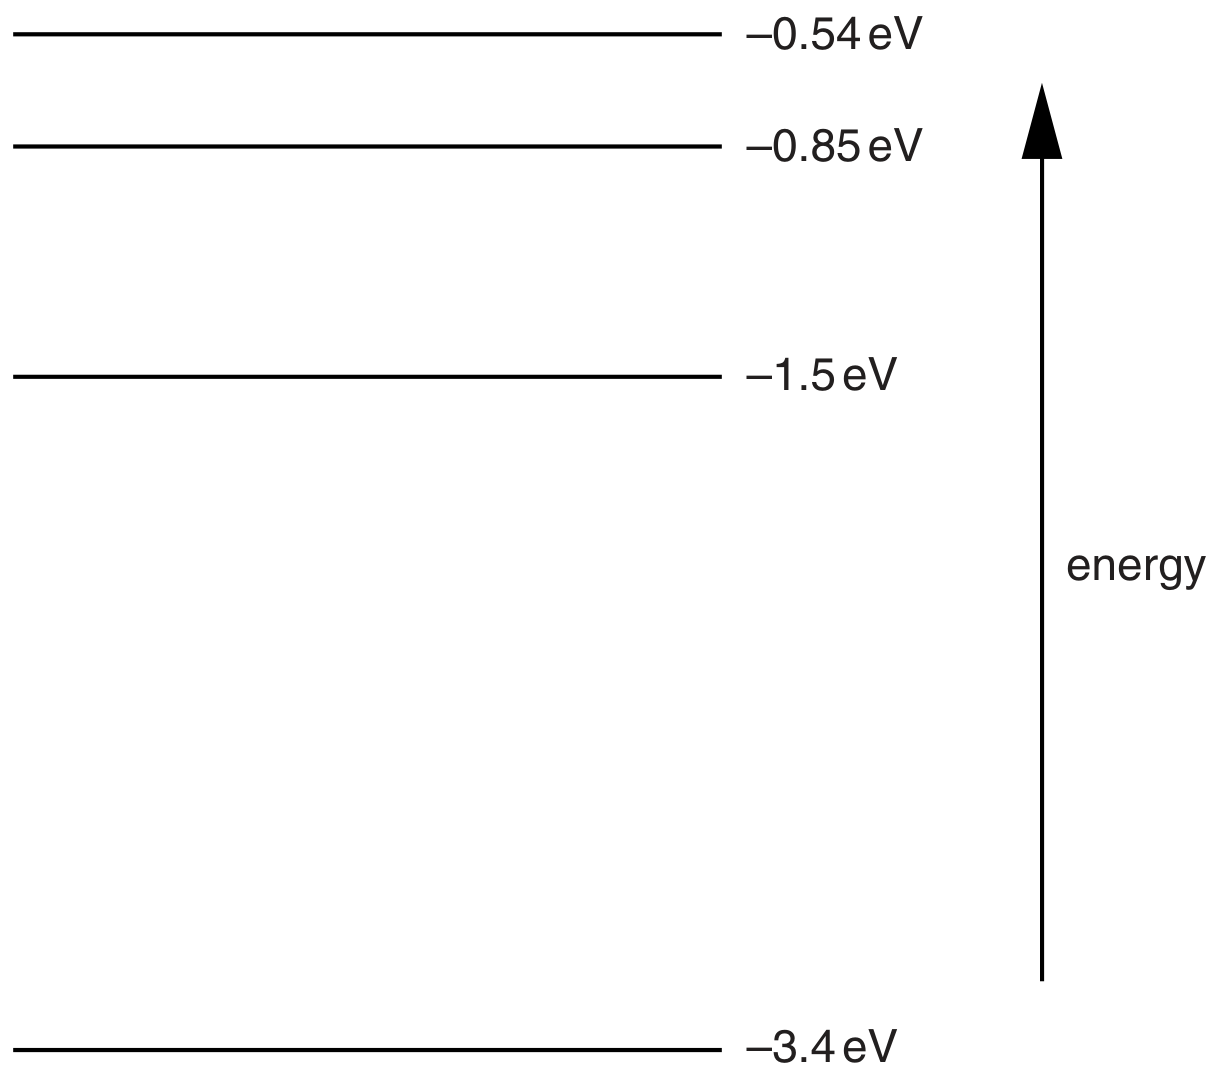
Fig. 7.1
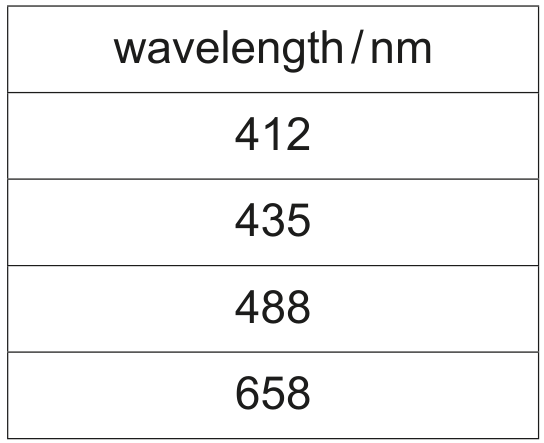
The longest wavelength produced as a result of electron transitions between two of the energy levels shown in Fig. 7.1 is .
On Fig. 7.1,
1. draw, and mark with the letter L , the transition giving rise to the wavelength of ,
2. draw, and mark with the letter S , the transition giving rise to the shortest wavelength.
Calculate the wavelength for the transition you have shown in (i) part 2.
m
Photon energies in the visible spectrum vary between approximately 3.66 eV and 1.83 eV .
Determine the energies, in eV, of photons in the visible spectrum that are produced by transitions between the energy levels shown in Fig. 7.1.
photon energies eV