EduNinja
[Maximum number: 1]

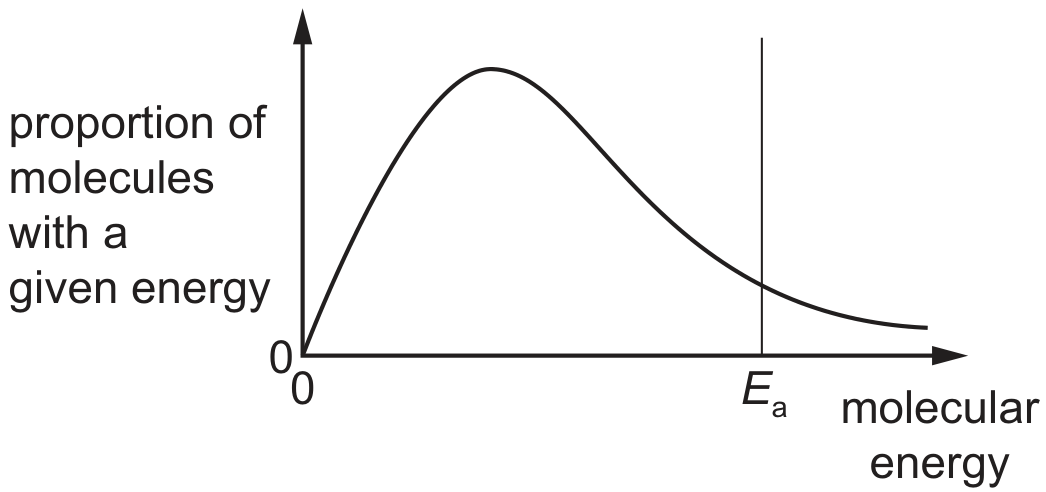
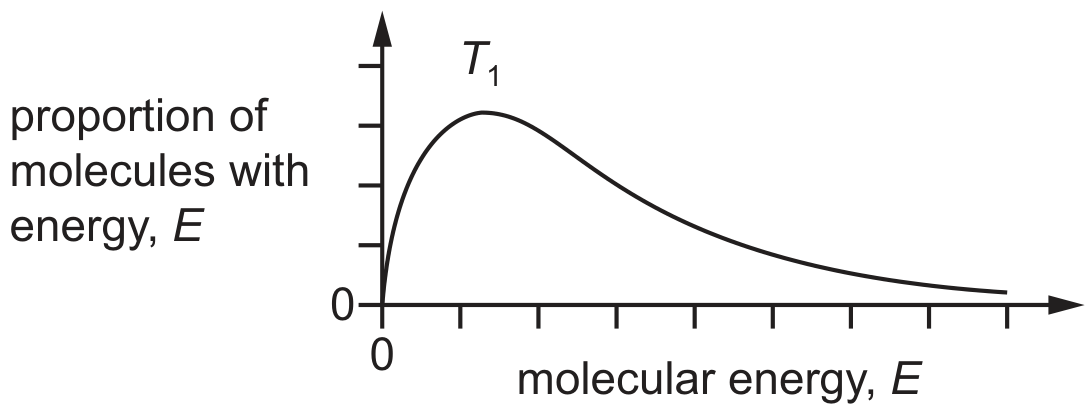
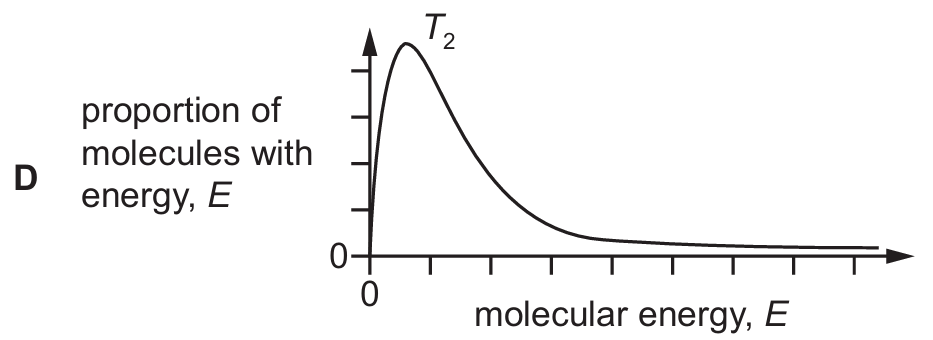
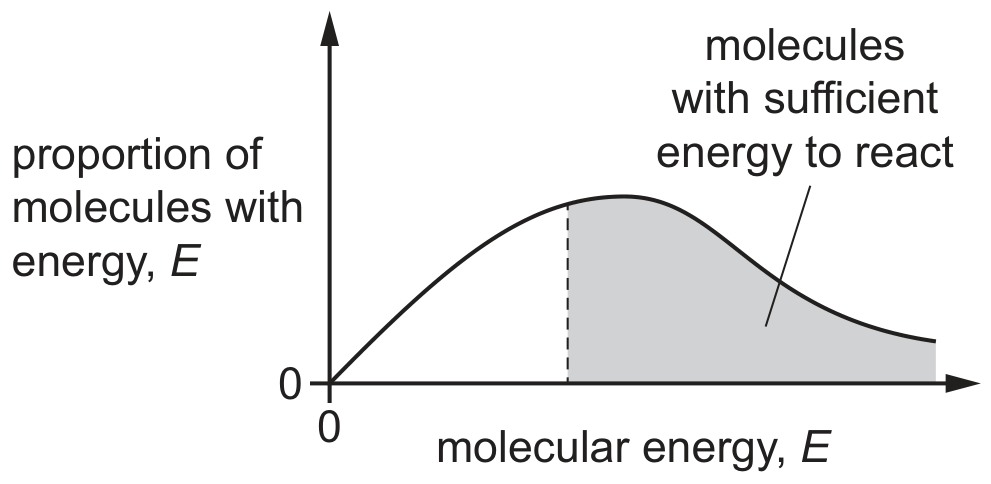
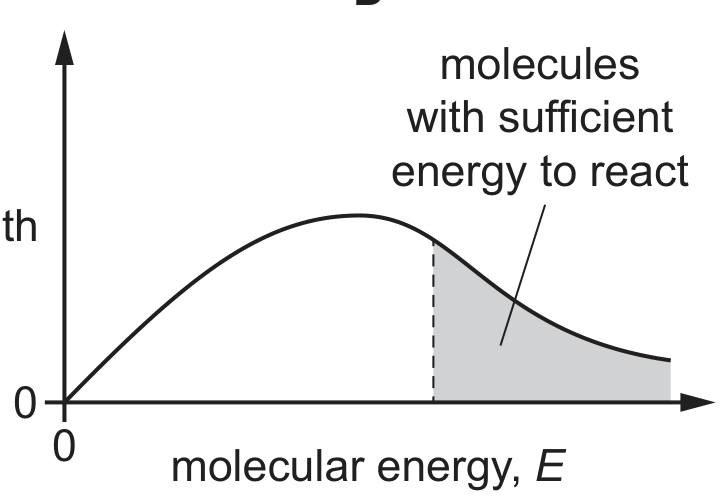
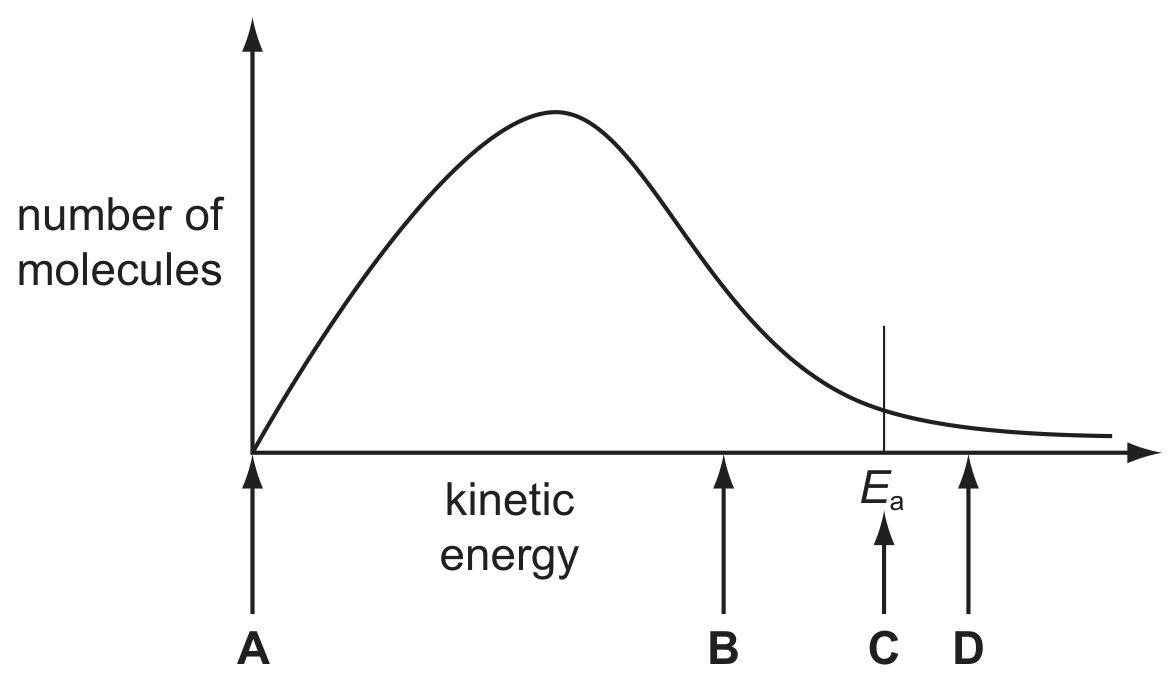
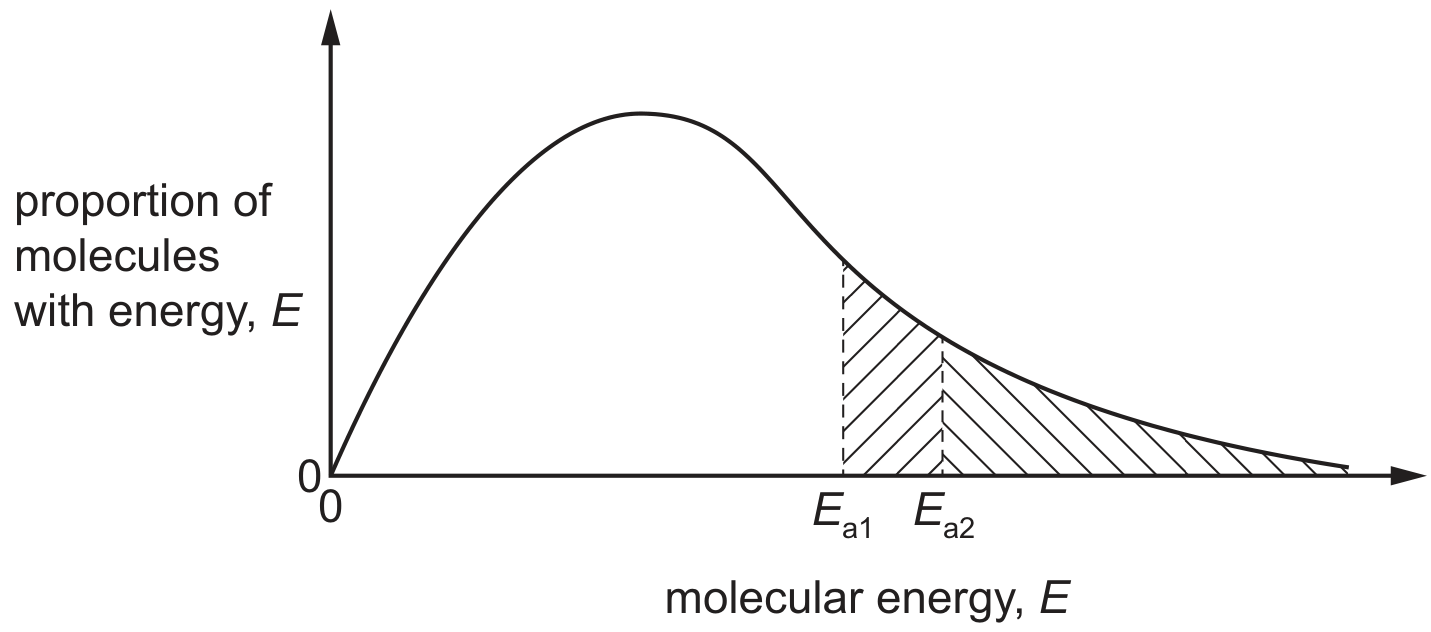
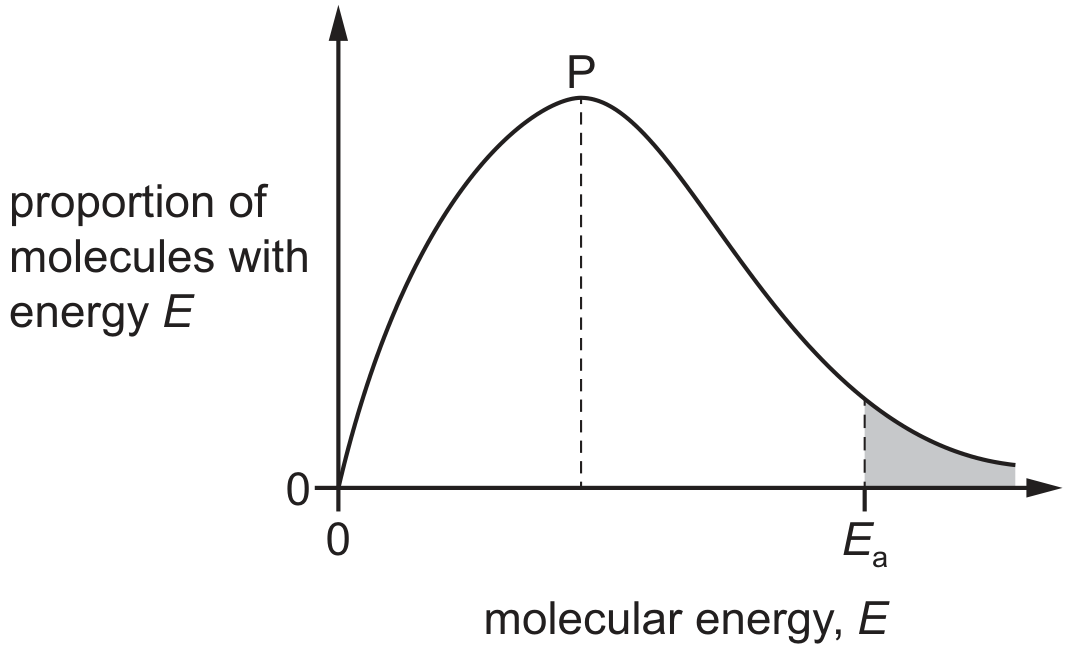
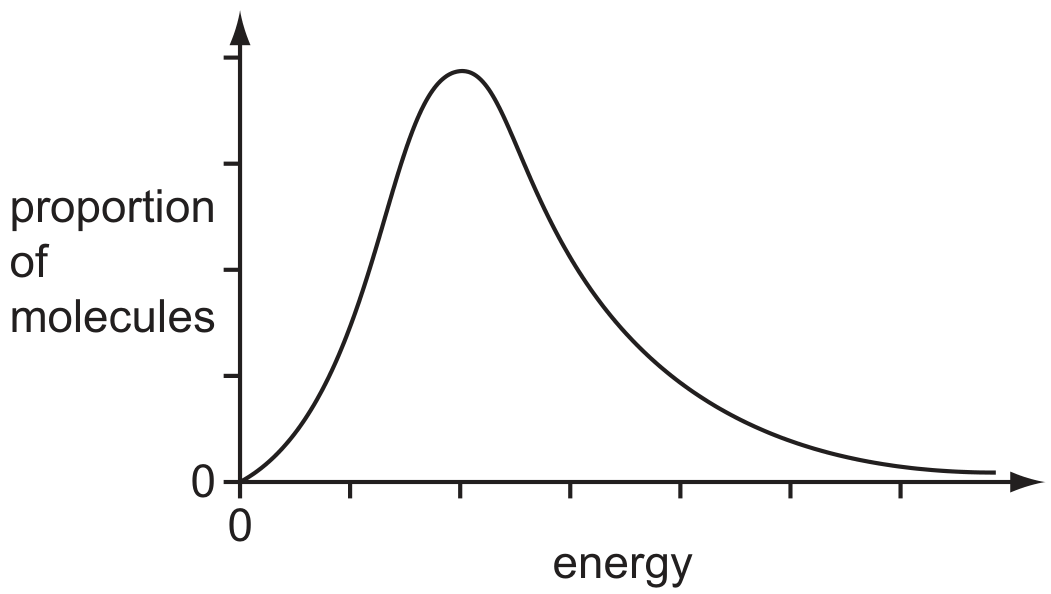
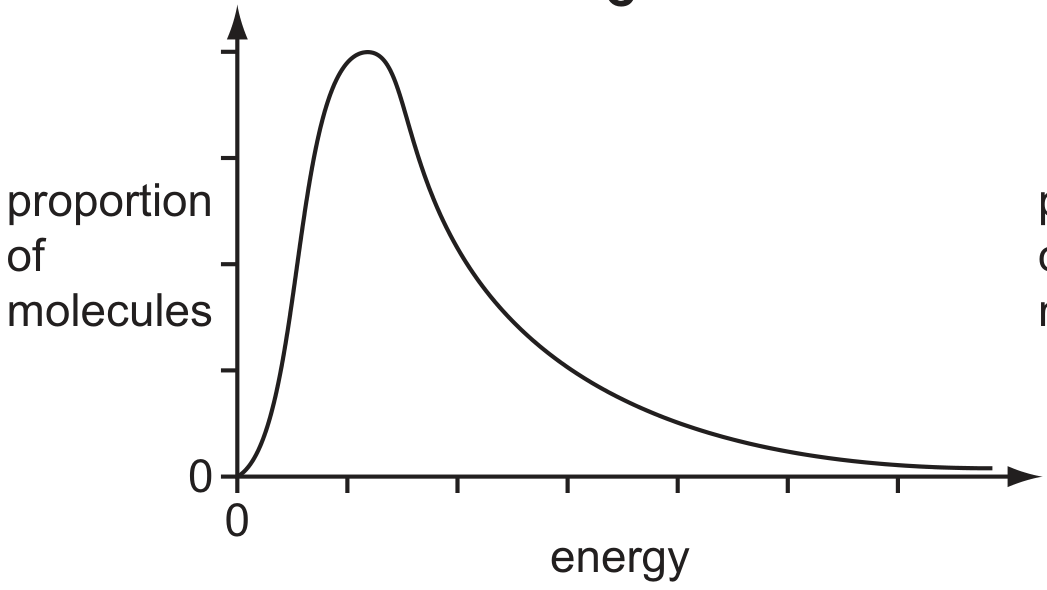
The Boltzmann distribution for a gas at constant temperature is shown below.

Question image

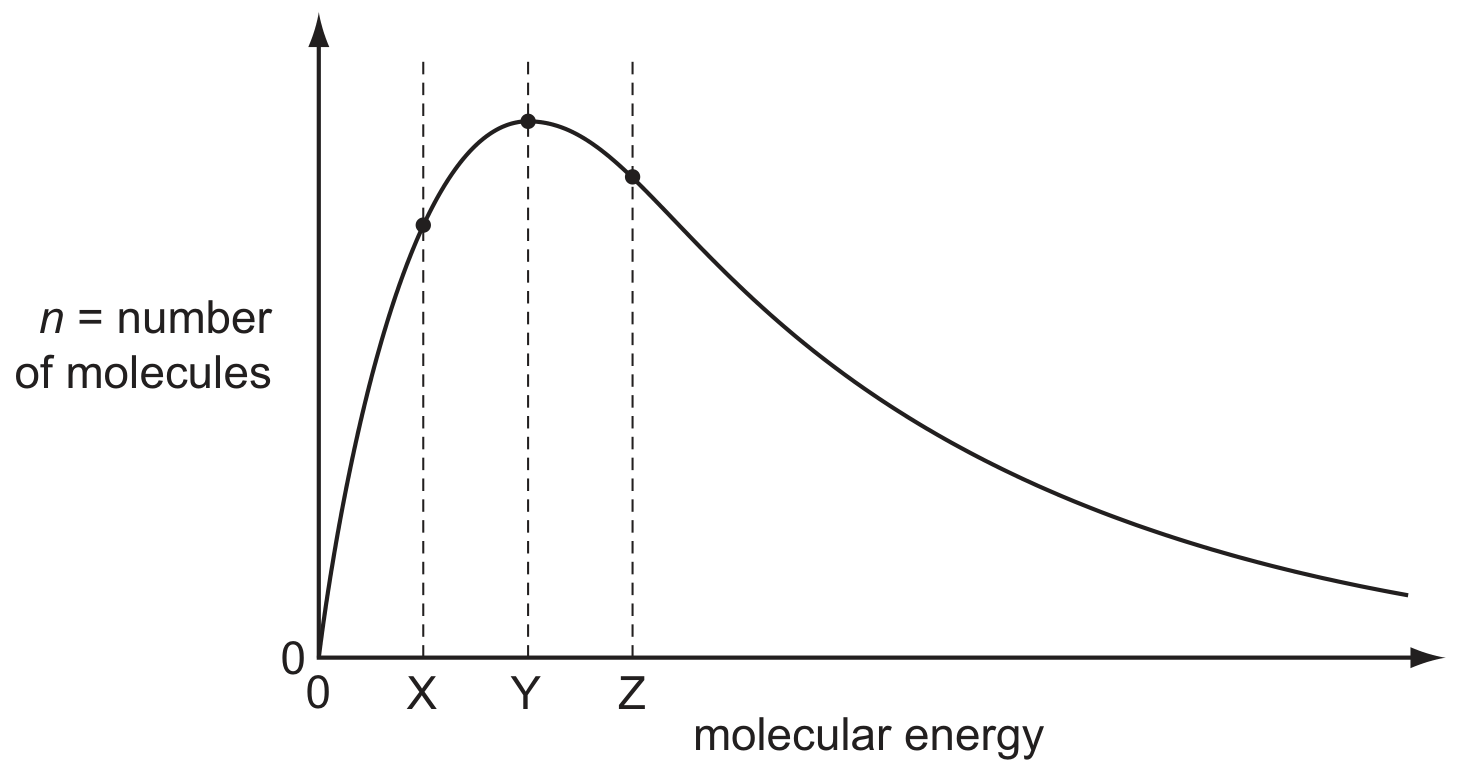
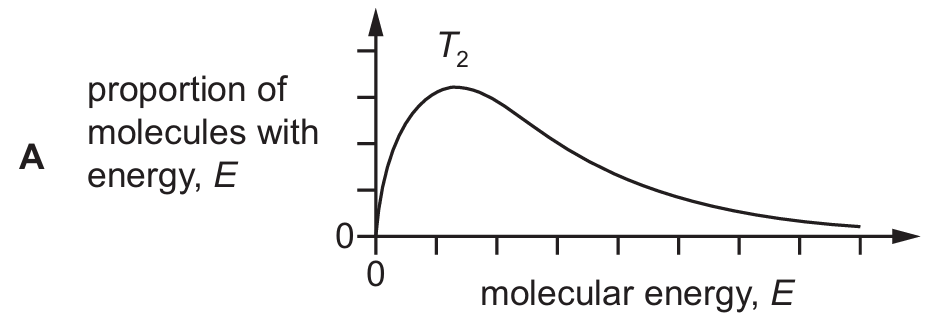
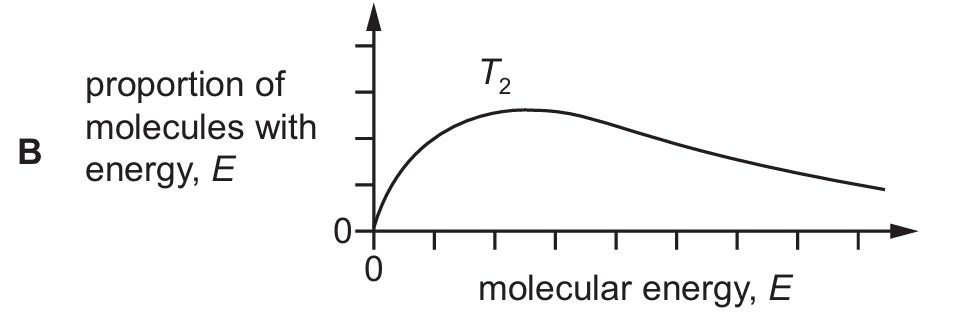
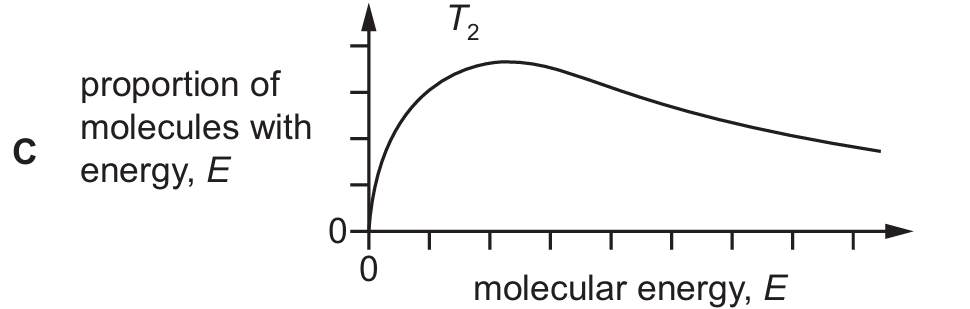
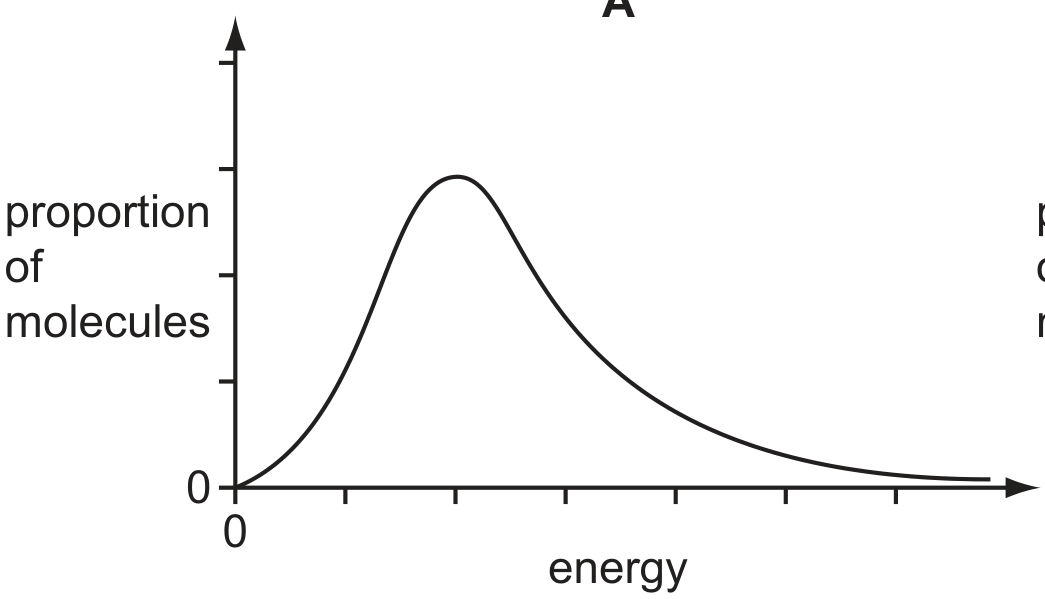
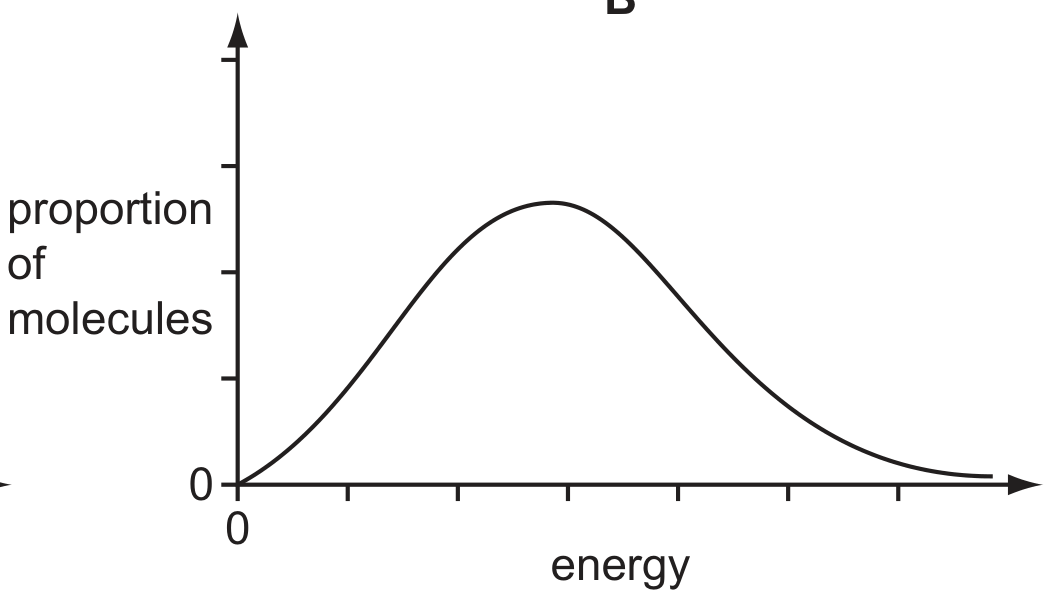
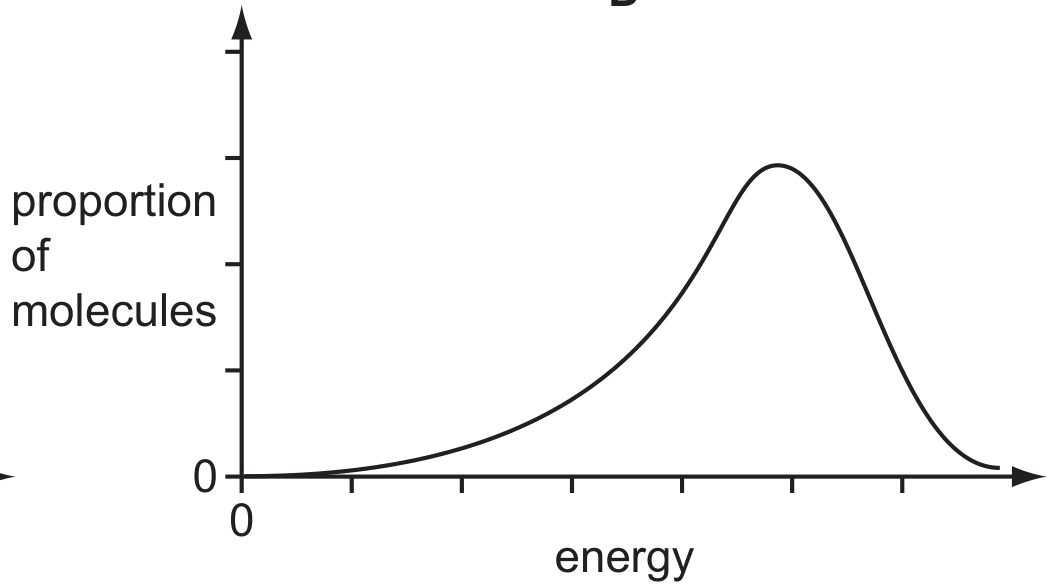
If the temperature of the gas is reduced by 10C10^{\circ} \mathrm{C} the graph changes shape.
What happens to the values of n for the molecular energies X, Y and Z ?

X

Y

Z

higher

lower

higher

higher

lower

lower

lower

higher

lower

lower

lower

lower

[Maximum number: 1]

The diagram represents, for a given temperature, the Boltzmann distribution of the kinetic energies of the molecules in a mixture of two gases that react together. The activation energy for the reaction, EaE_{\mathrm{a}}, is marked.

Question image

The dotted curves below show the Boltzmann distribution for the same reaction at a higher temperature. On these diagrams, H represents the activation energy at the higher temperature.

Which diagram is correct?

D

D

[Maximum number: 1]

The diagram shows the Boltzmann distribution of energies in 1 mole of a gas. The gas can take part in a reaction with an activation energy, EaE_{a}.

Question image

Which statement correctly describes the effect of an increase in temperature?

A

Peak P will be higher and fewer molecules will have energy >Ea>E_{\mathrm{a}}.

B

Peak P will be higher and more molecules will have energy >Ea>E_{\mathrm{a}}.

C

Peak P will be lower and fewer molecules will have energy >Ea>E_{\mathrm{a}}.

D

Peak P will be lower and more molecules will have energy >Ea>E_{\mathrm{a}}.

[Maximum number: 1]

The diagram shows the Boltzmann energy distribution curve for molecules of a mixture of two gases at a given temperature. For a reaction to occur the molecules must collide together with sufficient energy.

Question image

EaE_{\mathrm{a}} is used to represent the activation energy for the reaction between the gases. Of the two values shown, one is the activation energy for a catalysed reaction, the other for an uncatalysed reaction.

Which statement about Ea1E_{a 1} is correct?

A

Ea1E_{a 1} corresponds to a catalysed reaction with fewer effective collisions than the uncatalysed reaction.

B

Ea1E_{a 1} corresponds to an uncatalysed reaction with fewer effective collisions than the catalysed reaction.

C

Ea1E_{a 1} corresponds to a catalysed reaction with a greater number of effective collisions than the uncatalysed reaction.

D

Ea1E_{a 1} corresponds to an uncatalysed reaction with a greater number of effective collisions than the catalysed reaction.

[Maximum number: 1]

The Boltzmann distribution is shown for a sample of gas at an initial temperature, T1T_{1}.

Question image

The sample of gas was heated to temperature, T2T_{2}.
What is the correct distribution for the higher temperature, T2T_{2} ?

A
Question image
B
Question image
C
Question image
D
Question image
[Maximum number: 1]

The Boltzmann distribution of molecular energies in a sample of aqueous hydrogen peroxide at room temperature is shown.

Question image

Which diagram shows the Boltzmann distribution of molecular energies of aqueous hydrogen peroxide maintained at room temperature when a catalyst, manganese(IV) oxide, is added?

A
Question image
B
Question image
C
Question image
D
Question image
[Maximum number: 1]

The diagram below represents, for a given temperature, the Boltzmann distribution of the kinetic energy of the molecules in a mixture of two gases that react slowly together.

The activation energy for the reaction, EaE_{\mathrm{a}}, is marked.
When the reaction is catalysed, the rate of reaction increases a little.
What will be the position of EaE_{\mathrm{a}} for the catalysed reaction?

Question image
[Maximum number: 1]

The diagram shows a Boltzmann distribution of the energies of gaseous molecules and the activation energies, EaE_{\mathrm{a}}, of a reaction with and without a catalyst.

Question image

Which statement about this distribution curve is correct?

A

If the temperature of the gas is increased, the maximum of the curve becomes higher.

B

If the temperature of the gas is increased, the maximum of the curve moves to the left.

C

The fraction of molecules that react in the presence of a catalyst is shown by

D

The fraction of molecules that react in the absence of a catalyst is shown by N

[Maximum number: 1]

The diagram shows the Boltzmann distribution of energies in a gas. The gas undergoes a reaction with an activation energy, EaE_{a}. The peak of the distribution is labelled P.

Question image

If the same reaction is carried out in the presence of a catalyst, which statement is correct?

A

The peak P is at a lower height and the position of EaE_{\mathrm{a}} moves to the left.

B

The peak P is at a lower height and the position of EaE_{\mathrm{a}} moves to the right.

C

The peak P remains at the same height and the position of EaE_{\mathrm{a}} moves to the left.

D

The peak P remains at the same height and the position of EaE_{\mathrm{a}} moves to the right.

[Maximum number: 1]

The molecular energy distribution curve represents the variation in energy of the molecules of a gas at room temperature.

Question image

Which curve applies for the same gas at a lower temperature?

A
Question image
B
Question image
C
Question image
D
Question image
0