[Maximum number: 3]
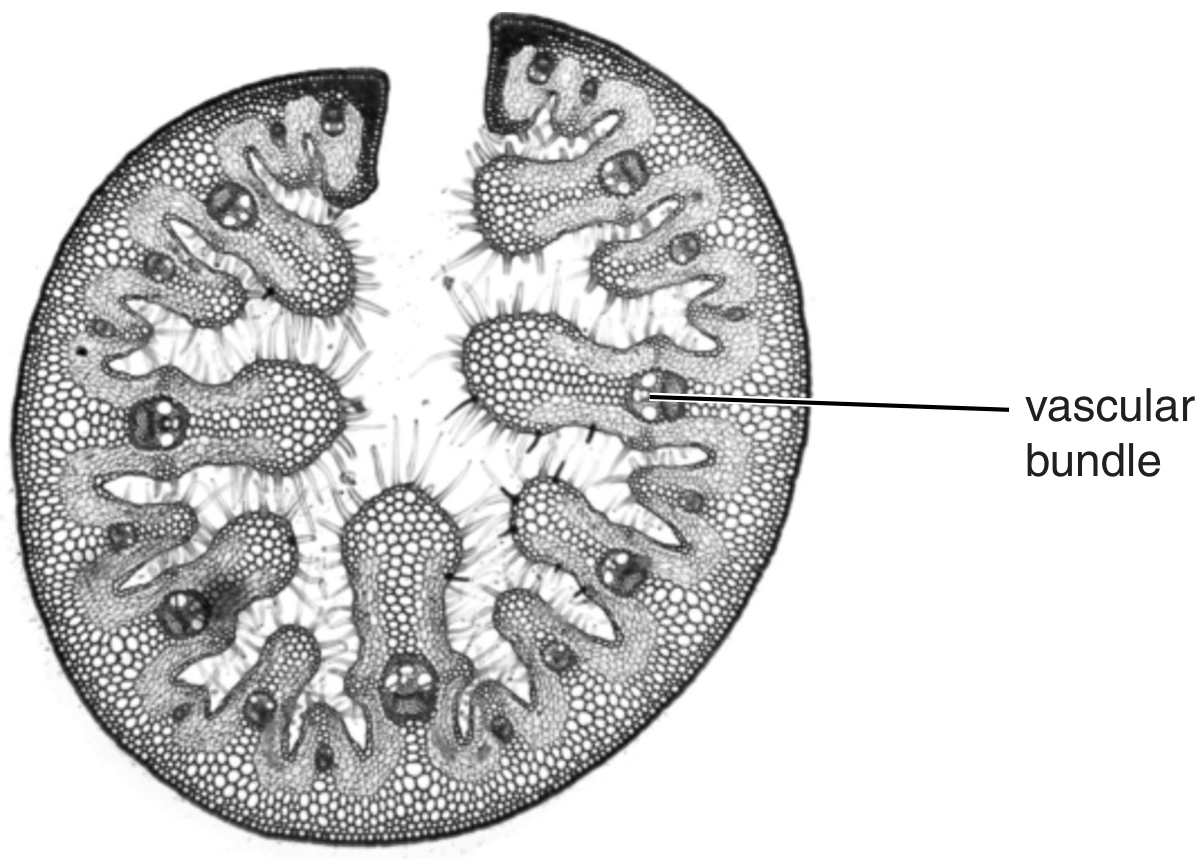
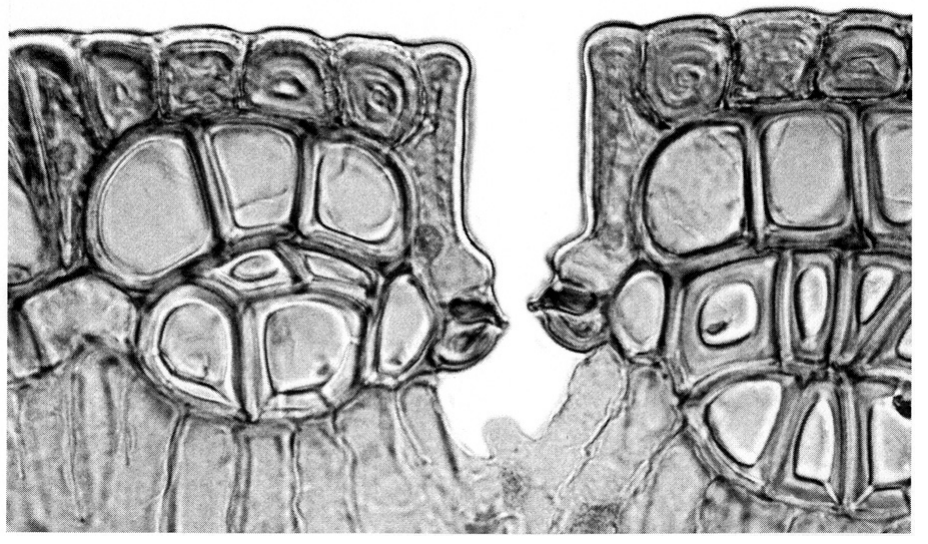
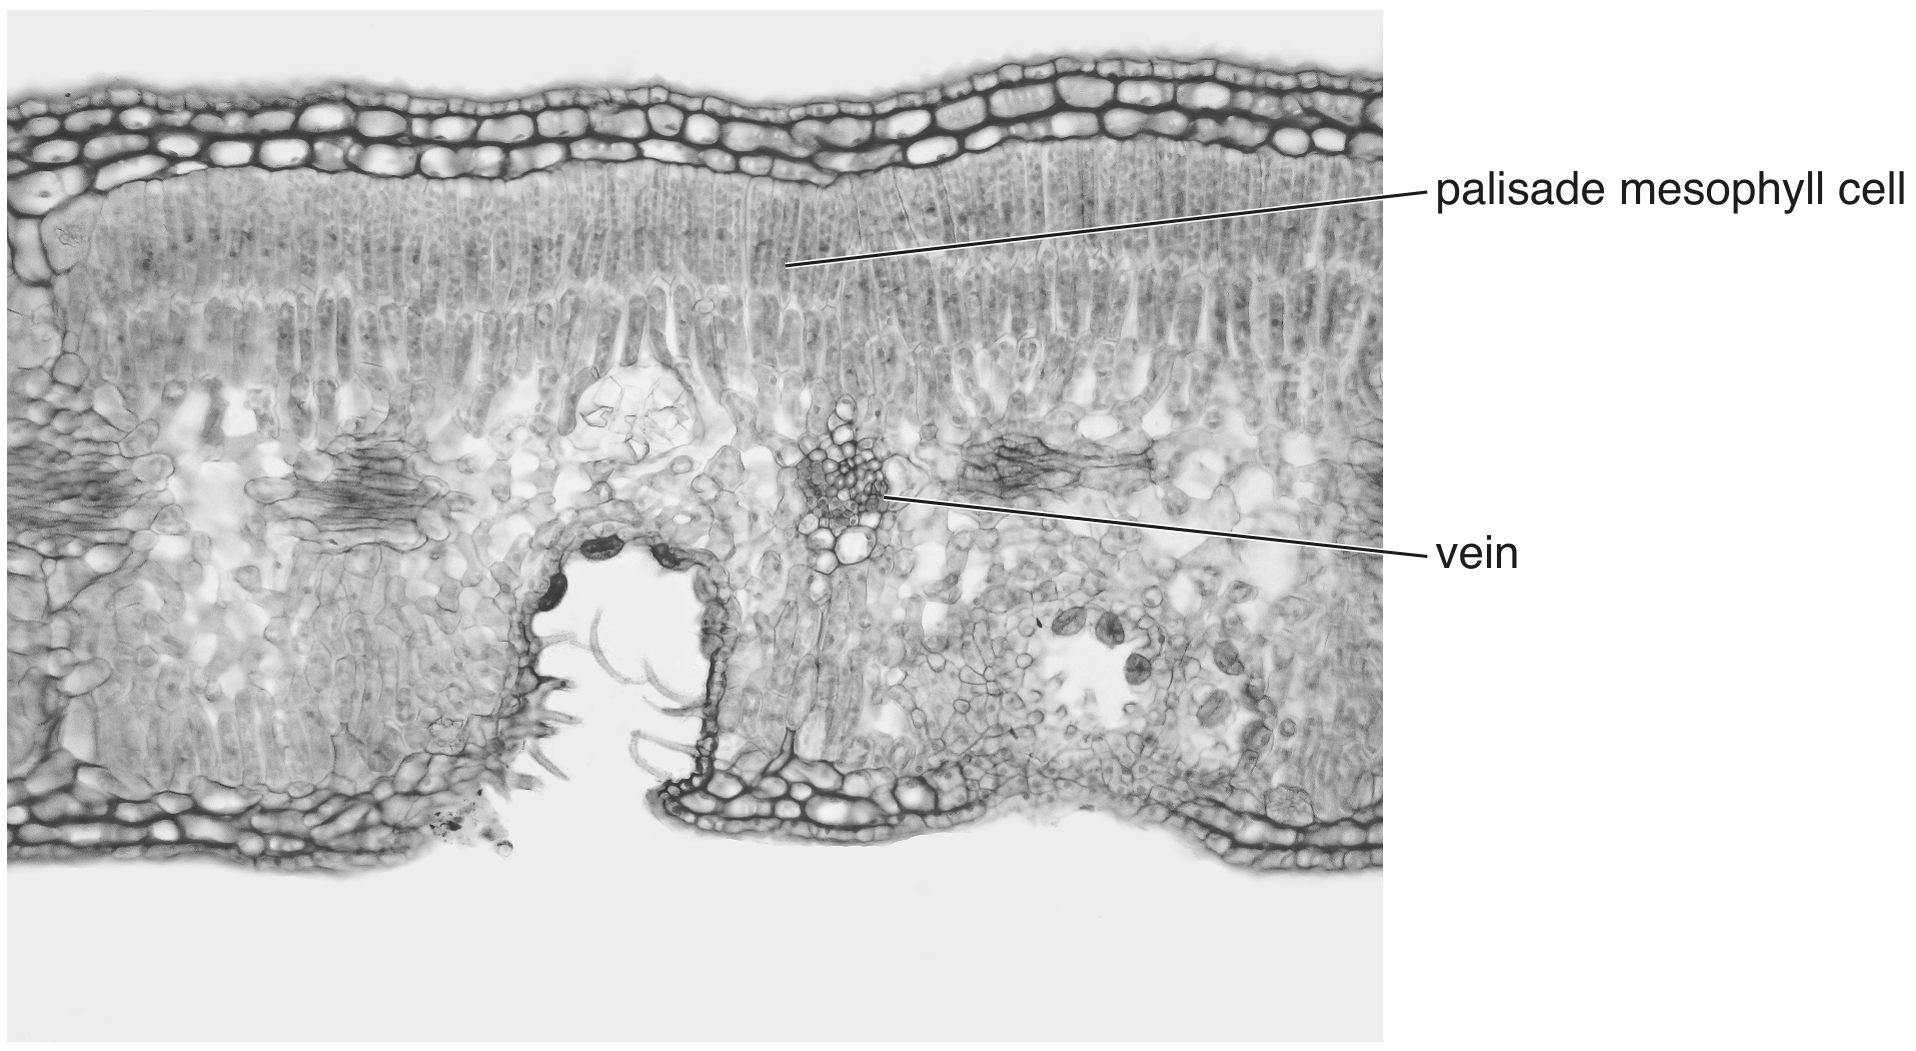
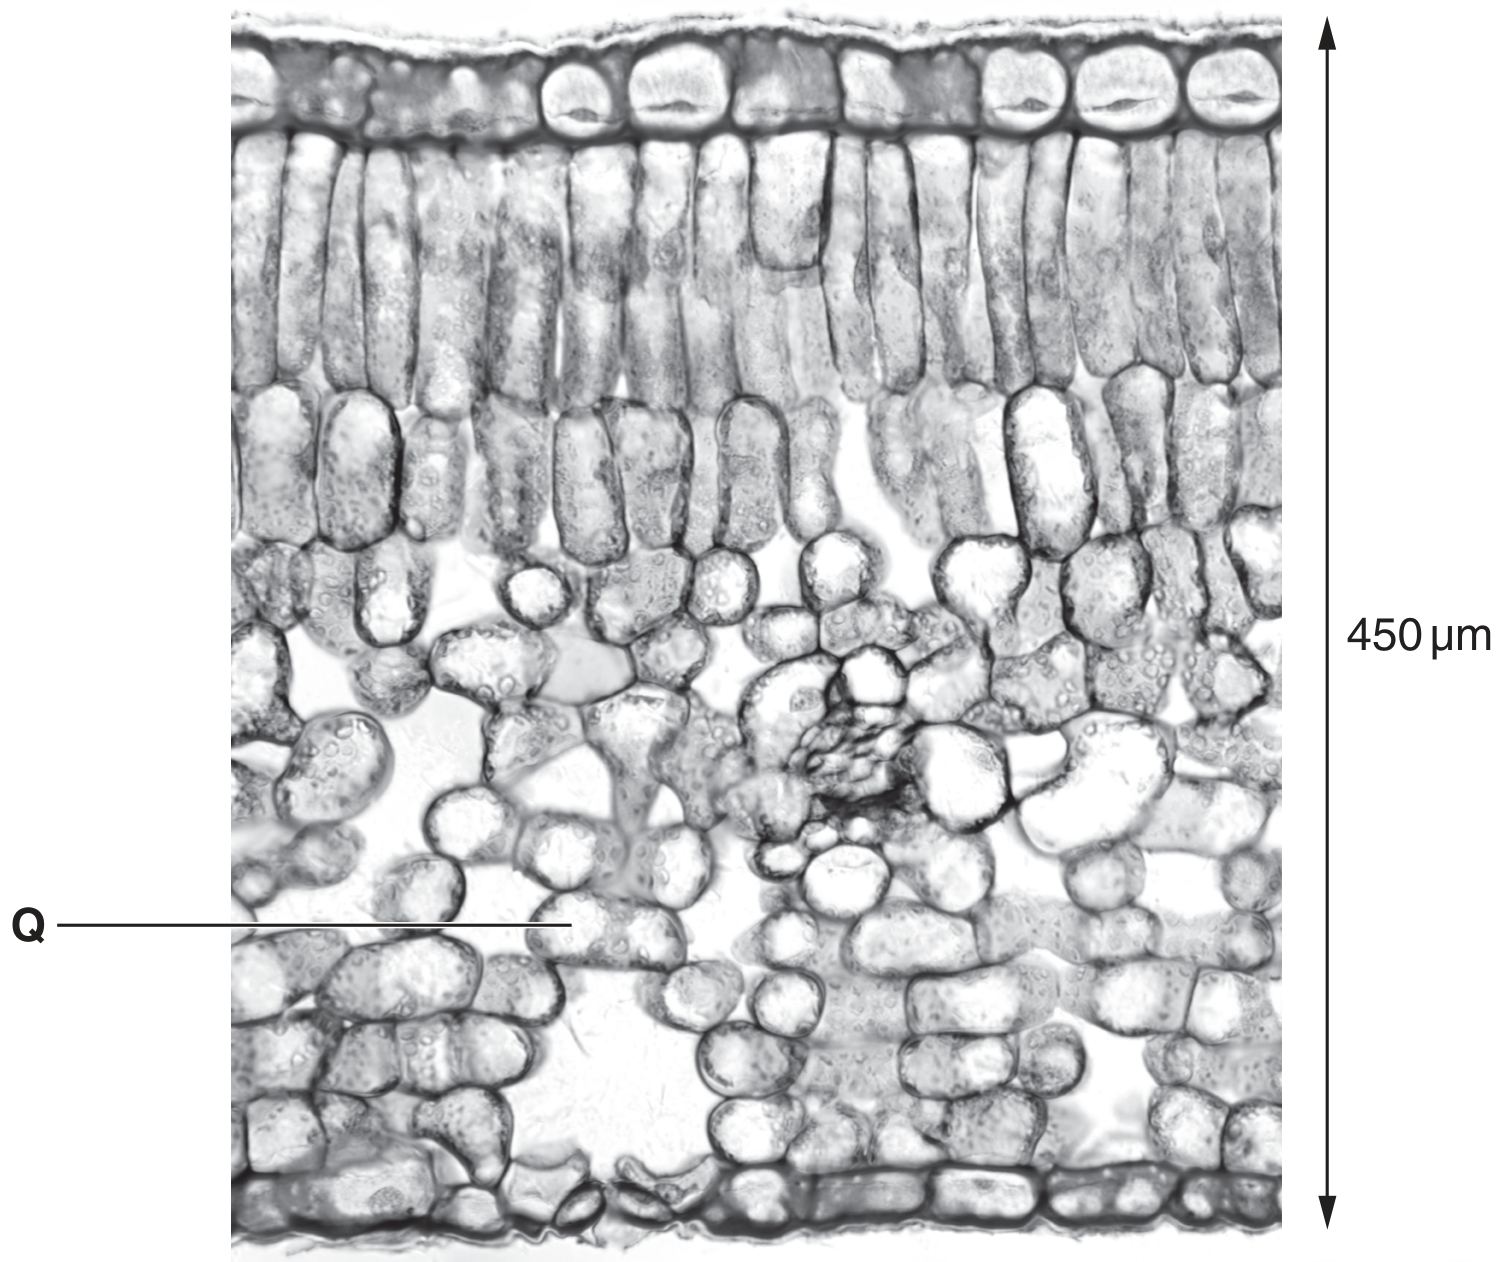
Fig. 1.1 and Fig. 1.2 are photomicrographs of sections through the leaves of two different plants.
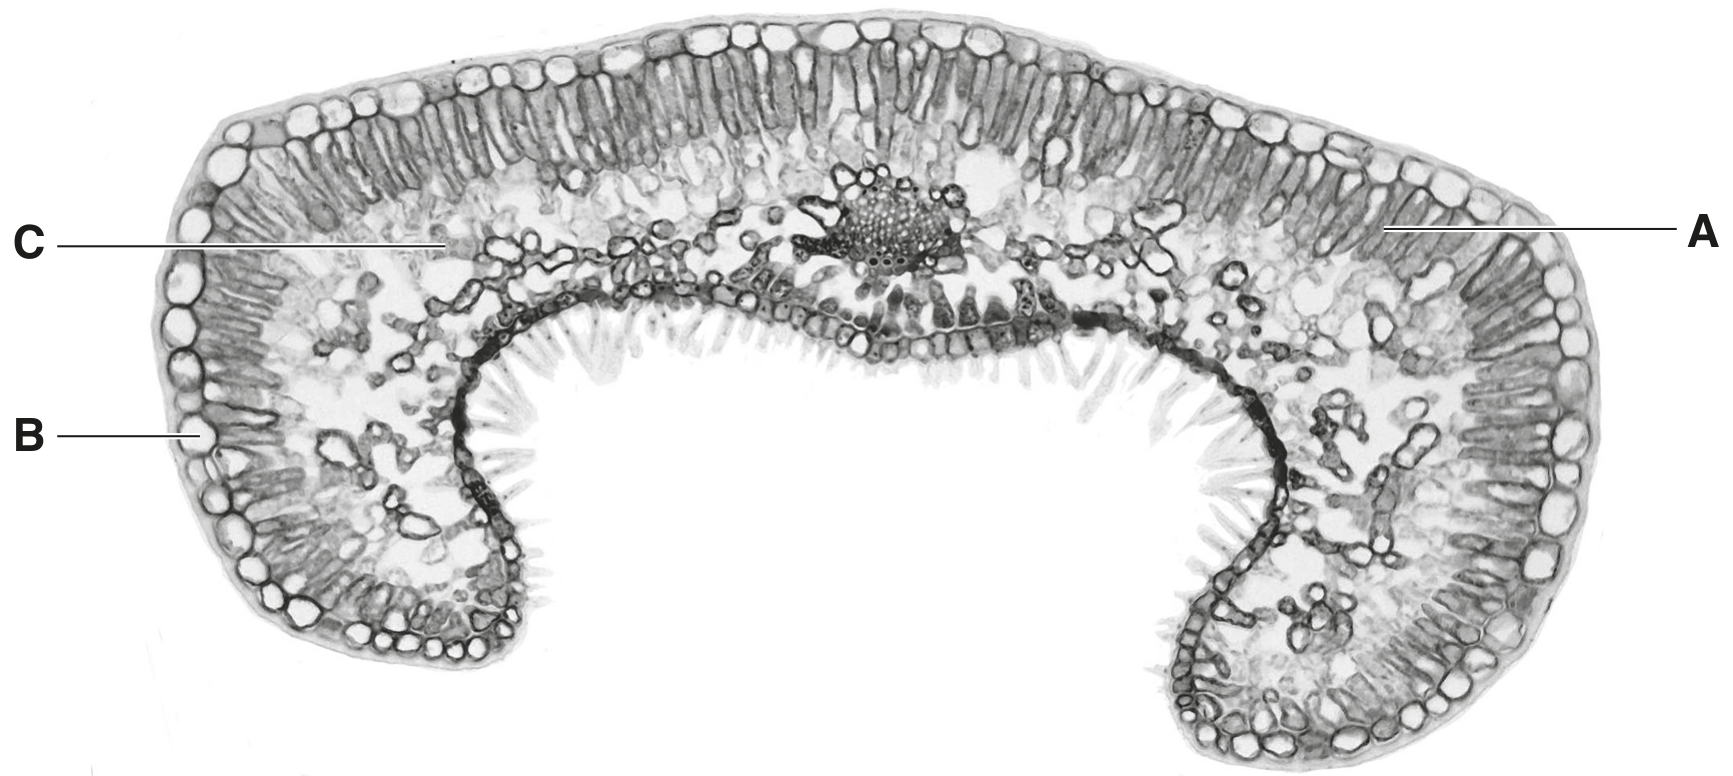
Fig. 1.1 Fig. 1.2 is a photomicrograph of a section through a leaf of Himalayan cedar, Cedrus deodara.
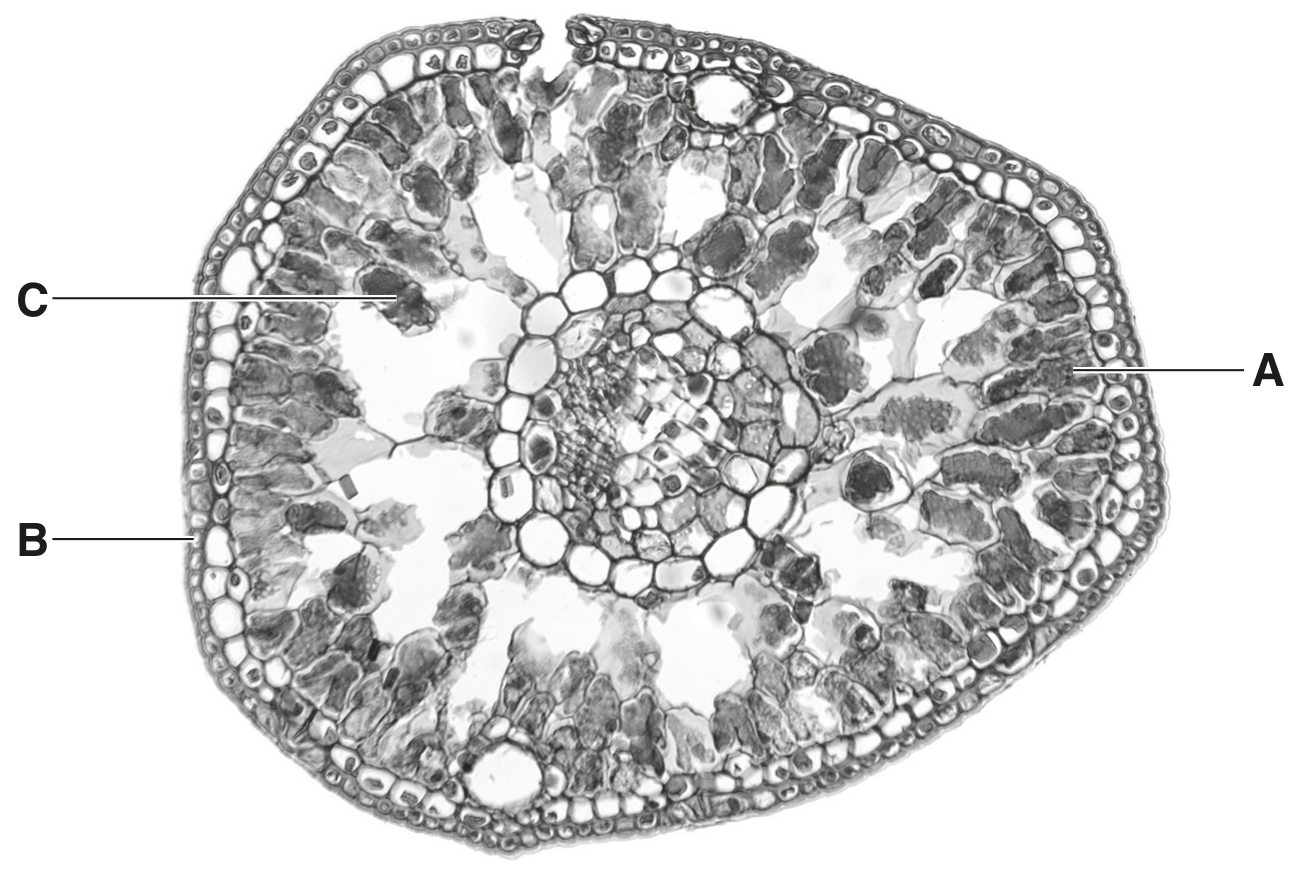
Fig. 1.2 Fig. 1.1 and Fig. 1.2 are not shown at the same magnification.
(a)
Erica vagans and Cedrus deodara are xerophytic plants.
With reference only to xerophytic features, describe the differences between the leaves of E. vagans and C. deodara visible in Fig. 1.1 and Fig. 1.2.
[ 3 ]