[Maximum number: 1]
The diagram represents the movement of water through a plant.
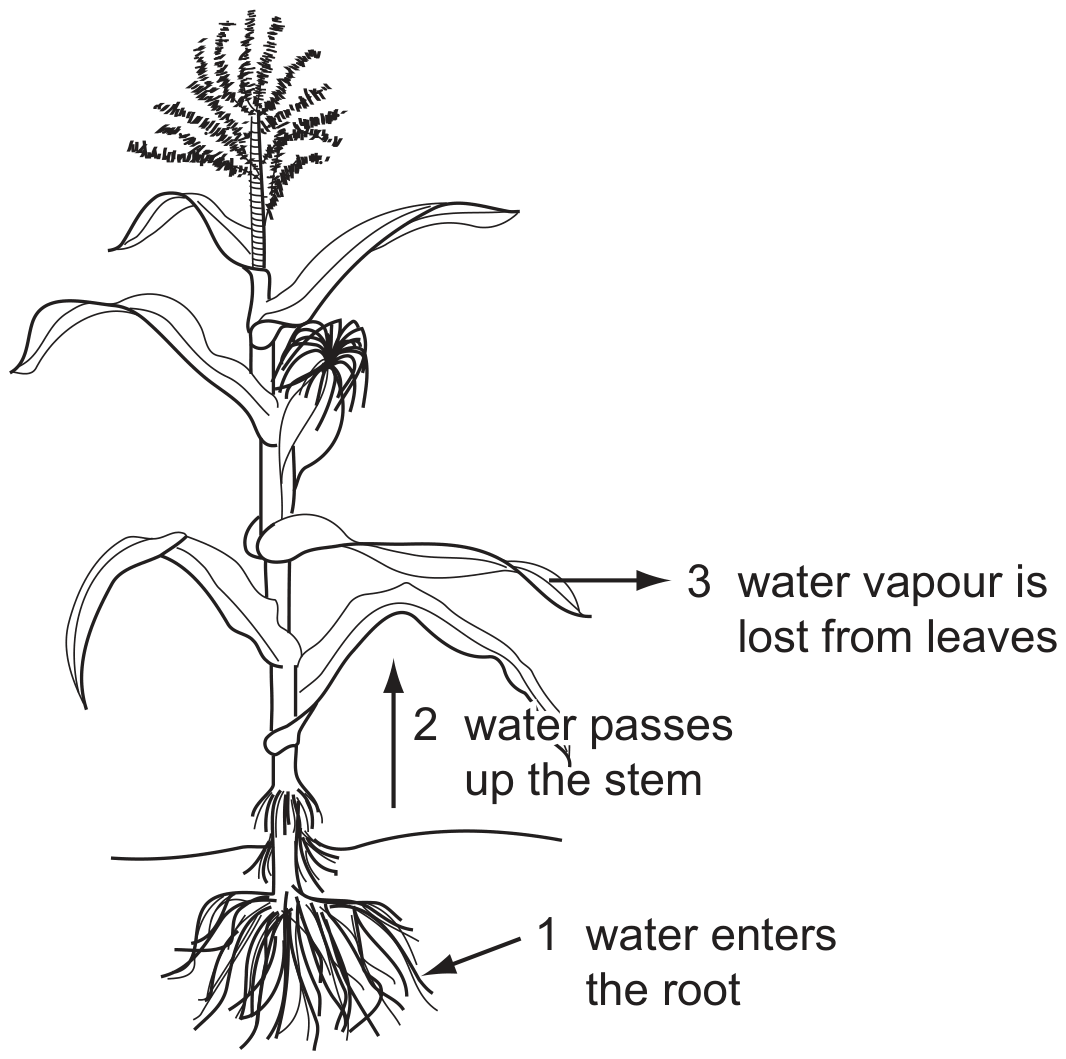
Which row identifies the processes involved during the stages of water movement shown?
cohesion and
adhesion
transpiration
osmosis
1
2
3
1
3
2
2
1
3
2
3
1
 EduNinja
The diagram represents the movement of water through a plant.
Which row identifies the processes involved during the stages of water movement shown?
cohesion and
adhesion
transpiration
osmosis
1
2
3
1
3
2
2
1
3
2
3
1
Fig. 1.1 is a simplified diagram representing a transverse section of part of a young root. The diagram is not to scale.
On Fig. 1.1 draw a label line and label with the letter C to identify the Casparian strip.
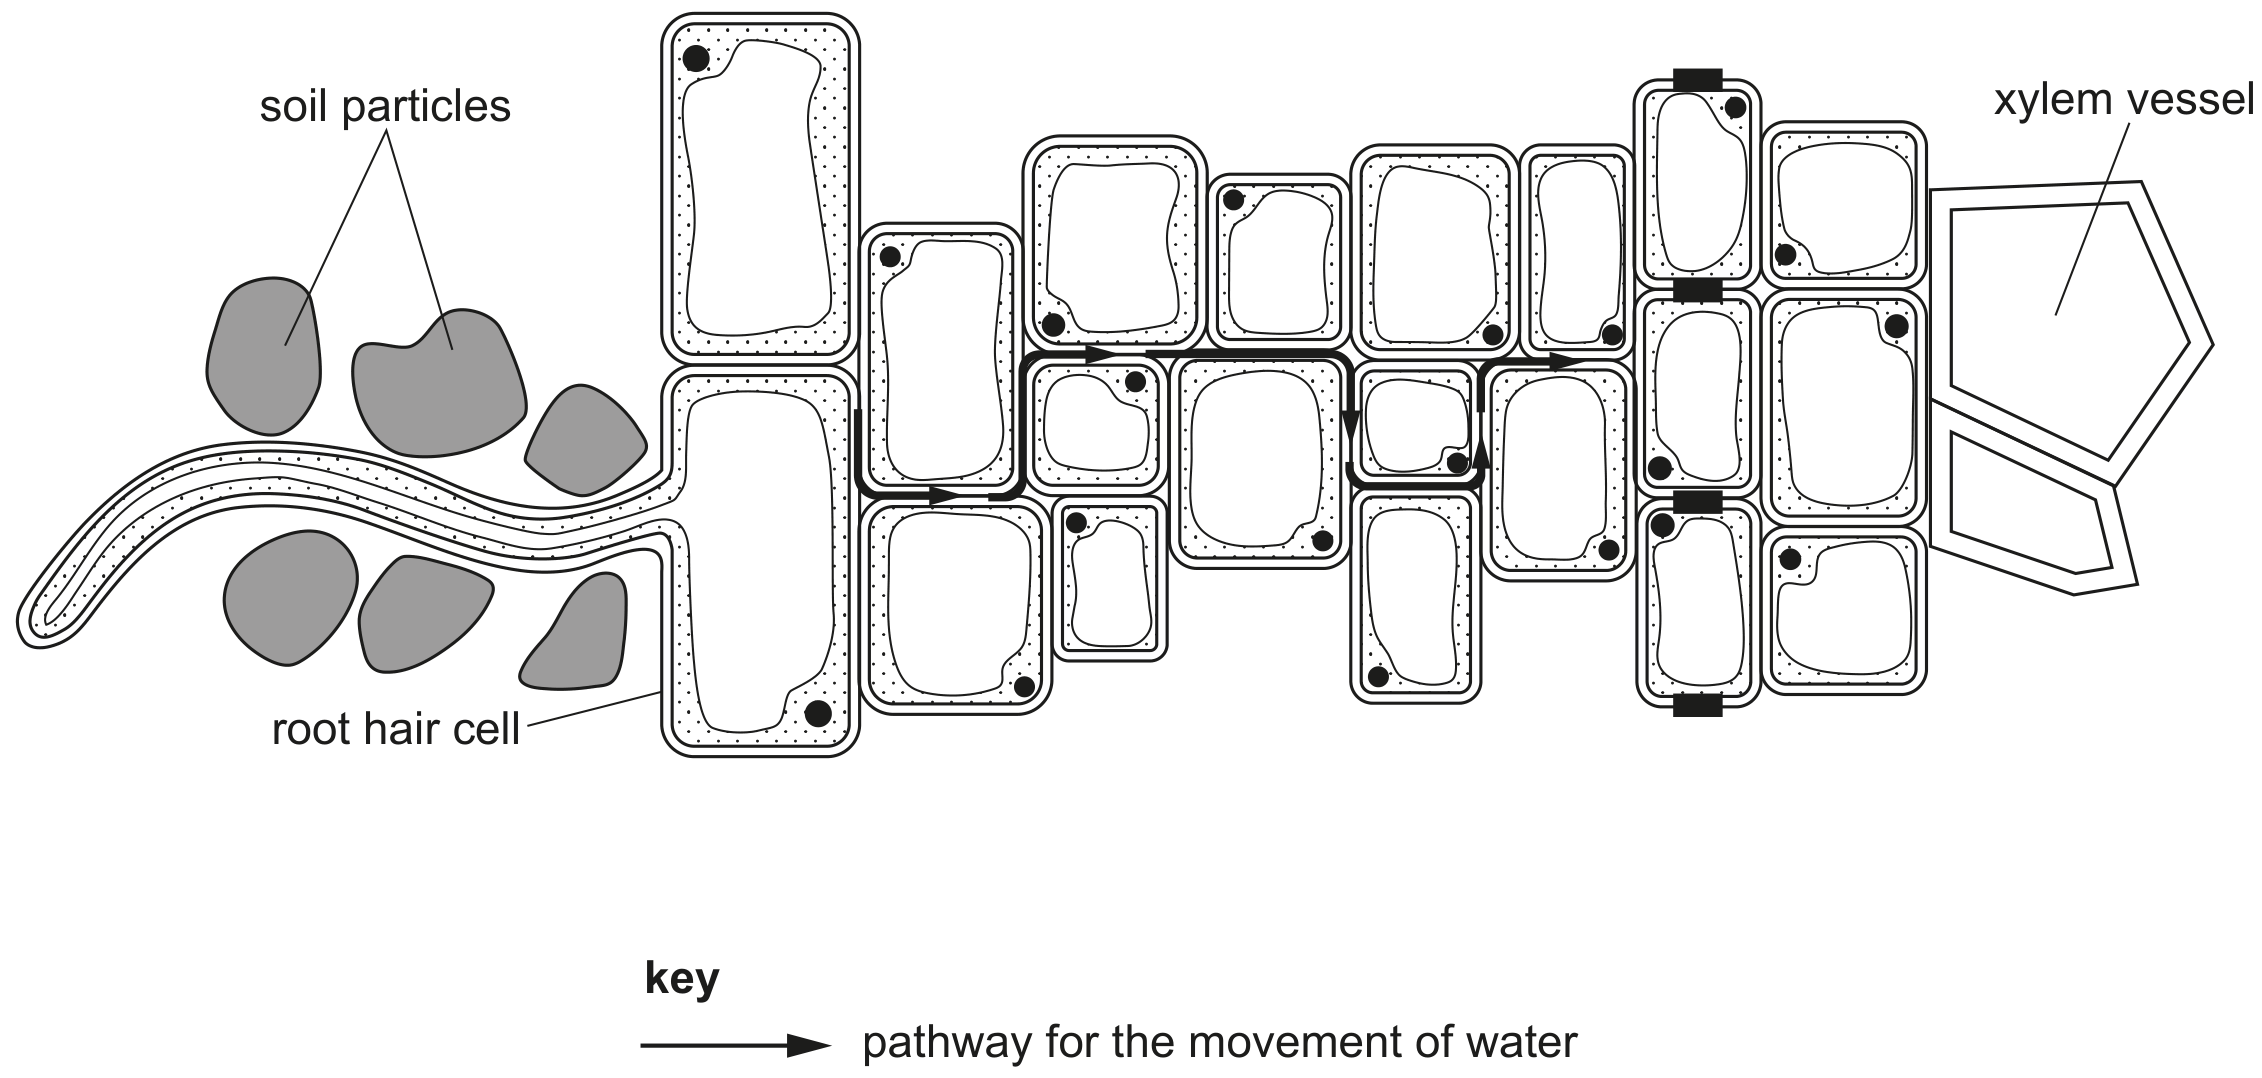
Fig. 1.1
Root hairs measure approximately in diameter and in length.
Explain how this adapts root hairs for the absorption of water.
Name the pathway for the movement of water shown by the arrows in Fig. 1.1.
Water enters the xylem vessels shown in Fig. 1.1.
Explain how water moves up the xylem vessels to the leaves in a continuous column.
Fig. 1.1 is a diagram drawn from a photomicrograph of a transverse section through part of a leaf.
The arrows in Fig. 1.1 show the movement of water through the cells of the leaf after it has left the xylem.
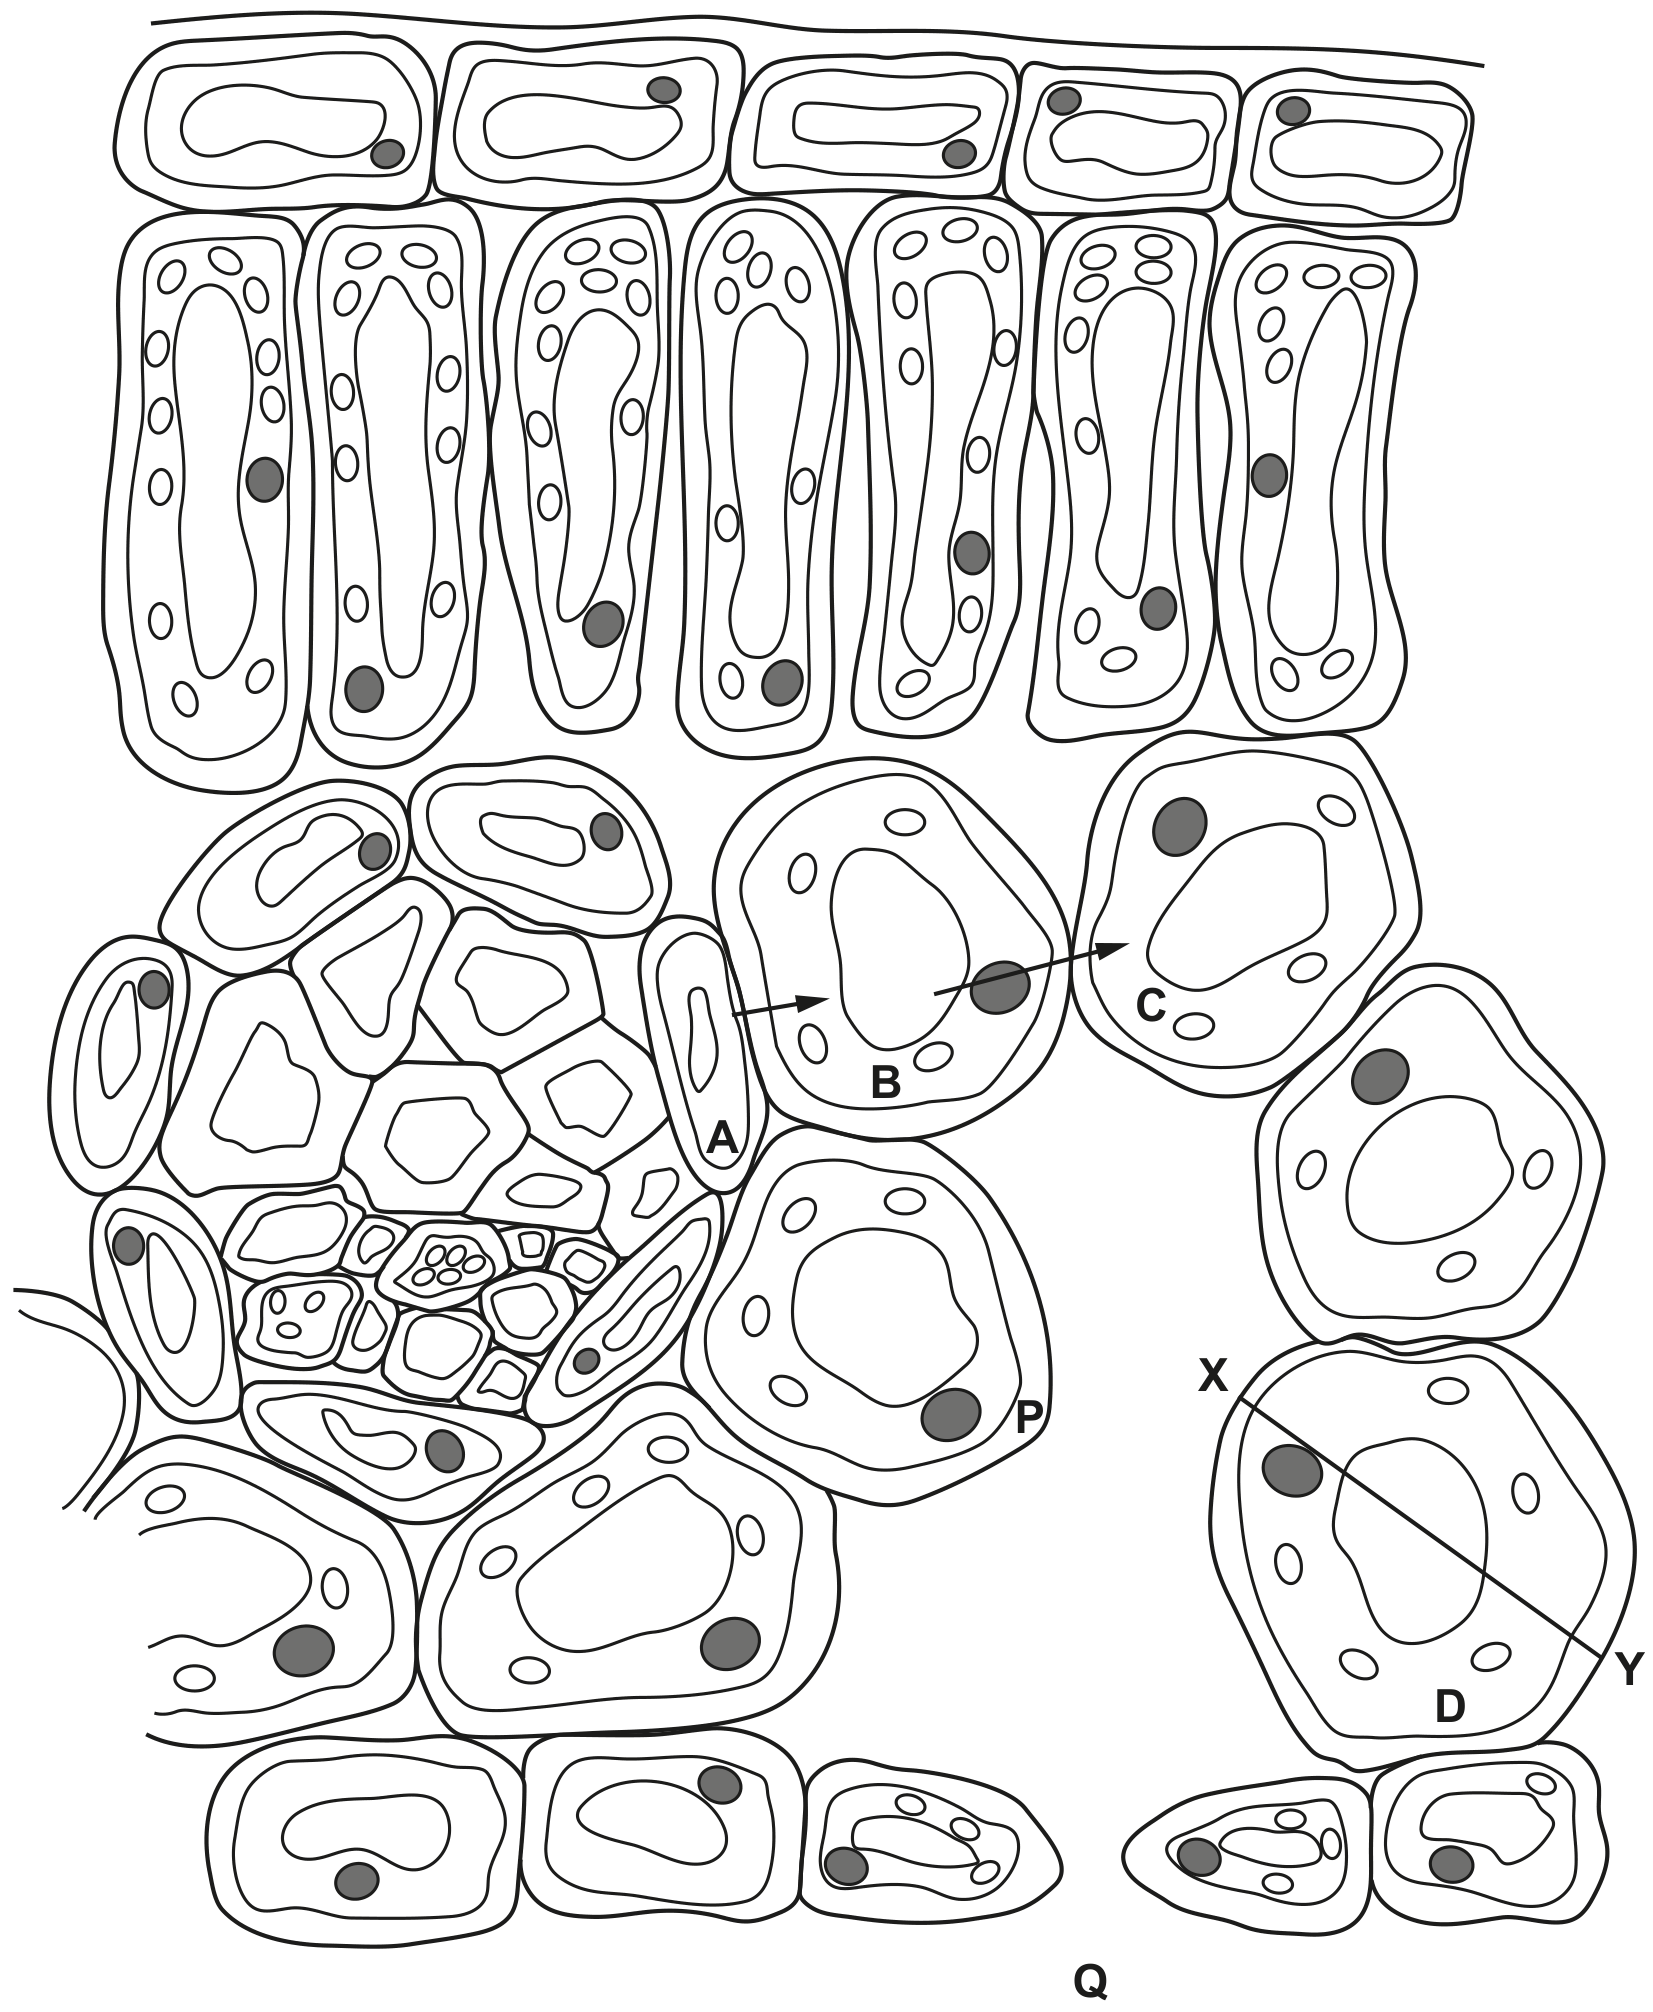
Fig. 1.1
Water from the xylem can enter cell A and then moves to cells B and C without crossing their cell walls.
The cell structures through which water passes from cell A to cell B are not visible in Fig. 1.1.
Name the cell structures through which water passes from cell A to cell B without crossing their cell walls.
Explain what causes water to move from cell B to cell C.
Name the pathway taken by water between cell A and cell C.
Most of the water that arrives at the leaf passes to the external atmosphere.
With reference to Fig. 1.1, describe and explain the sequence of events occurring between point P and point Q.
Water and mineral ions are transported up the stem of a plant to the leaves within xylem vessels.
Some water and mineral ions can pass out of xylem vessel elements to supply parenchyma tissue in the stem.
Explain how hydrogen bonding between water molecules contributes to the movement of water within xylem vessels up the stem to the leaves.
Fig. 1.2 is a diagram of a photomicrograph showing three adjacent parenchyma cells in the stem. These parenchyma cells can be described as typical plant cells.
The arrows show the direction of movement of water between the cells.
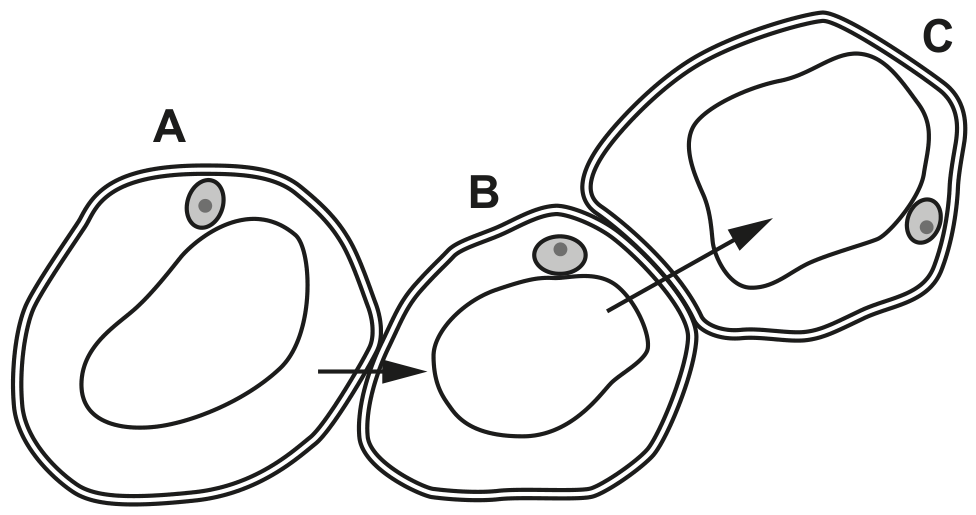
Fig. 1.2
Describe and explain the movement of water shown in Fig. 1.2.
Phloem sap is transported from sources to sinks in phloem sieve tubes. Each sieve tube is constructed from phloem sieve tube elements.
The structure of a phloem sieve tube element is adapted to its function.
Each of explanations A to F describes how a particular structural feature of a phloem sieve tube element in a source is suited to the function of transporting phloem sap.
The matching structural feature for each explanation is listed in Table 1.1.
for entry of sucrose and other organic compounds
for rapid entry of water to create high hydrostatic pressure
provides pores to allow the flow of phloem sap from one sieve tube element to the next
to form very long tubular structures for the transport of phloem sap from source to sink E decreases resistance to the flow of phloem sap within each sieve tube element, so the speed of flow is maintained F provides more space to increase the volume of phloem sap transported per unit time Complete Table 1.1 by writing the correct letter from A to F in the last column of each row, so that each structural feature is matched to the correct explanation. Use each letter only once. The first row has been completed for you.
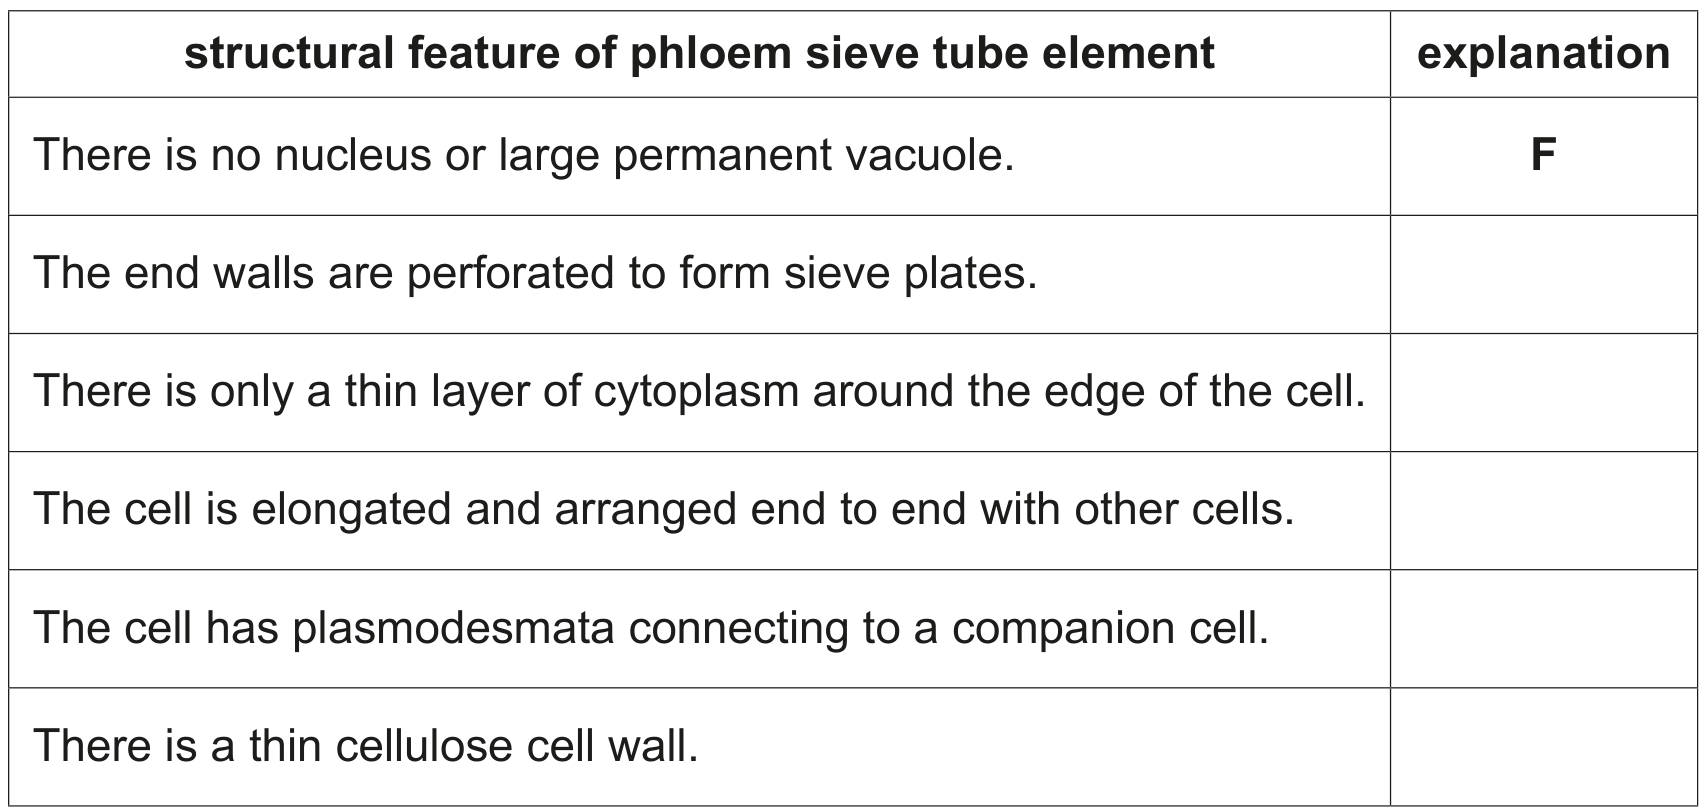
Table 1.1
At the sink, sucrose and other organic compounds are unloaded from the phloem sieve tube element.
Explain why the process of unloading helps the mass flow of phloem sap from the source to the sink.
Fig. 1.1 is a photomicrograph of a transverse section through the stem of creeping buttercup, Ranunculus repens.
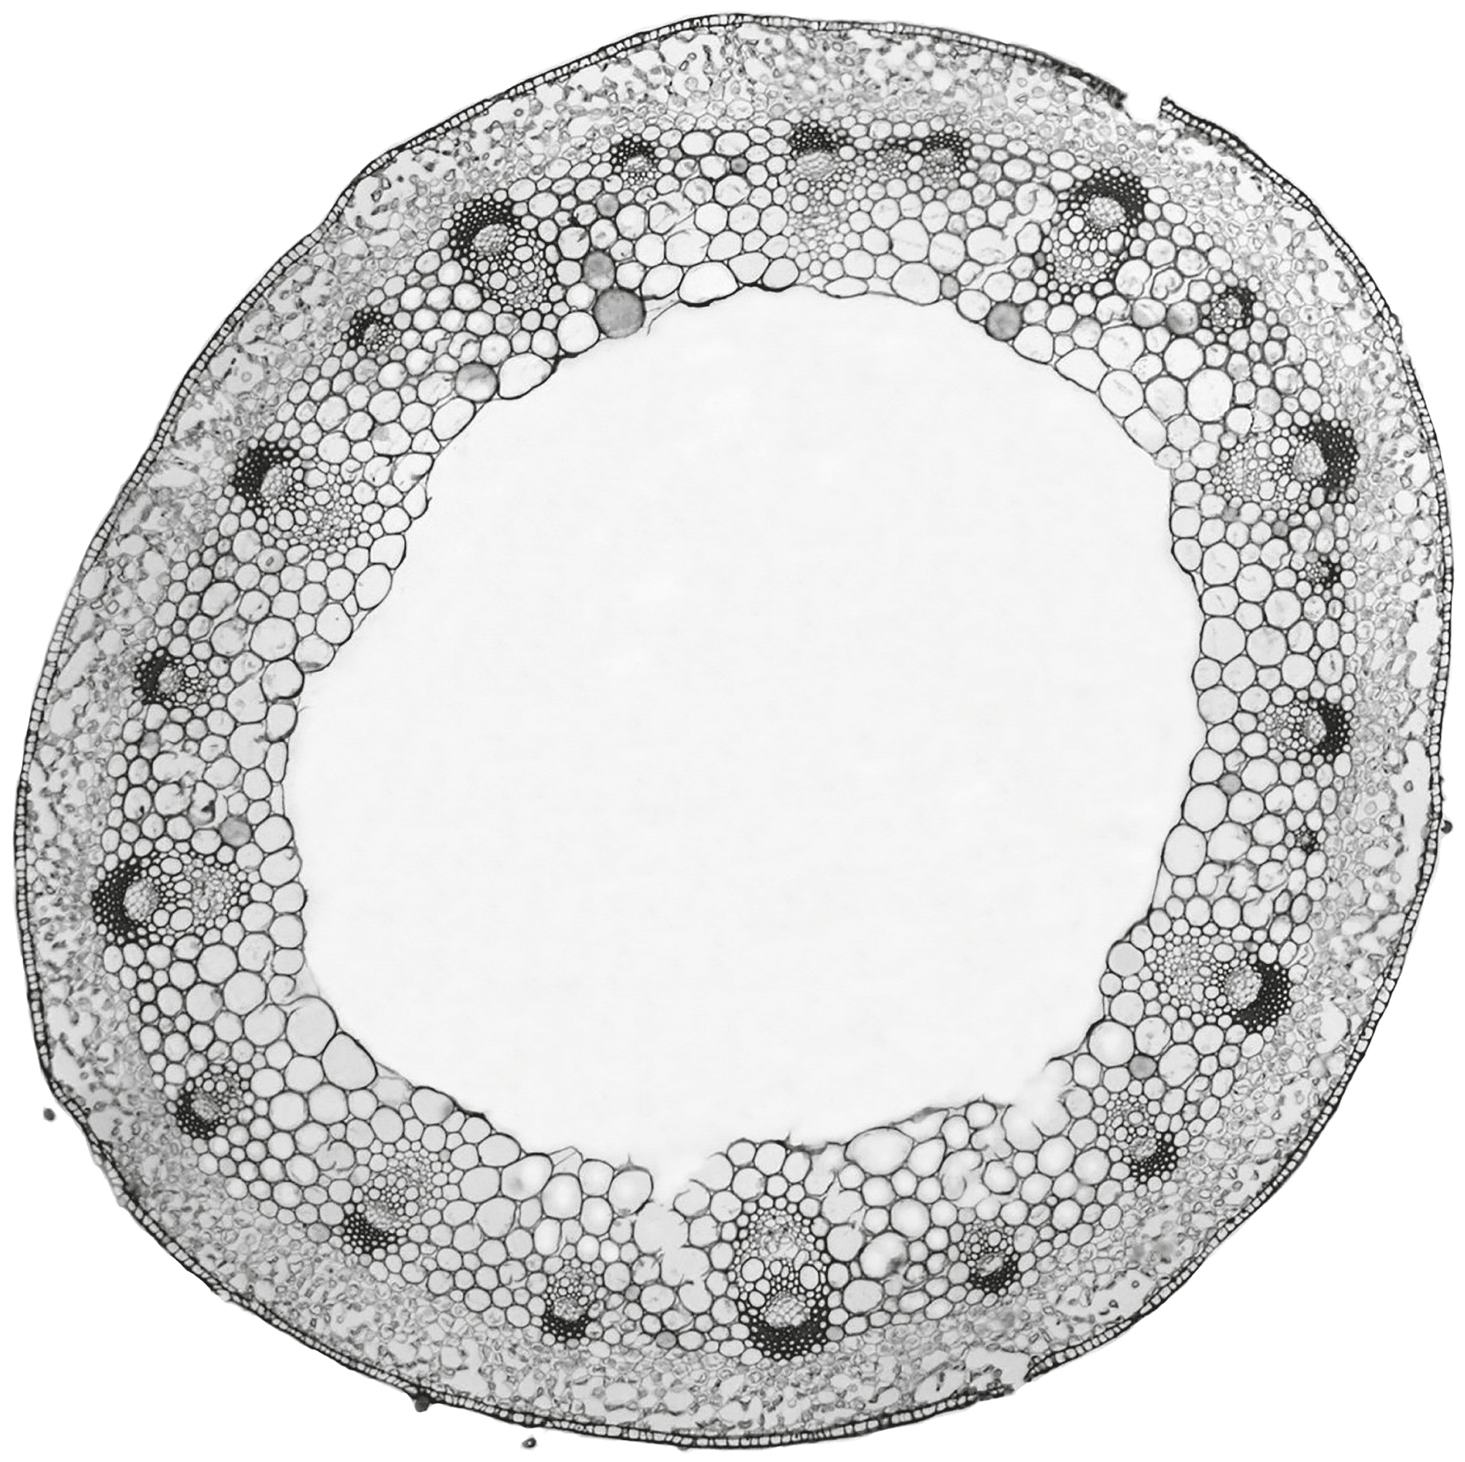
Fig. 1.1
State the role of phloem sieve tubes.
Fig. 1.1 and Fig. 1.2 are photomicrographs of sections through the leaves of two different plants.
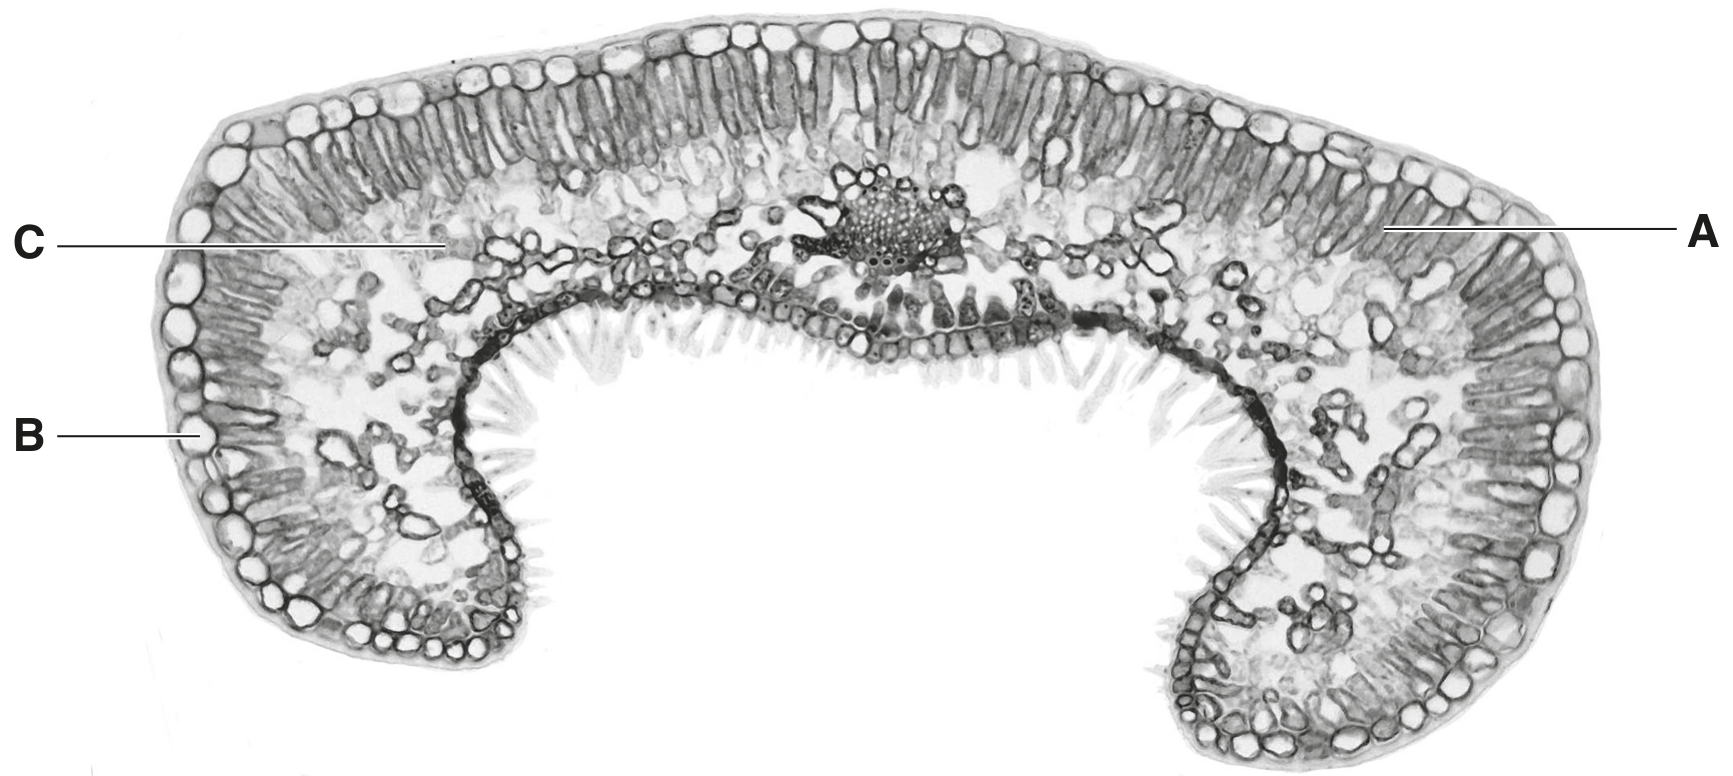
Fig. 1.1 Fig. 1.2 is a photomicrograph of a section through a leaf of Himalayan cedar, Cedrus deodara.
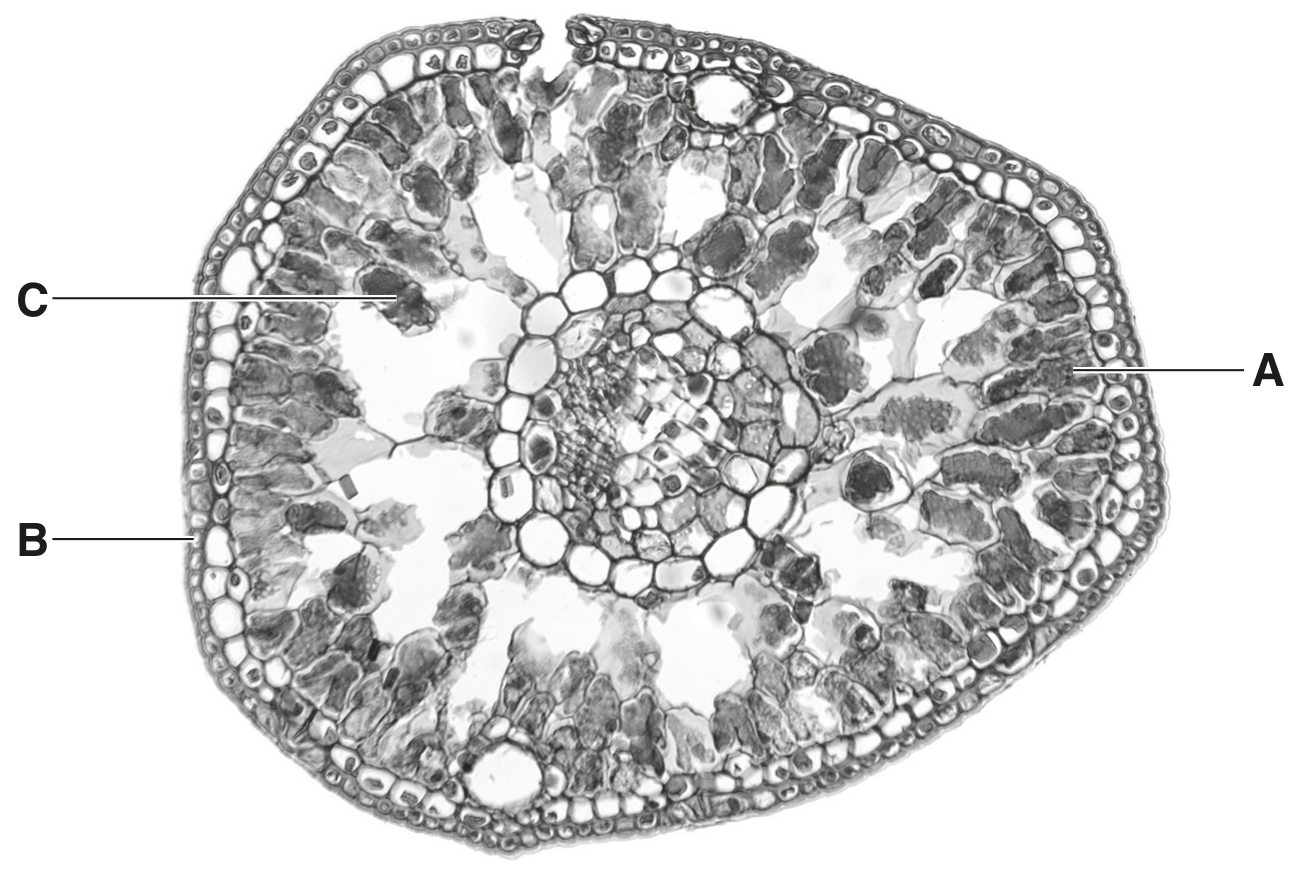
Fig. 1.2 Fig. 1.1 and Fig. 1.2 are not shown at the same magnification.
Erica vagans and Cedrus deodara are xerophytic plants.
With reference only to xerophytic features, describe the differences between the leaves of E. vagans and C. deodara visible in Fig. 1.1 and Fig. 1.2.
Transpiration is a consequence of gas exchange in leaves.
Explain why the rate of transpiration is greater during the day than during the night.
Fig. 1.1 is a drawing of a photomicrograph of a spongy mesophyll cell from a leaf.
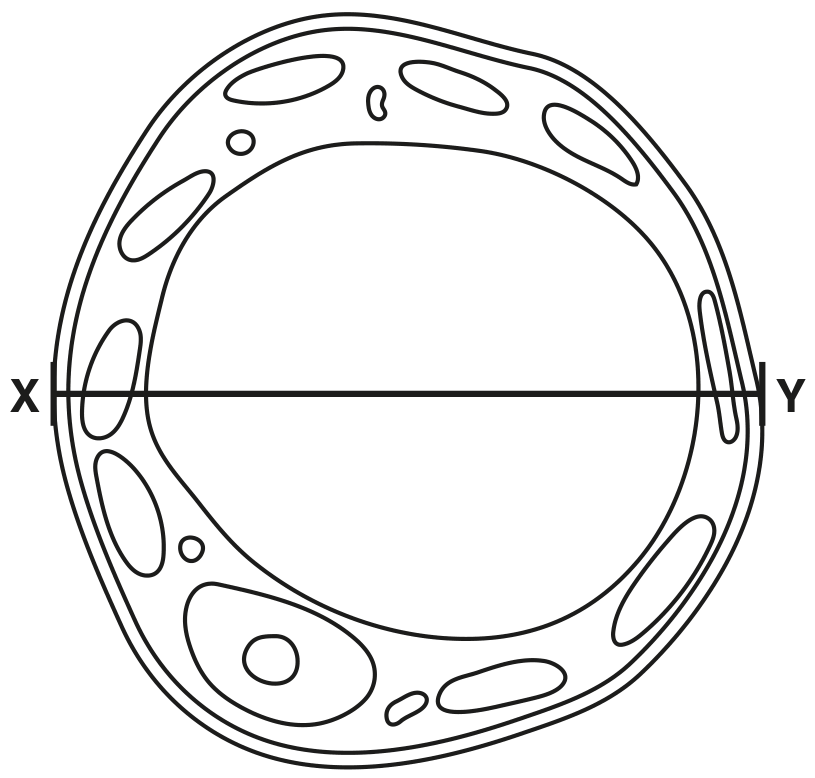
Fig. 1.1
Some of the water that moves out of the xylem within the leaves takes an apoplastic pathway to the spongy mesophyll cells. There is a film of water on the external surfaces of these cells. This allows the intercellular air spaces to become saturated with water vapour.
State, in terms of water movement from the xylem to the spongy mesophyll cells in the leaf, what is meant by the apoplastic pathway.
Describe what happens to the water vapour in the intercellular air spaces during the day and explain why this happens.