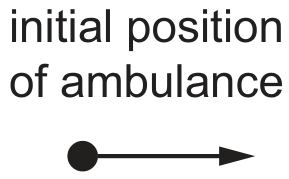
A student investigates the sound from a horn attached to a car, as shown in Fig. 2.1.
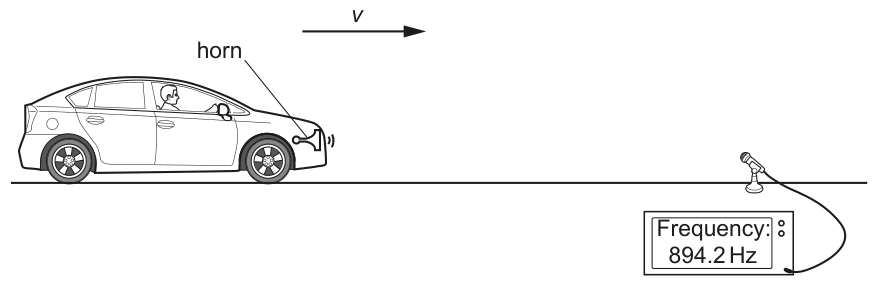
Fig. 2.1 (not to scale)
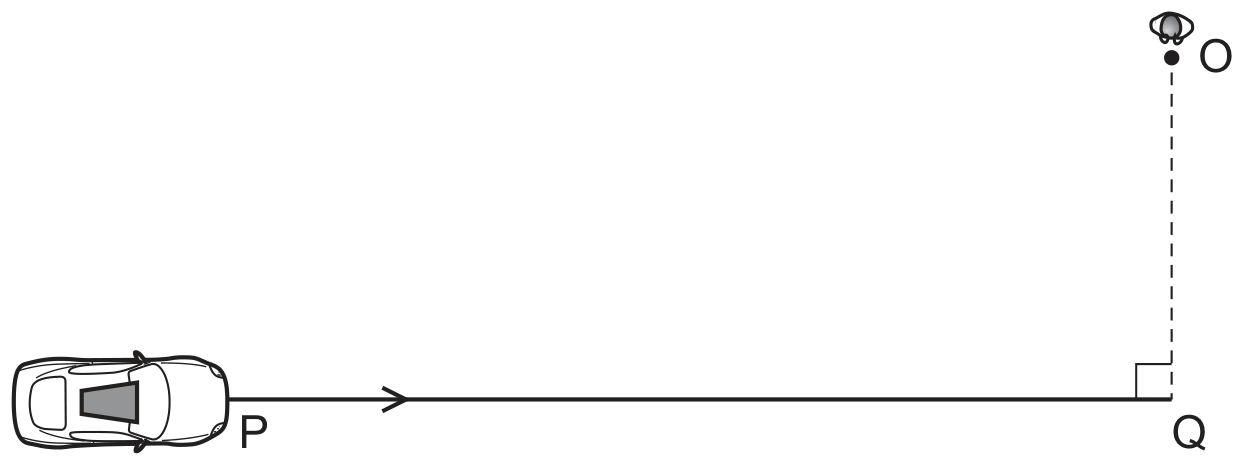
A microphone is placed at the side of the road and connected to a frequency meter. The car travels towards the microphone. The frequency f of the sound detected by the microphone is read from the frequency meter.
The speed of the car is measured by two speed detectors. The two measurements of speed are and . The average speed v of the car is determined from and .
The experiment is repeated for different speeds of the car.
It is suggested that f and v are related by the equation
where is the frequency of the sound emitted by the horn and k is a constant.
A graph is plotted of on the y-axis against v on the x-axis.
Determine expressions for the gradient and y-intercept.
Using your answers to (a), (c)(iii) and (c)(iv), determine the values of and k. Include appropriate units.