EduNinja
[Maximum number: 1]

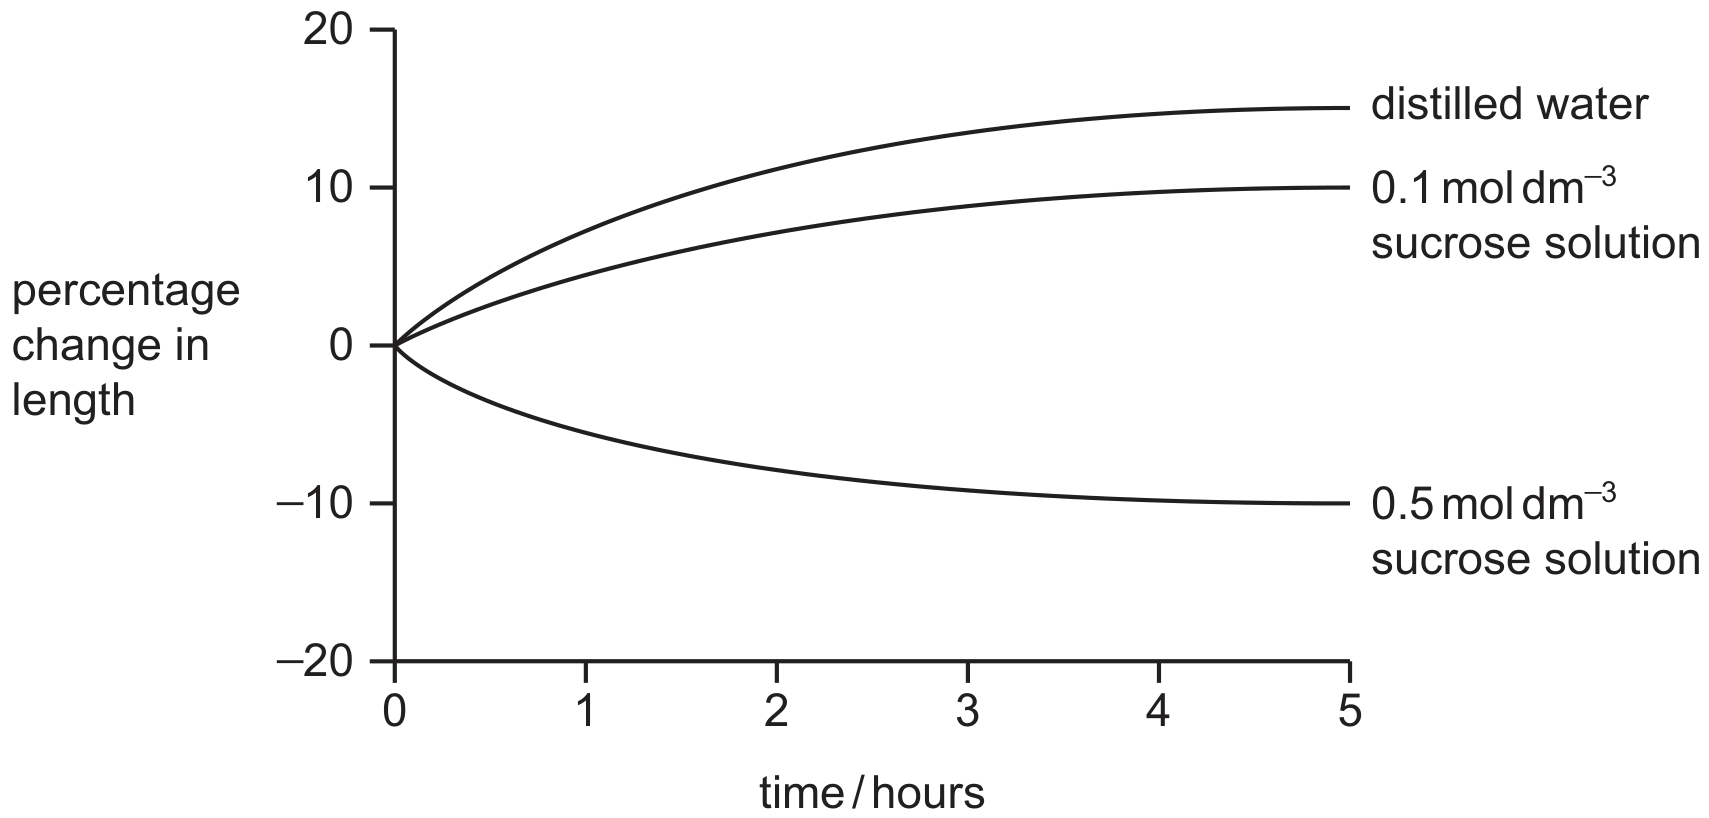
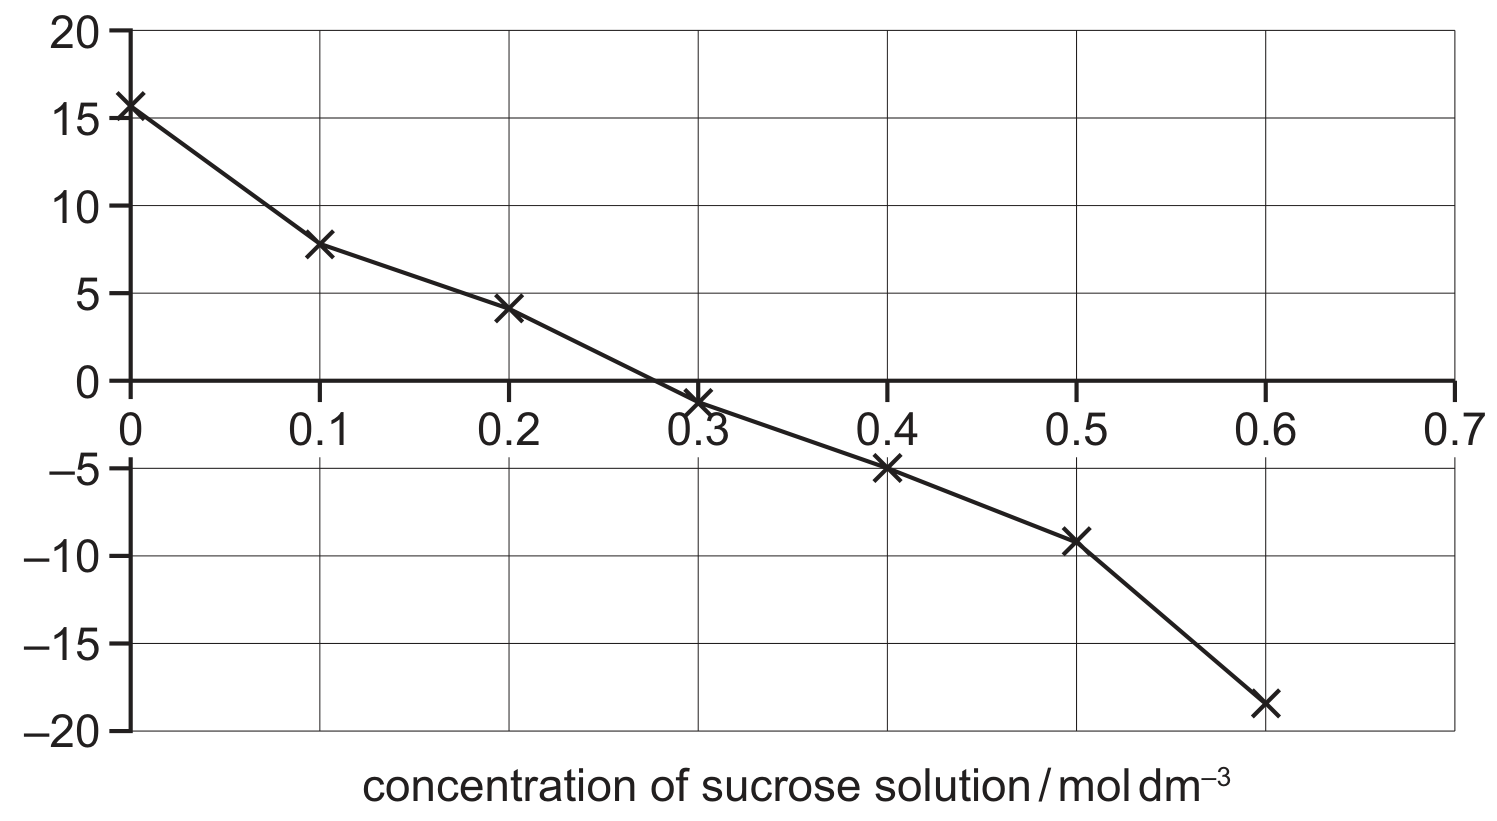
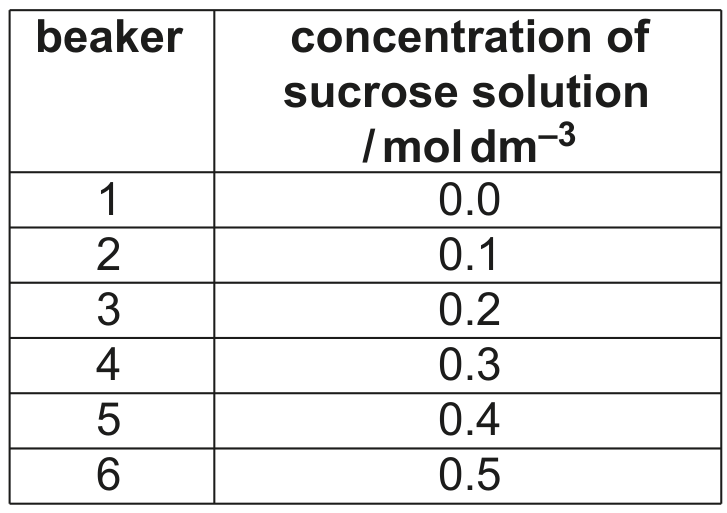
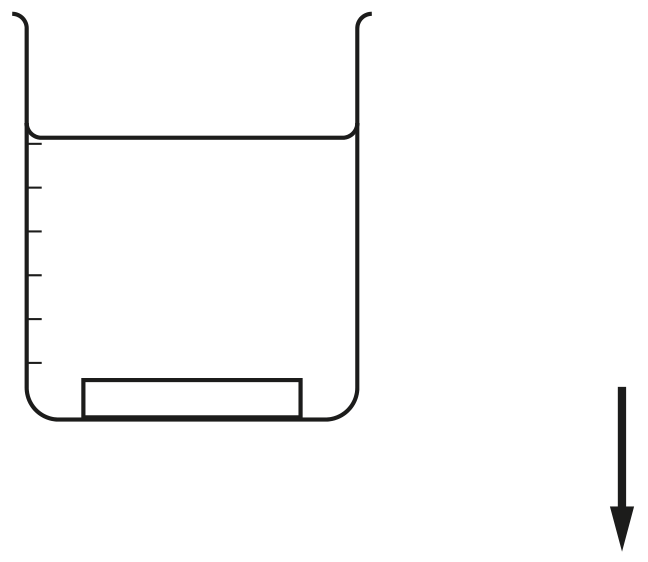
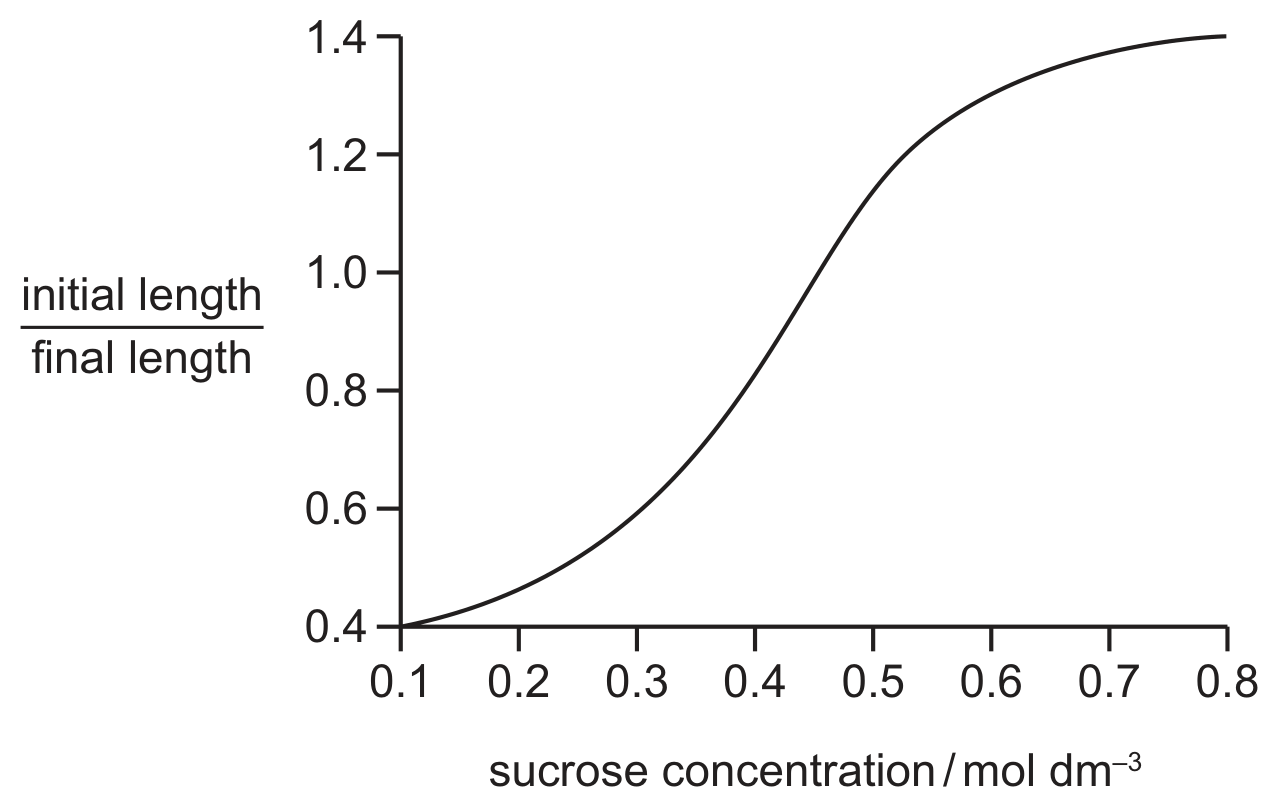
Strips of plant tissue were immersed in a range of sucrose solutions of different concentrations. Their lengths were measured before immersion and after 30 minutes.

The graph shows the ratio of initial length to final length.

Question image

What is a correct description of the change in the cells and in their water potential as the sucrose concentration increases?

change in the cells

change in the water potential

less turgid

more negative

less turgid

less negative

more turgid

less negative

more turgid

more negative

[Maximum number: 1]

The stages of an investigation using plant tissue are listed below.
- A freshly cut slice of plant tissue was rinsed in distilled water, dried and weighed.
- This slice was placed in a solution with a water potential of -4 arbitrary units for thirty minutes.
- The slice was removed from the solution, dried and reweighed.
- The mass of the slice was the same as its original mass.

Which conclusions can be drawn from this investigation?
1 The water potential of the cells of the plant tissue is -4 arbitrary units.
2 The cell sap of the plant tissue has a lower water potential than the surrounding solution.

3 There has been no net movement of water.
4 The cell wall of the plant tissue will not be in contact with the cell membrane.

A

1 and 2

B

1 and 3

C

2 and 4

D

3 and 4

[Maximum number: 1]

A student weighed a cylinder of potato and then put it into a test-tube containing a salt solution.
The potato cylinder was removed from the salt solution after one hour. It was blotted dry and then reweighed. The student recorded that the potato had lost mass.

Which row shows the correct explanation for the results the student collected?

water potential of the potato cells before soaking compared to the water potential after soaking

condition of the potato cells after soaking

higher

plasmolysed

higher

turgid

lower

plasmolysed

lower

turgid

[Maximum number: 1]

Equal sized potato pieces were placed into a test-tube and covered with a sucrose solution. The test-tube was left for 30 minutes. All other variables were standardised.

After 30 minutes, the potato piece had not changed in size.
What can be concluded from this result?

A

The concentration of sucrose is the same in the potato and in the solution and there is no more movement of water into or out of the potato.

B

The concentration of sucrose is the same in the potato and in the solution and there is no net movement of water into the potato.

C

The water potential is the same in the potato and in the sucrose solution and there is no more movement of water into or out of the potato.

D

The water potential is the same in the potato and in the sucrose solution and there is no net movement of water into or out of the potato.

[Maximum number: 1]

Strips of potato tissue were immersed in distilled water or in sucrose solutions of different concentrations. The graph shows the percentage change in length of the potato tissue over time.

Question image

Which row correctly shows how the water potentials of the distilled water and sucrose solutions differ from the initial water potential of the potato tissue?

distilled water

0.1 moldm30.1 \mathrm{~mol} \mathrm{dm}^{-3} sucrose solution

0.5 moldm30.5 \mathrm{~mol} \mathrm{dm}^{-3} sucrose solution

less negative

less negative

more negative

less negative

more negative

more negative

more negative

less negative

less negative

more negative

more negative

less negative

[Maximum number: 1]

An experiment was carried out to investigate the effect of concentration of sucrose solution on cells in a plant tissue.

A sample of plant tissue was cut into seven cylinders of equal length and diameter. The mass of each cylinder was recorded.

Each of the seven cylinders was put into a different sucrose solution concentration.

Question image

After two hours, the cylinders were removed, blotted dry and reweighed. The percentage change in mass of each cylinder was recorded.

The graph shows the results of this investigation.
percentage change in mass of plant tissue cylinder

Question image

Which row explains the results if plant tissue cells were put in a sucrose solution of 0.45moldm30.45 \mathrm{moldm}^{-3} ?

water potential of the cytoplasm of the cells at the start of the experiment compared with the water potential of 0.45 moldm30.45 \mathrm{~mol} \mathrm{dm}^{-3} sucrose solution

change in volume of the vacuoles of the cells at the end of the experiment, that were initially placed in 0.45 moldm30.45 \mathrm{~mol} \mathrm{dm}^{-3} sucrose solution

less negative

decreased

less negative

increased

more negative

decreased

more negative

increased

[Maximum number: 1]

A student carried out an investigation to estimate the water potential of potato tissue. The main steps in the procedure and in the analysis of results are outlined in Fig. 6.1.

Table

Six different concentrations of sucrose solution were prepared and an equal volume of each was placed in a labelled beaker. Six equal-sized blocks of potato tissue were cut out of the same potato, blotted dry and weighed.

Fig. 6.1

Fig. 6.1

One potato block was immersed in the solution in each beaker for 30 minutes.

After this time, the block was removed, blotted dry and reweighed.

The experiment was repeated twice.

The mean percentage change in mass of potato tissue was calculated for each concentration of sucrose used.

A graph was drawn of mean percentage change in the mass of potato tissue against concentration of sucrose.

(a)

State how the graph is used to estimate the water potential of the potato tissue.

[ 1 ]
0