EduNinja
[Maximum number: 1]

The diagram represents two solutions, P and Q, that were separated by a partially permeable dialysis tubing.

Question image

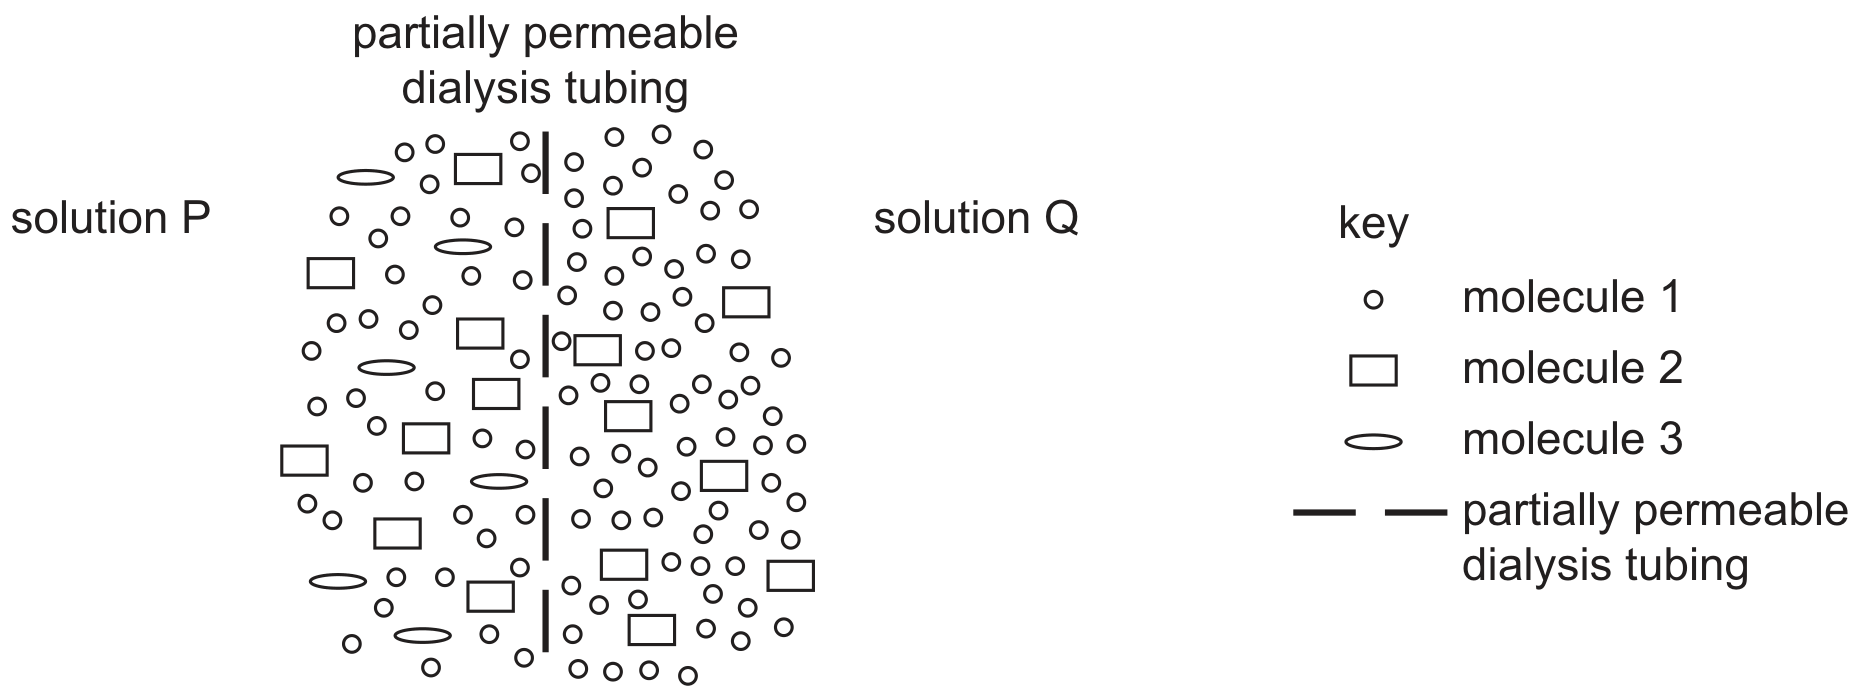
What will be the initial movement of the molecules, 1,2 and 3 , between solution P and solution Q?

net movement from Q to P

net movement from P to Q

no net movement

molecule 1

molecule 2

molecule 3

molecule 1

molecule 3

molecule 2

molecule 2

molecule 3

molecule 1

molecule 3

molecule 1

molecule 2

[Maximum number: 1]

An indicator is colourless in acid and pink in alkali.
In an experiment a petri dish of agar was prepared using an acidic solution of this indicator.
A disc of agar 1 cm in diameter was removed from the centre to create a well.
A white card showing circular marker lines 1 cm apart was placed underneath the petri dish.
1 cm31 \mathrm{~cm}^{3} alkali solution was put into the well in the agar and a stop-watch was started.
A circular disc of pink colour appeared and spread through the agar. It reached the first marker line in a short time but took longer to reach the second marker line and a very long time to reach the third marker line.

What explains these observations?

A

facilitated diffusion of alkali solution

B

facilitated diffusion of the indicator

C

simple diffusion of alkali solution

D

simple diffusion of the indicator

[Maximum number: 1]

A student set up an experiment to investigate diffusion.
A block of agar, 1.0 cm×1.0 cm×1.0 cm1.0 \mathrm{~cm} \times 1.0 \mathrm{~cm} \times 1.0 \mathrm{~cm}, was stained uniformly with a water-soluble blue dye. The block of agar was put into a test-tube containing 10 cm310 \mathrm{~cm}^{3} of distilled water at 20C20^{\circ} \mathrm{C}.

The intensity of the blue colour of the water after five minutes was measured.
Four other experiments, A, B, C and D, were then carried out using different numbers of agar blocks, different sizes of agar blocks and different temperatures. All other variables were standardised.

Which experiment would give a lighter blue colour in the water after five minutes compared to the first experiment?

size of each agar block/cm

number of agar blocks

temperature of distilled water /C/{ }^{\circ} \mathrm{C}

0.5×0.5×0.50.5 \times 0.5 \times 0.5

8

30

0.5×0.5×0.50.5 \times 0.5 \times 0.5

2

20

0.5×1.0×1.00.5 \times 1.0 \times 1.0

2

30

2.0×1.0×1.02.0 \times 1.0 \times 1.0

1

20

[Maximum number: 1]

The diagram shows apparatus set up to investigate the effect of putting a 10 % glucose solution in a selectively permeable bag (Visking tubing) and surrounding it with water.

Question image

Samples from the surrounding water were tested with Benedict's solution after 10 minutes and after 20 minutes. The change in volume of glucose solution was observed after 20 minutes.

Which row is correct?

after 10 minutes

after 20 minutes

green

blue

increased

green

orange

increased

red

orange

decreased

yellow

green

decreased

[Maximum number: 10]

A person who is exposed to tobacco smoke is at greater risk of lung cancer and chronic obstructive pulmonary disease (COPD).

Many people with COPD have both chronic bronchitis and emphysema. These diseases cause changes in the gas exchange system. For example, changes occur in the total lung surface area to volume ratio (SA:V).

(a)

Cubes A, B and C were placed in a small beaker. At time 0 seconds, dilute hydrochloric acid was added to the beaker to cover the cubes.

The student timed how long it took for each cube to change colour completely.
Complete Fig. 4.1 to show the results that were obtained.

Fig. 4.1

Fig. 4.1

0