
Question 2(a)(x)
Indonesia is a middle-income country in southeast Asia. Its main agricultural exports are palm oil and coffee, which Malaysia also produces. The maximum amount of each good that Indonesia and Malaysia can produce in one hour is shown in Table 3.
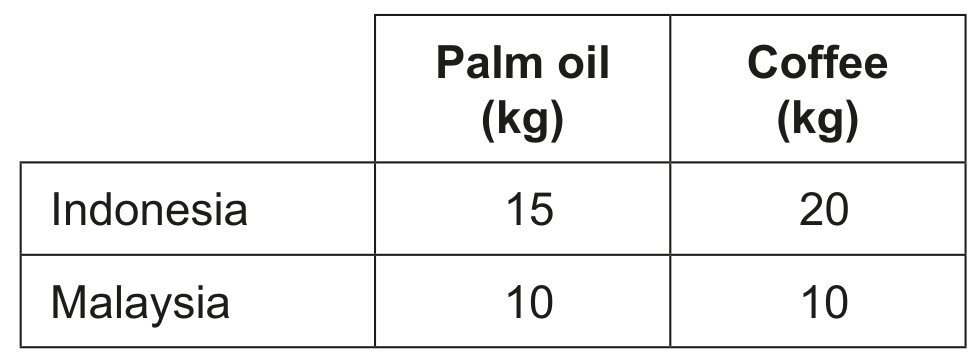
Table 3
Using Figure 3, calculate the total welfare loss, in billions of IDR, as a result of the subsidy.
The extent to which the removal of the subsidy would affect the quantity used depends on the price elasticity of demand (PED) for fuel. Figure 3 shows that when the price rises from IDR 5000 to IDR 6000 per litre, the PED is calculated to be 0.71 .
There are other issues and data (see Table 6) relevant to the reduction of carbon emissions in Indonesia:
- The car ownership rate is expected to remain low, at around 10 % of the population. Therefore, public transport and electric bicycles are essential for efficiency. The World Bank suggests that the promotion of low-carbon transport would deliver not only economic growth but also other benefits, such as lower congestion and less pollution.
- The Asian Development Bank argues that Indonesia's carbon tax, which is only USD 2.10 per ton of carbon dioxide emissions, will not have a significant market impact.
- There is insufficient investment in renewable energy sources. Consequently, most electricity continues to be generated with low-cost coal.
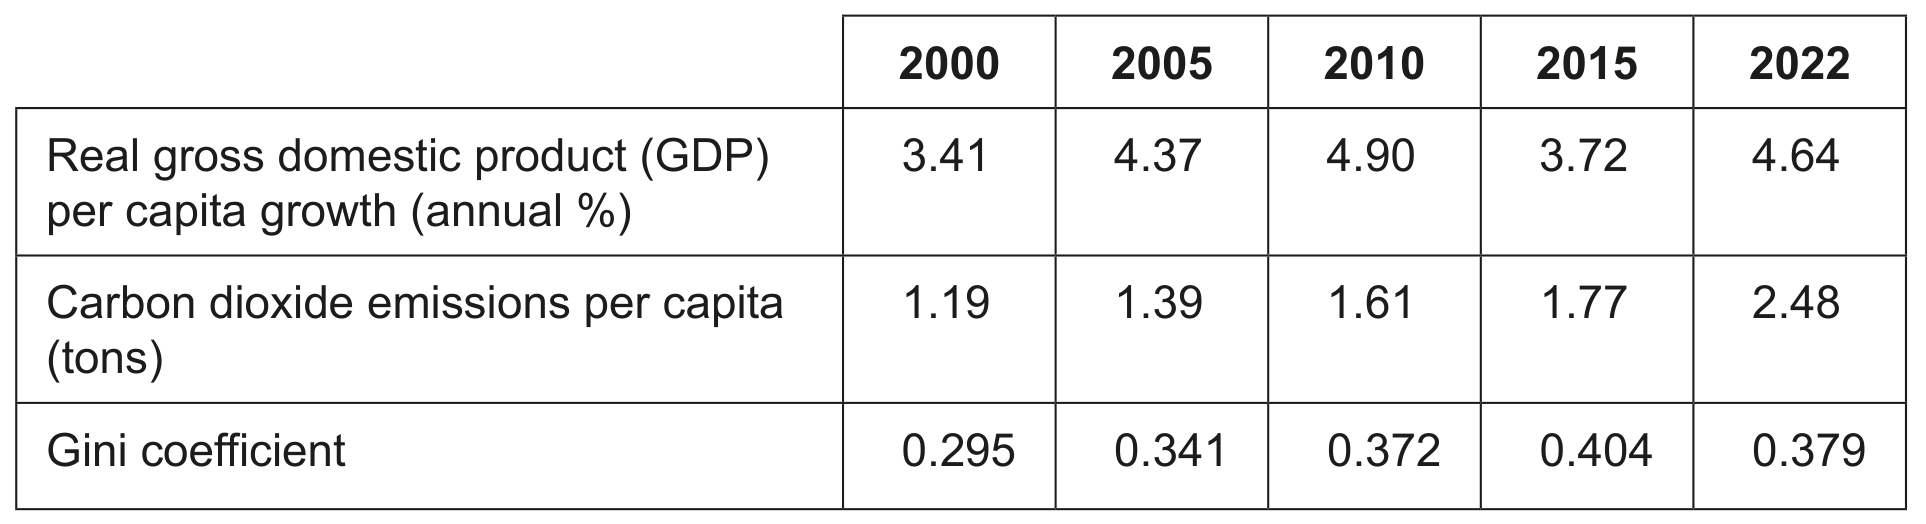
Table 6