EduNinja

IB Economics HL2.6 Elasticity of supplyQuestion Bank

Question 1

[Maximum number: 6]

Note that widgets are an imaginary product.

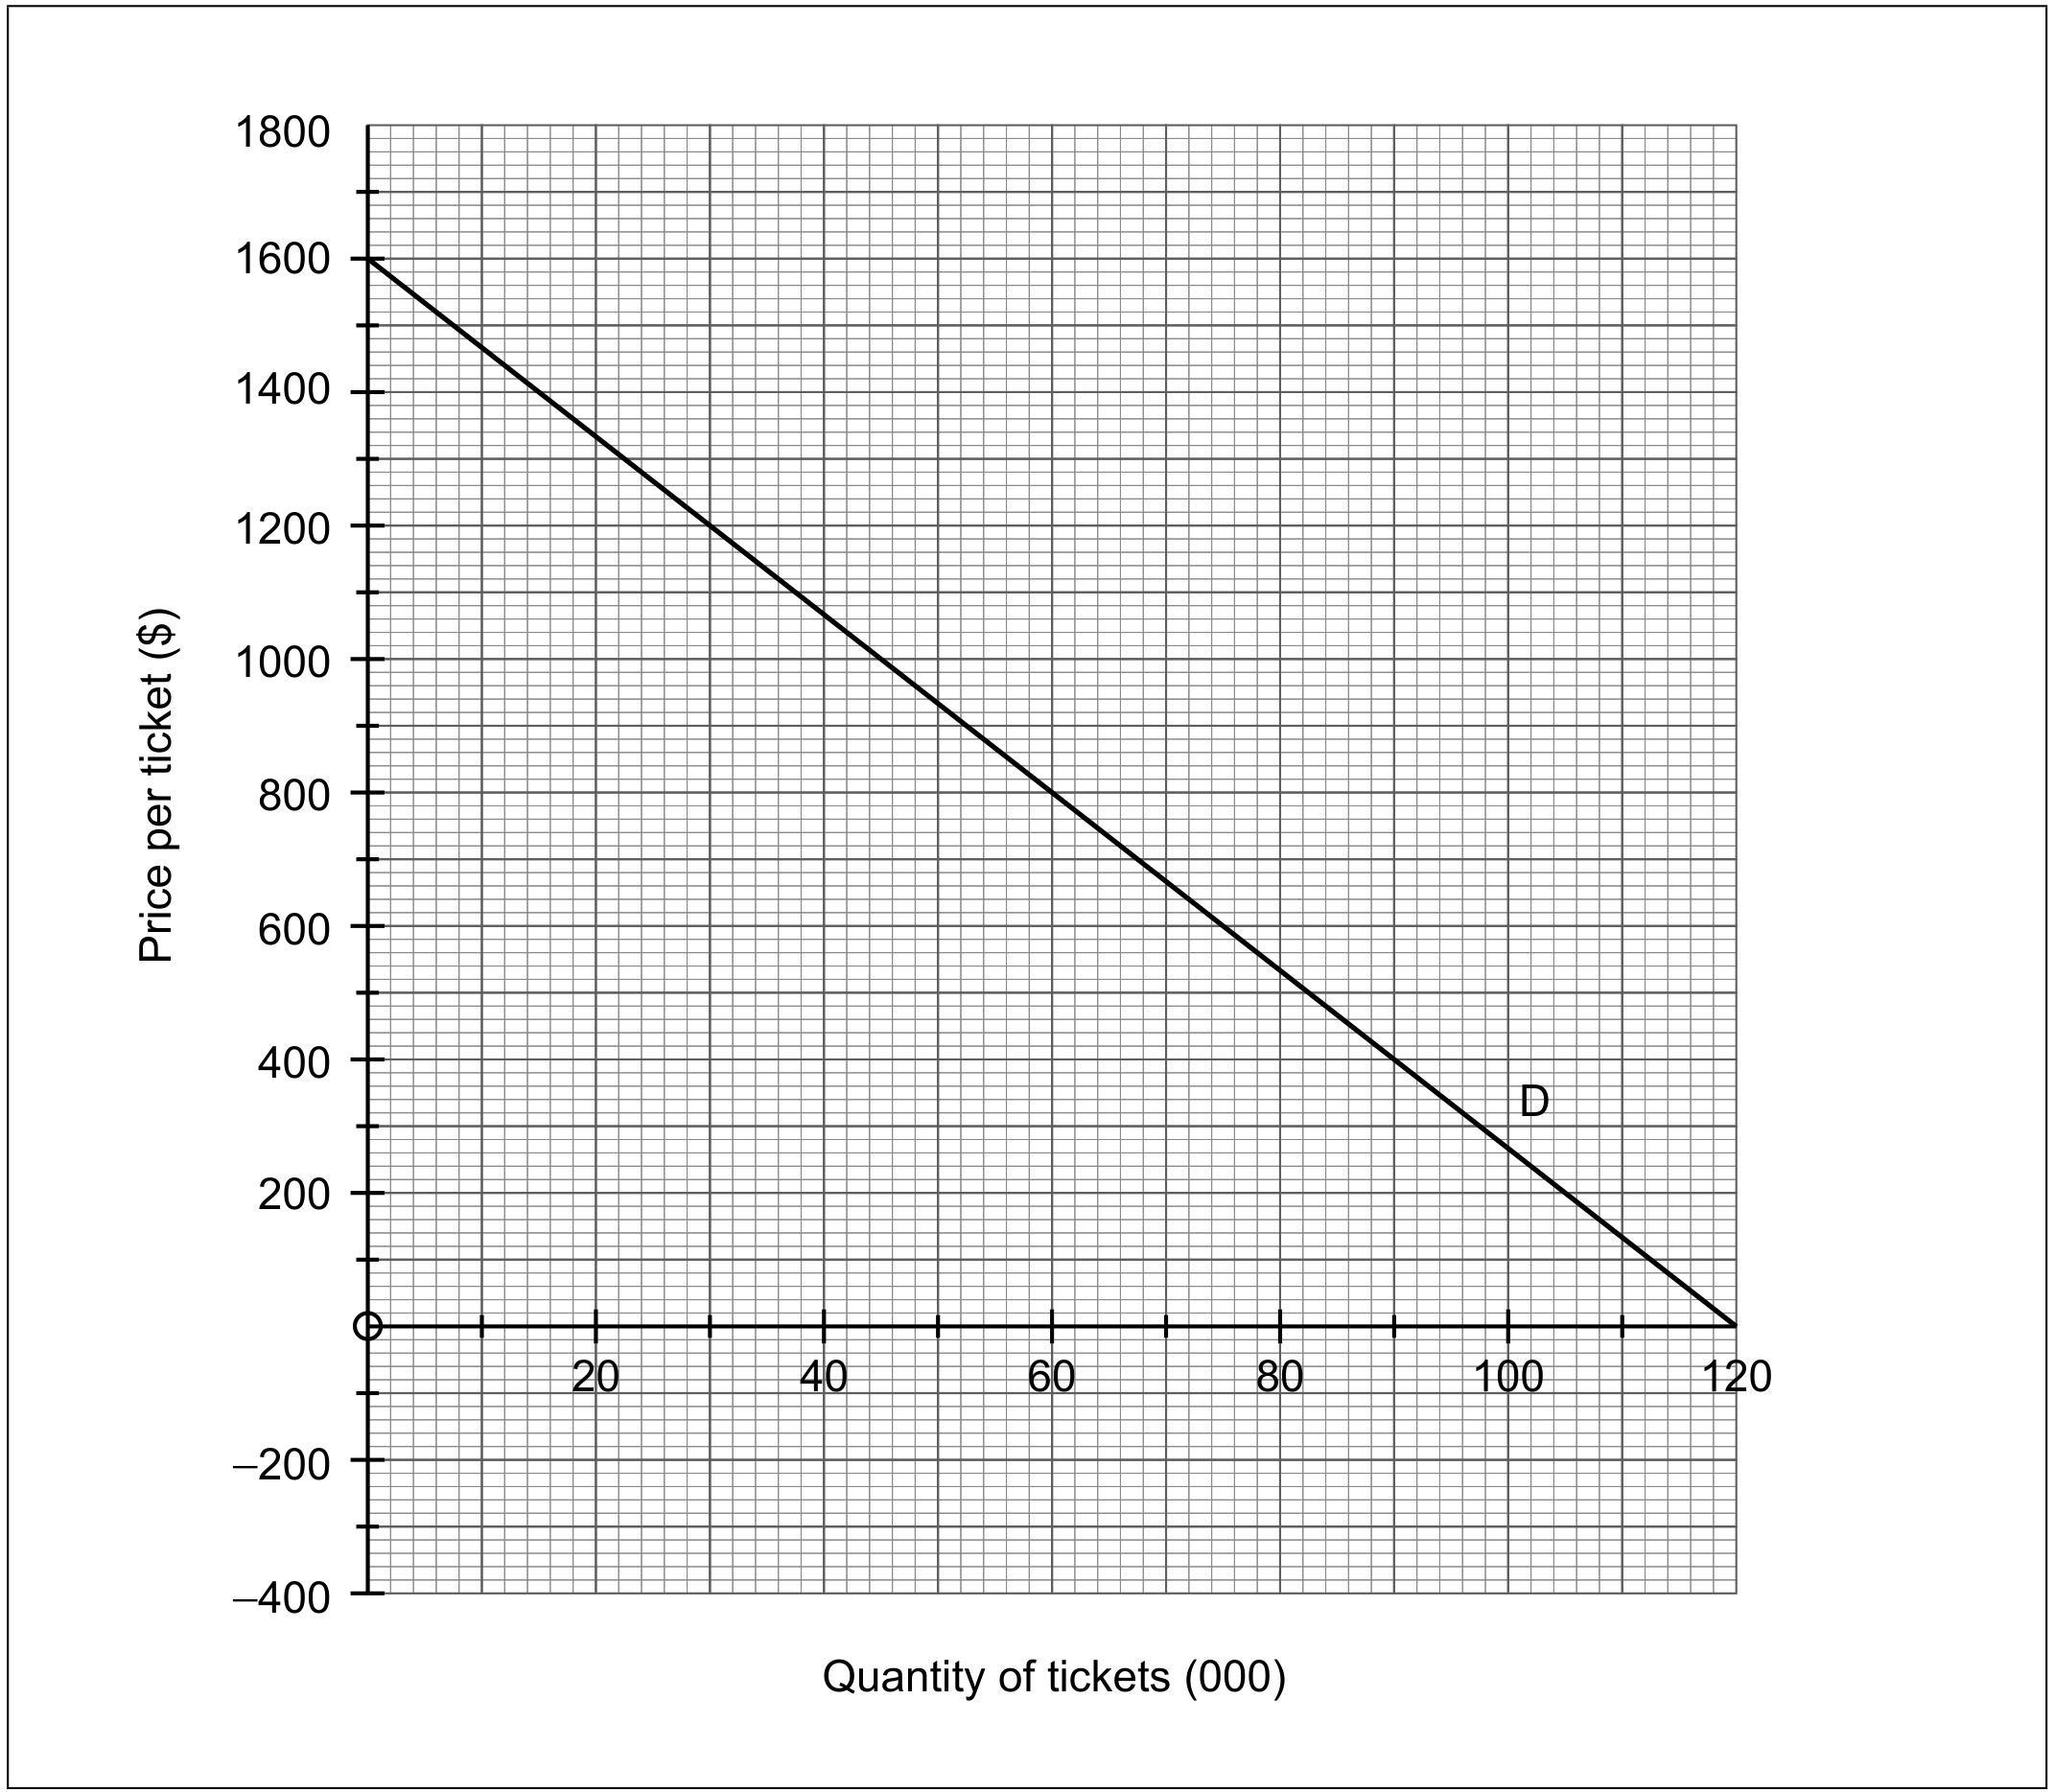
In Country X, the supply and demand for widgets are given by the functions

Qs=45+4.5PQd=1803P\begin{aligned} & Q s=-45+4.5 P \\ & Q d=180-3 P \end{aligned}

where P is the price per widget in dollars ($), Qs is the quantity of widgets supplied (thousands per year) and Q d is the quantity of widgets demanded (thousands per year).

The supply ( S ) and demand ( D ) functions are represented in Figure 1.
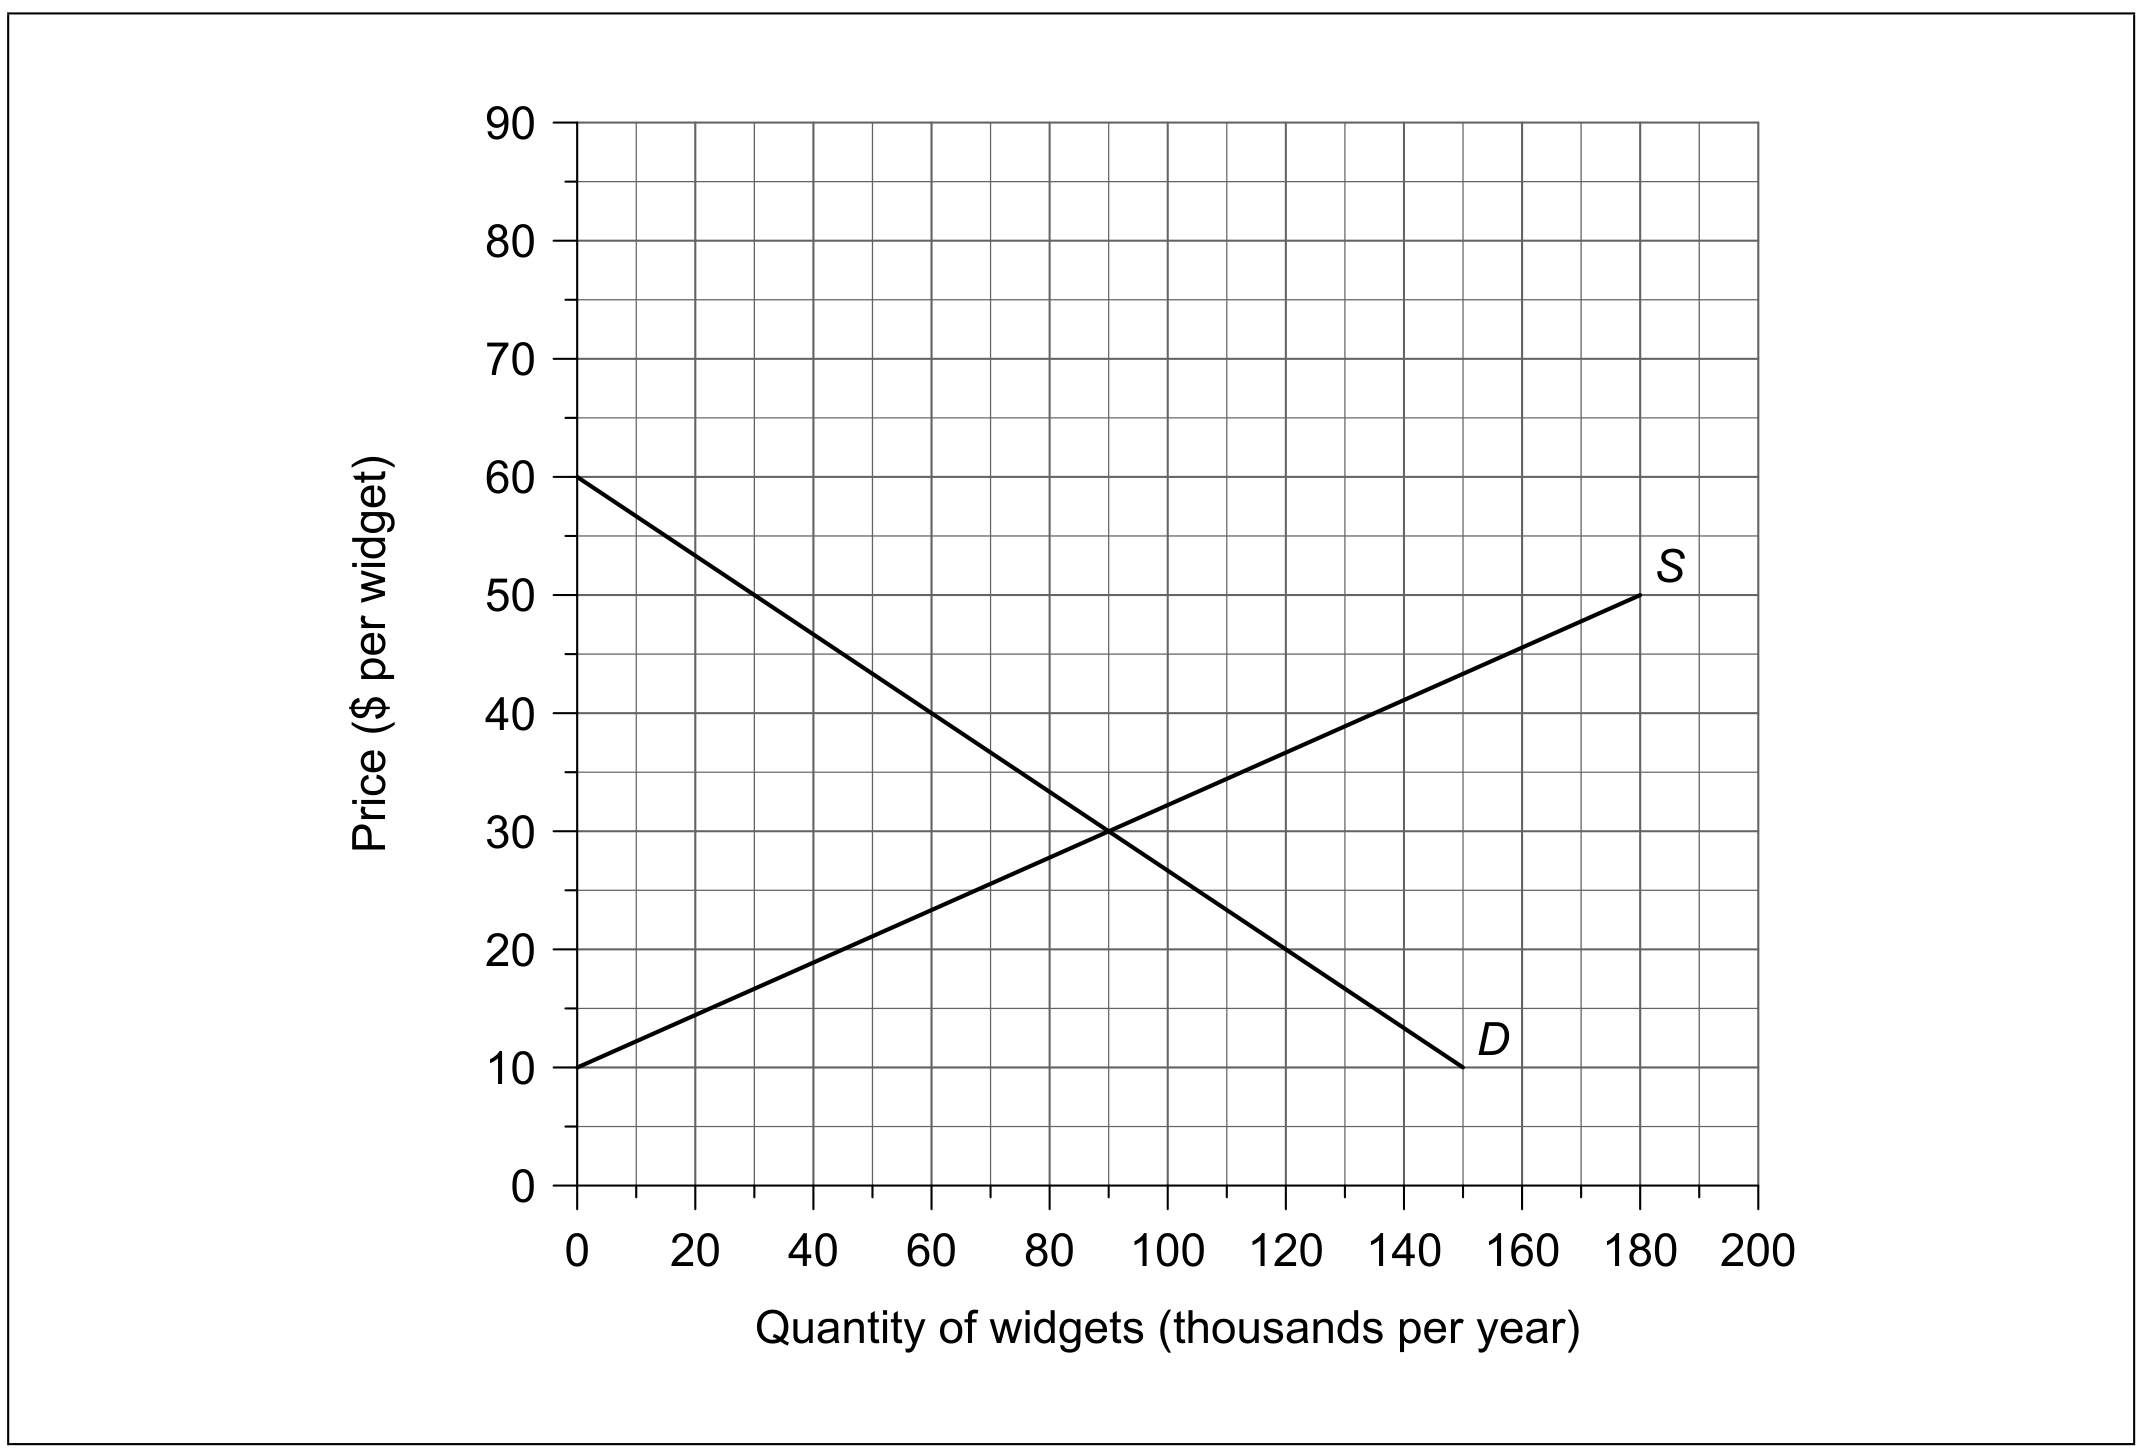
Figure 1

Figure 1

Question 1(f)

(a)

Define the term price elasticity of supply.

The time taken to produce goods is an important determinant of the price elasticity of supply.

[ 2 ]

Question 1(g)

(b)

Apart from time, explain two factors which influence the price elasticity of supply.

Figure 2 shows the demand for and supply of widgets in Country Y .
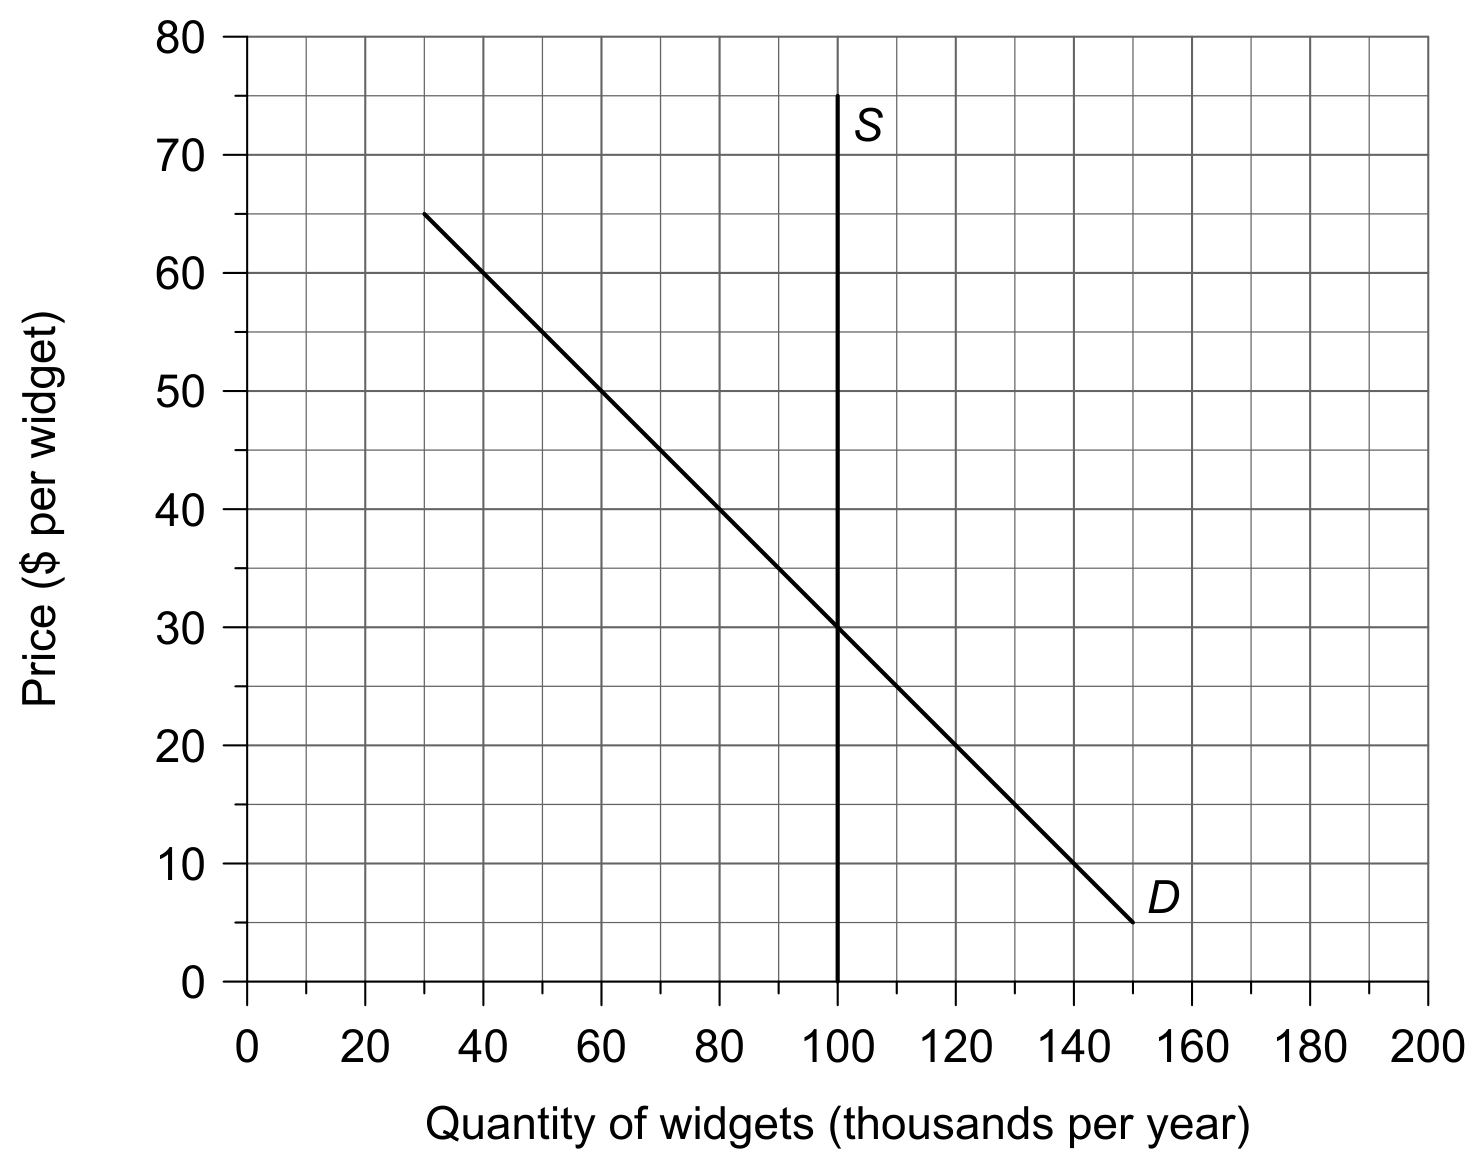
Figure 2

Figure 2

The government of Country Y decides to impose an indirect tax of $10 per widget.

[ 4 ]

Question 1

[Maximum number: 2]

Note that widgets and pidgets are imaginary products.

In the country of Burbia, the demand and supply of widgets are given by the functions

Qd=2494PQs=150+14P\begin{aligned} & Q d=249-4 P \\ & Q s=150+14 P \end{aligned}

where Qd is the quantity demanded per month, Qs is the quantity supplied per month and P is the price per widget in dollars ($).

Question 1(i)

(a)

The final of the 2018 Football World Cup is expected to be held in the Luzhniki stadium, Moscow. The capacity of the stadium is 80000 . The expected cost of holding the final is US $ 12 million, which is not dependent on the number of people attending the match. All tickets will be sold for the same price.

Question image

State the value of the price elasticity of supply (PES) for tickets to the 2018 Football World Cup final.

[ 1 ]

Question 1(j)

(b)

In the diagram on page 6 draw and label the supply curve for tickets at the 2018 Football World Cup final.

[ 1 ]

Question 1

Question 1(a)

(a)

Explain why the price elasticity of supply (PES) for primary commodities is generally lower than the PES for manufactured products.

[ 10 ]

Question 2

[Maximum number: 2]

Traffic congestion is a major problem in India. It is estimated that congestion in four major cities costs the Indian economy approximately US $ 22 billion annually. According to a 2019 survey, India has four of the eight most congested cities in the world. People in these cities pay higher fuel costs, inhale toxic gases, and waste up to 11 days a year stuck in traffic.

In New Delhi, India's capital city, 45 % of workers use cars to travel to work, while 89 % of workers indicate plans to purchase a car in the next five years. However, 80 % of car users say they would change their plans if ridesharing businesses such as Uber could meet their requirements on price, timeliness and availability.

Question 2(a)

Question 2(a)(v)

(a)
(i)

Using Figure 2 and your answer to part (a)(ii), show that in the absence of indirect taxes the supply of petrol in New Delhi would be price inelastic.

[ 2 ]

Question 3

Question 3(d)

Question 3(d)(i)

(a)
(i)

Define the term price elasticity of supply (PES).

[ 2 ]

Question 3(d)(ii)

(ii)

The increase in demand of 10000 kg per month (see 3.(b)) has led to a new equilibrium price of $ 15 and a new equilibrium quantity of 804000 kg butter.

Calculate the PES for butter between the original and the new market price.

[ 2 ]

Question 3(e)

(b)

Explain two factors that determine the PES of a product.

[ 4 ]
0 selected