Question 1
Read the extracts and answer the questions that follow.
Text A - Overview of Tanzania
(1) Tanzania is one of Africa's fastest growing economies with an average of 7 % annual economic growth since 2000. It is a politically stable country, rich in wildlife and natural resources. However, the growth has been concentrated in urban manufacturing, using capital intensive production. The benefits from this growth have not reached all people and significant inequalities exist between urban and rural areas. Although the relative poverty rate has fallen over the last 15 years, the number of people living in absolute poverty has increased.
(2) Most people are employed in the slow-growing agricultural sector that relies on unskilled labour. Although incomes increased from 2008 to 2018, the demand for agricultural goods only increased by 21 % during this time period. Over 70 % of Tanzania's population lives in rural areas, relying on subsistence farming with limited tradable crops. Only 30 % of land is being used for agricultural production. With investment, the remaining unused land could be developed and generate income for farmers.
(3) The rural sector struggles to meet Tanzania's food requirements due to low levels of skilled labour and productivity. Additionally, high youth unemployment leads to large numbers of unskilled rural youth migrating to the cities, often finding employment in the informal sector where wages and working conditions are poor. Insufficient investment and lack of government support for diversifying the agriculture sector have been blamed for the persistent inequalities and poverty.
(4) Tanzania's cities have experienced a growing middle class with strong purchasing power and political influence who have placed demands on the government for cheaper electricity, better infrastructure, and more imported goods. In response, the government provided subsidies for electricity in city centres and tax benefits to foreign companies operating in Tanzania. There is concern that these measures may worsen inequality and lead to social unrest.
(5) The growth of Tanzania's manufacturing and service sector was funded through aid and large government borrowing, resulting in high national debt. Most of the government borrowing was from foreign sources and in US dollars (US$), which is a concern due to a recent depreciation of the Tanzanian shilling (Tanzania's currency) against the US$. Some of the debt was borrowed domestically and placed upward pressure on interest rates. Higher interest rates have resulted in crowding out but helped keep inflation under control.
Text B - Strategies and opportunities for Tanzania
(1) Previous governments have used interventionist supply-side policies to improve access to water, education, and health services. However, the health service improvements are not keeping up with population growth and many young people are still not completing secondary school. Infrastructure has improved, but it is still insufficient as producers in the rural sector find it difficult to reach markets and access supplies.
(2) Aid organizations are currently supporting new sustainable businesses in rural areas through training programmes, especially for women and young people, who make up most of the unemployed in rural areas. Economists have advised the government to improve access to credit through microfinance organizations and to simplify regulations to make it easier to start new businesses.
(3) The government is establishing property rights in rural areas to provide security for farmers. Historically, farmers could easily lose their land, which reduced their incentive to invest in productive farming methods. The government wants to develop Tanzania's land resources and lower its reliance on imported food. To reduce food imports, a subsidy will be granted to dairy farmers to allow them to compete against imported dairy products.
(4) Tanzania is a member of the East African Community (EAC) customs union and common market. However, Tanzania needs to improve human capital and encourage diversification so that the benefits of regional integration can reach the poor. These policies can also help attract foreign direct investment (FDI). Opportunities for growth through trade will expand as the EAC works towards becoming a monetary union in 2024.
Text C - Oil pipeline to be constructed
Tanzania and Uganda plan to construct a major oil pipeline from Uganda through Tanzania, ending at a port in Tanzania. This will attract FDI which could help fund infrastructure and generate jobs. However, environmentalists are concerned about potential ecological damage due to the waste created during the construction of the pipeline. Economists have suggested the waste could be avoided through a circular economy approach in the planning and construction stage.
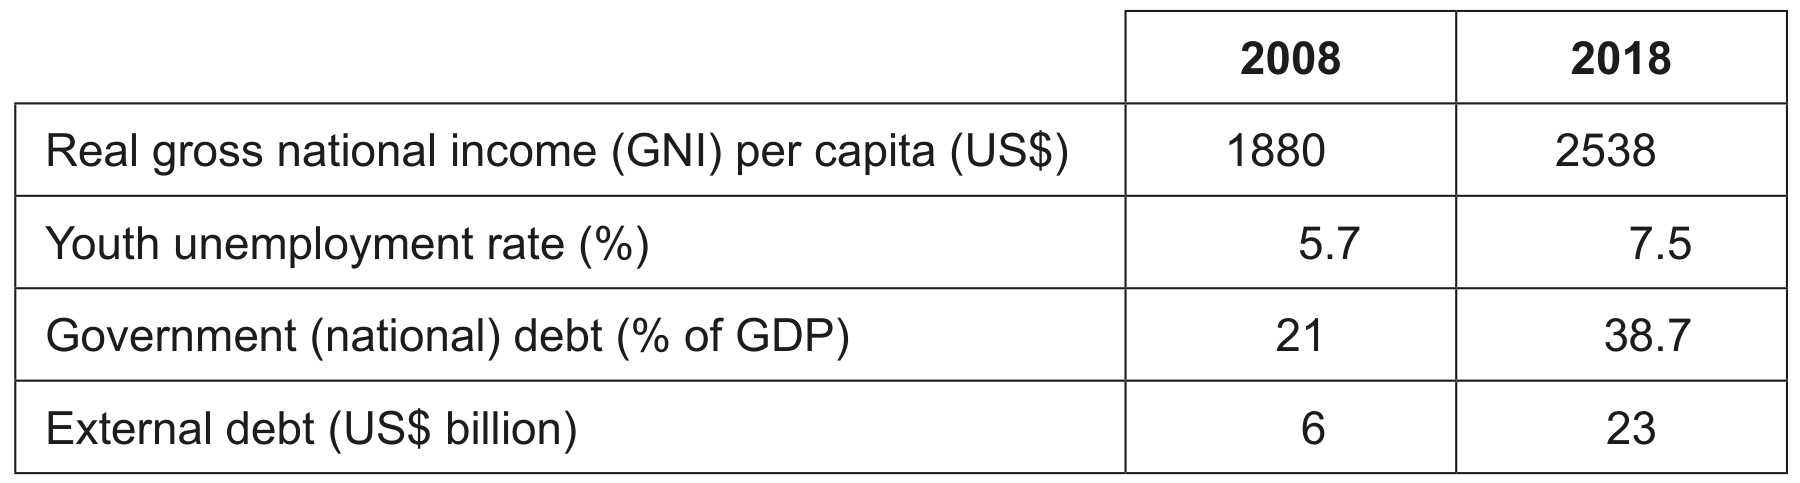
Table 1: Economic data for Tanzania
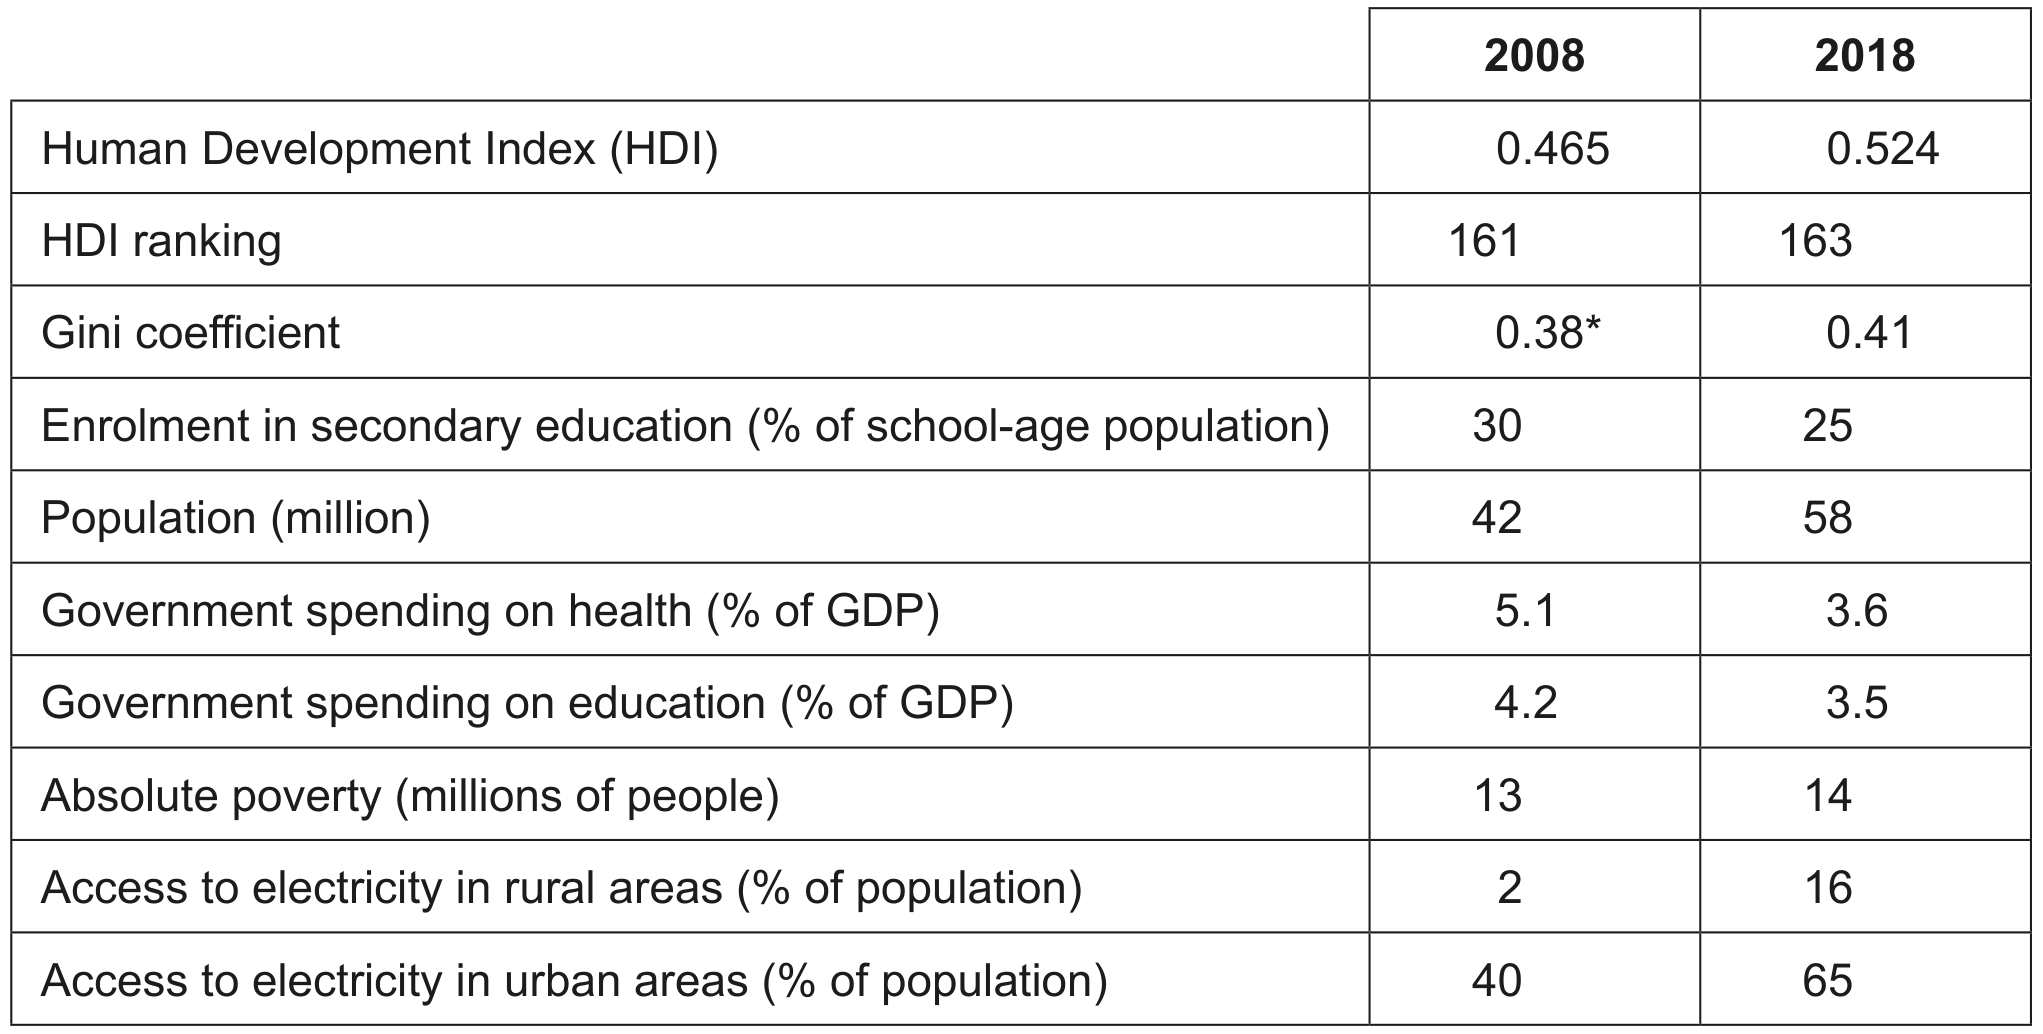
Table 2: Development data for Tanzania
* Estimate
Question 1(a)
Question 1(a)(i)
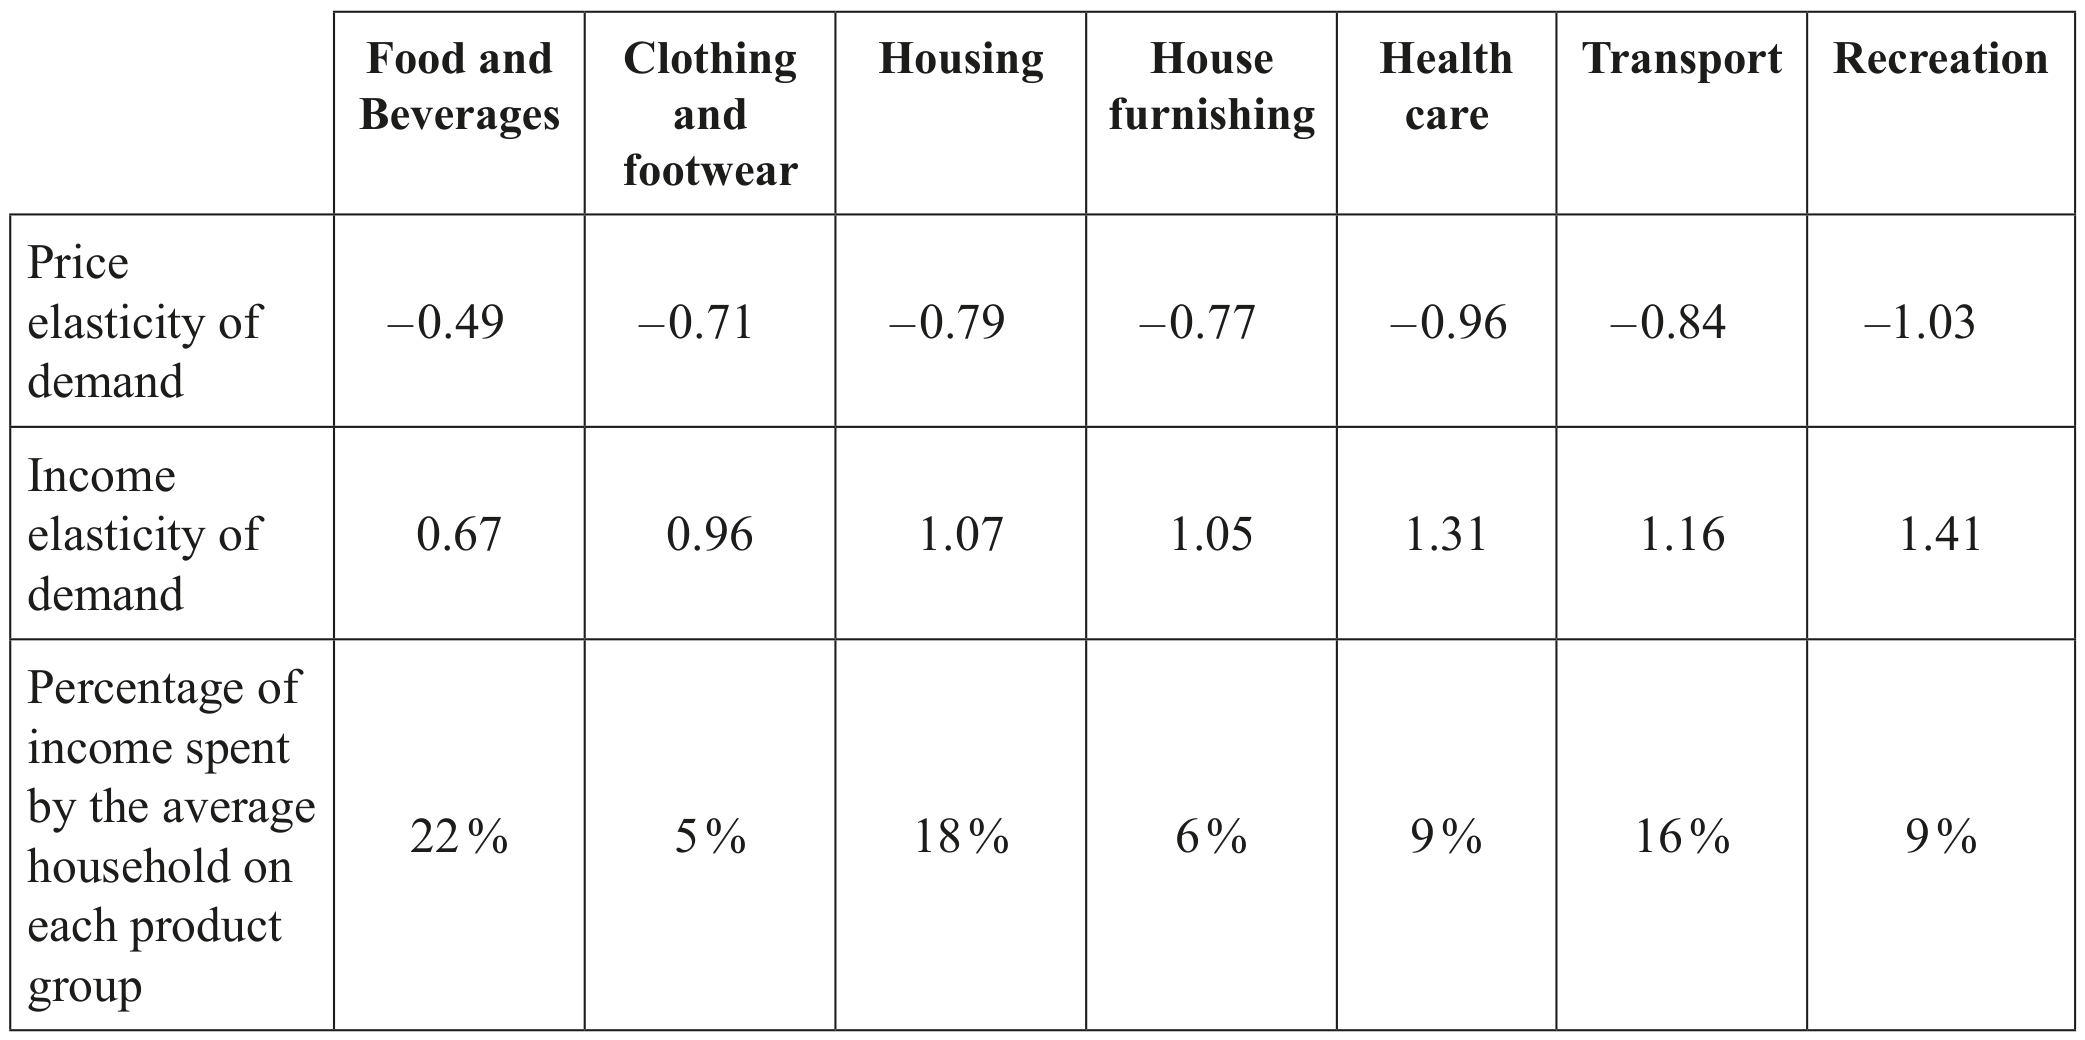
Define the term demand indicated in bold (Text A, paragraph 2).