EduNinja
[Maximum number: 1]

Bumblebees (Bombus terrestris) are insects that have both individual and social learning capacities. Scientists trained individual bumblebees to push either a blue tab or a red tab on a puzzle box to rotate the lid, exposing a reward consisting of a sucrose solution.

Question image

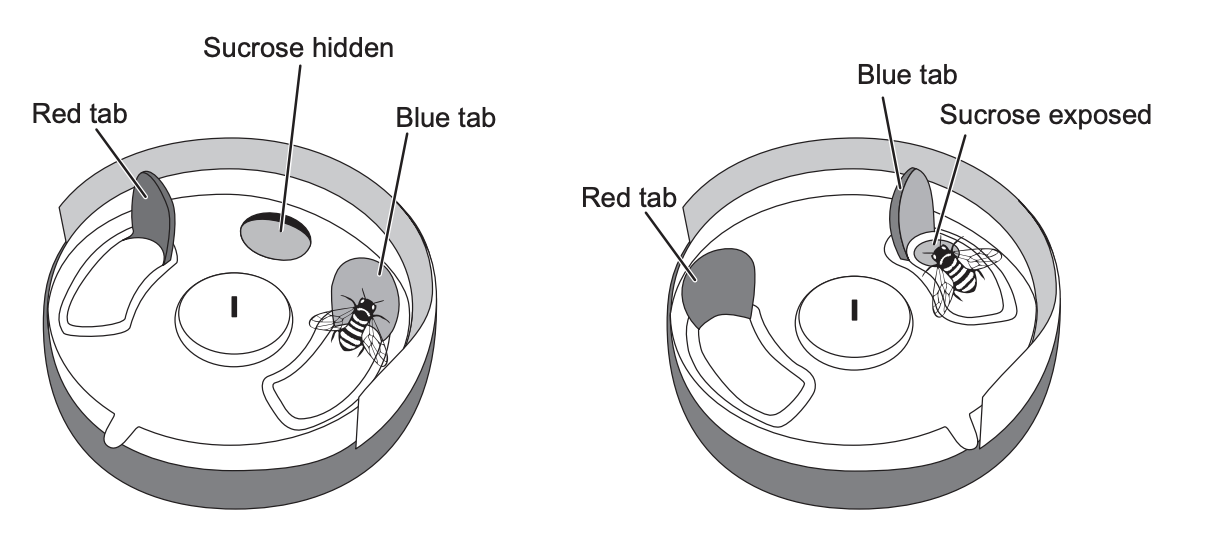
Individual trained bumblebees were then mixed with untrained bumblebees to determine if the trained ones could teach the untrained ones how to expose the sucrose solution. All groups had the same number of bumblebees.
Experimental groups:
- B: 1 bumblebee trained to open the blue tab plus untrained bumblebees
- R: 1 bumblebee trained to open the red tab plus untrained bumblebees
- C (control): no trained bumblebees, only untrained bumblebees
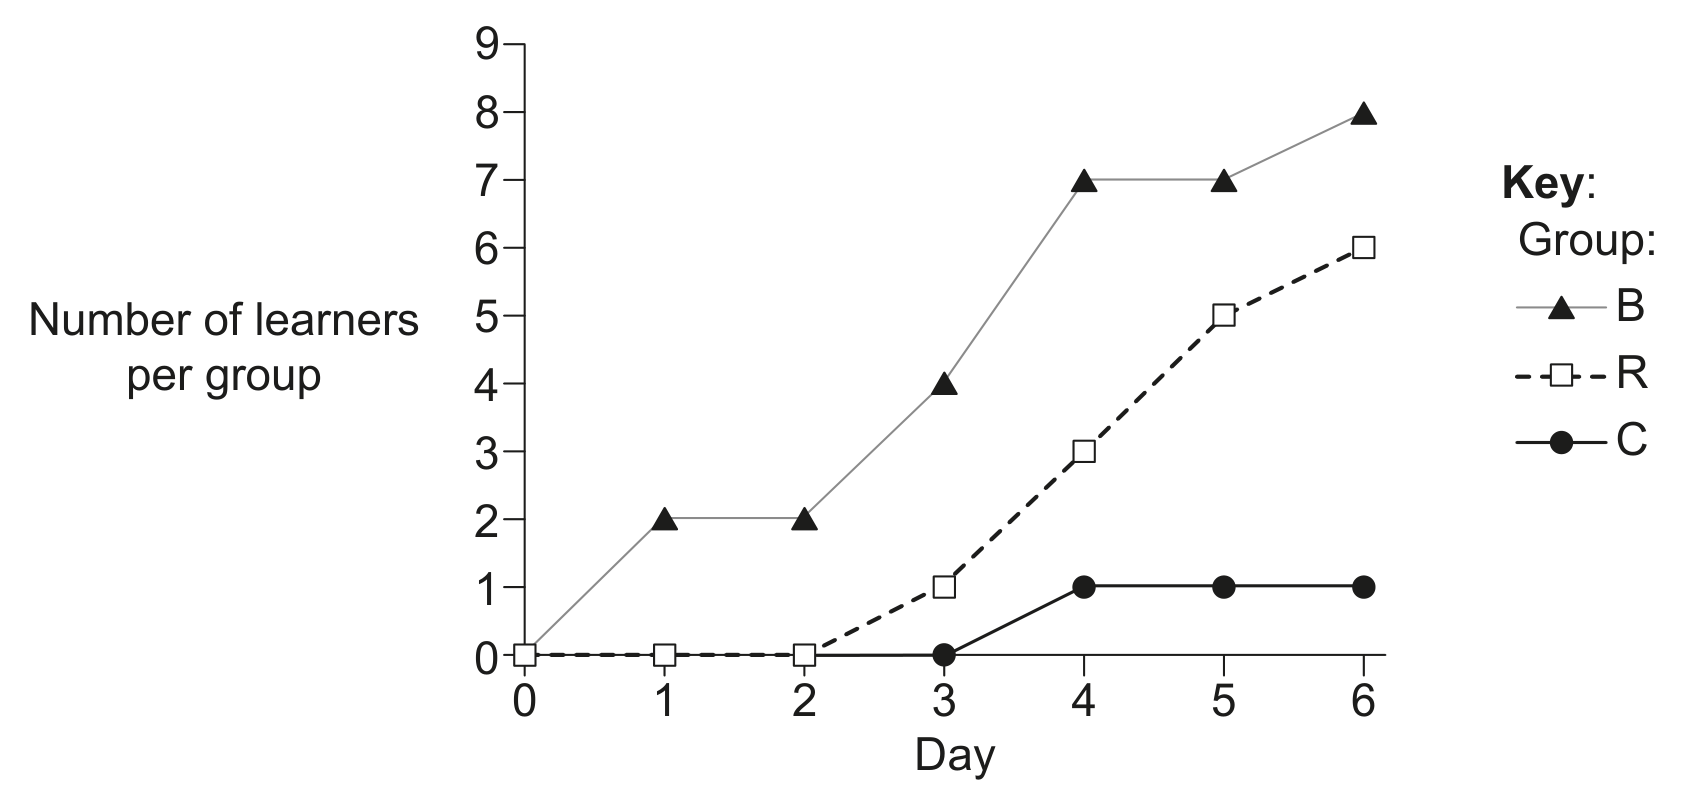
The bumblebees in each group were allowed to try and open the puzzle box. Untrained bumblebees were considered to have become "learners" when they opened the puzzle box twice.
The line graph shows the number of learners per day in the different groups.

Question image
(a)

Determine which percentage of the B+R group had an LPI of 28 or less.

[ 1 ]
[Maximum number: 1]

What does a small standard deviation signify?

A

The data is not correlated.

B

The data is widely spread around the mean.

C

The data shows a close relationship between two variables.

D

The data is clustered closely to the mean value.

[Maximum number: 1]

The lengths of a sample of tiger canines were measured. 68 % of the lengths fell within a range between 15 mm and 45 mm . The mean was 30 mm . What is the standard deviation of this sample?

A

5 mm

B

15 mm

C

7.5 mm7.5 \mathrm{~mm}

D

30 mm

[Maximum number: 1]

What is the purpose of calculating the standard deviation?

A

To represent graphically the variability of data

B

To give a measure of the spread of values around the mean

C

To represent the range of 50\% of the data

D

To give a measure of the correlation between two variables

[Maximum number: 1]

Which hypothesis can be tested using the t-test?

A

The difference in variation between two samples is not significant.

B

The difference between observed values and expected values is not significant.

C

The change in one variable is not correlated with a change in another variable.

D

The difference between the means in two samples is not significant.

[Maximum number: 1]

The mean height for adult men in the United States is 1.78 m with a standard deviation of 8 cm . Which statement is true?

A

The tallest man in the United States is 1.86 m tall.

B

68 % of men in the United States are between 1.74 m and 1.82 m tall.

C

68 % of men in the United States are between 1.70 m and 1.86 m tall.

D

100 % of men in the United States are within two standard deviations of 1.78 m .

[Maximum number: 3]

Diabetes in Youth is a study that examined diabetes (type I and type II) among children and adolescents in the United States. The graphs show the rate per year of new cases of type I and type II diabetes among young people (aged less than 20 years) by ethnicity between 2002-2005.

Question image
(a)
(i)

Compare the relative proportions of type I and type II diabetes between the different ethnic groups.

[ 2 ]
(ii)

Suggest a reason for the different rates of type II diabetes among the ethnic groups.

Skeletal muscle fibres normally respond to insulin by absorbing glucose. Failure of skeletal muscle to respond to insulin is a major factor in the development of type II diabetes. A study was undertaken to investigate the effect of plasma lipids on the process of glucose absorption in response to insulin by muscle fibers. Muscle was bathed in a lipid solution for 5 hours. The lipid was then washed out over the next 3 hours. The graph shows the level of plasma fatty acids and the activity of an enzyme involved in glucose absorption in response to insulin over the period of the study. (Values are means ± standard error)

Question image
[ 1 ]
[Maximum number: 1]

What information about sample data is shown by error bars?

A

Sample size

B

Variability

C

Mean

D

Anomalies

[Maximum number: 1]

A frog jumped 80 times and each time the length of the jump was recorded. The mean length of the jumps was 38 cm with a standard deviation of 10 cm . What can be deduced from this information?

A

The frog did not jump more than 48 cm .

B

The number of jumps more than 38 cm is the same as the number less than 38 cm .

C

Approximately 32 % of the jumps were less than 28 cm .

D

Approximately 68 % of the jumps were between 28 and 48 cm .

[Maximum number: 1]

A1. Within a cross-sectional study "Fit for Life" in Germany, the body mass index (BMI) of volunteers aged between 16 and 25 years was investigated. Volunteers were also interviewed about their daily exercise habits. The graphs below show the percentage of men and women who were overweight, and the percentage who exercised daily.

Question image
(a)

Measure the difference between the percentage of overweight men and the percentage of overweight women at age 20 .

[ 1 ]
0