EduNinja
[Maximum number: 14]

Isoprene is a chemical synthesized and emitted in large amounts by some plant species, especially oak (Quercus sp.) and poplar (Populus sp.) trees. It has been suggested that isoprene increases the tolerance of plants to high temperatures, which can cause a decrease in photosynthesis rates.

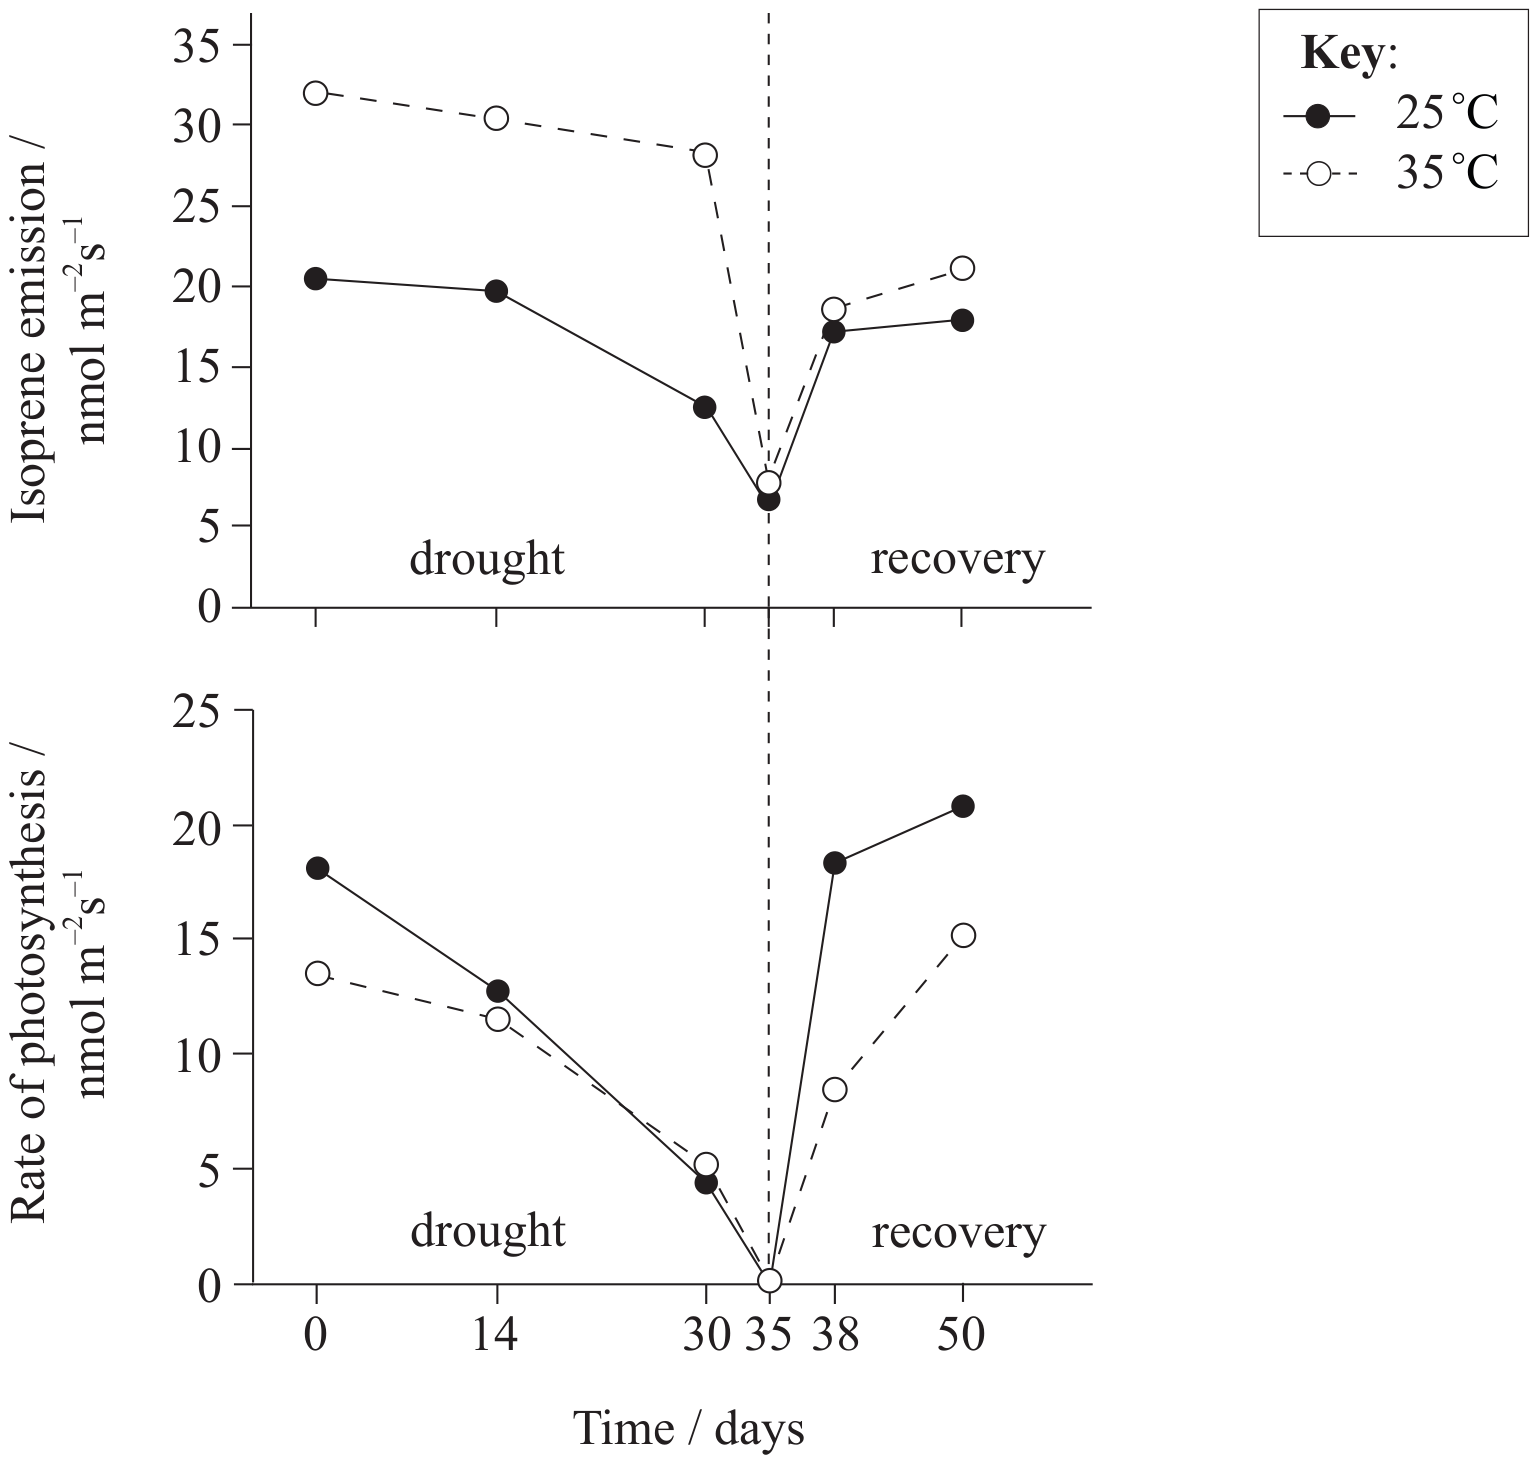
Black poplar (Populus nigra) plants were subjected to two raised temperatures and to drought. Measurements of photosynthesis and isoprene emission were made during a 35-day-long drought stress (drought period) and 3 and 15 days after re-watering stressed plants (recovery period). The rate of photosynthesis was recorded as the carbon dioxide taken up per unit of leaf area per second.

Question image
(a)

Suggest one method other than measuring CO2\mathrm{CO}_{2} uptake by which the rate of photosynthesis could have been measured in these experiments.

[ 1 ]
(b)

Suggest why heat treatment may reduce photosynthesis rates.

[ 2 ]
(c)

Outline the effect of drought and of re-watering on the rate of photosynthesis.

[ 1 ]
(d)

Describe the isoprene emissions during the drought and recovery periods at 25C25^{\circ} \mathrm{C}.

[ 2 ]
(e)

Compare the effect of the two temperatures on the emission of isoprene.
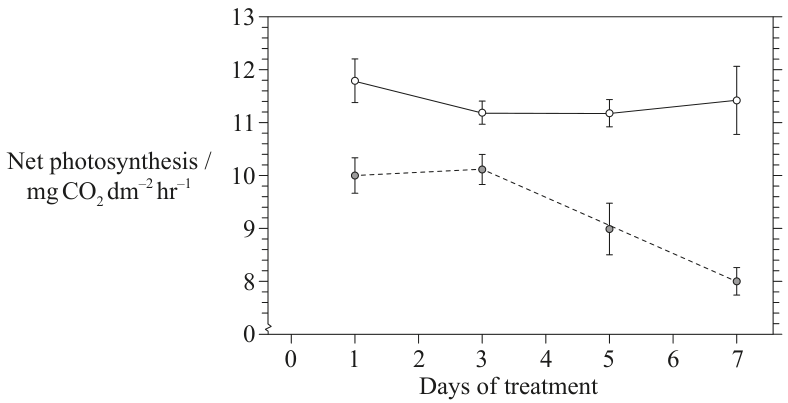
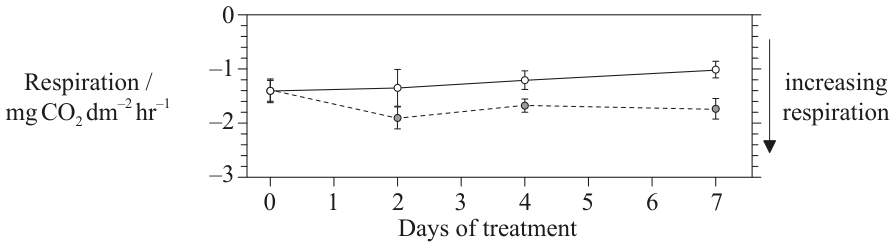
The effect of isoprene on photosynthesis was assessed in detached oak leaves that were supplied either water (control) or fosmidomycin dissolved in water. Fosmidomycin inhibits the emission of isoprene without affecting photosynthesis. The measurements were taken at 30C30^{\circ} \mathrm{C}, but at three points in the experiment the leaves were subjected to heat treatment of 46C46^{\circ} \mathrm{C} (indicated on the graph by the arrows). The rate of photosynthesis was measured as uptake of CO2\mathrm{CO}_{2} in μmolm2 s1\mu \mathrm{mol} \mathrm{m}^{-2} \mathrm{~s}^{-1}.

Question image
[ 2 ]
(f)

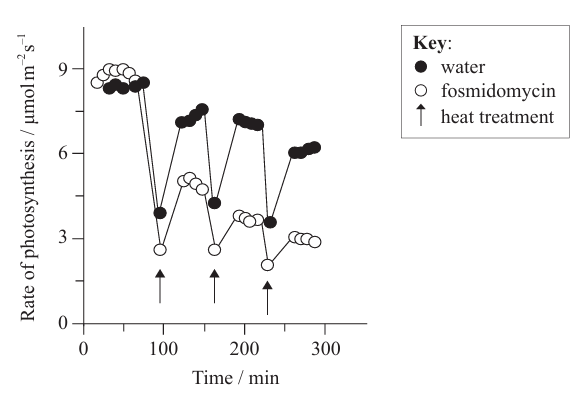
State the effect of heat treatment on the rate of photosynthesis.

[ 1 ]
(g)

State the difference in percentage recovery of photosynthesis 1 hour after heat treatment between the 22μLdm322 \mu \mathrm{Ldm}^{-3} isoprene treatment and the 0μLdm30 \mu \mathrm{Ldm}^{-3} isoprene treatment.

[ 1 ]
(h)

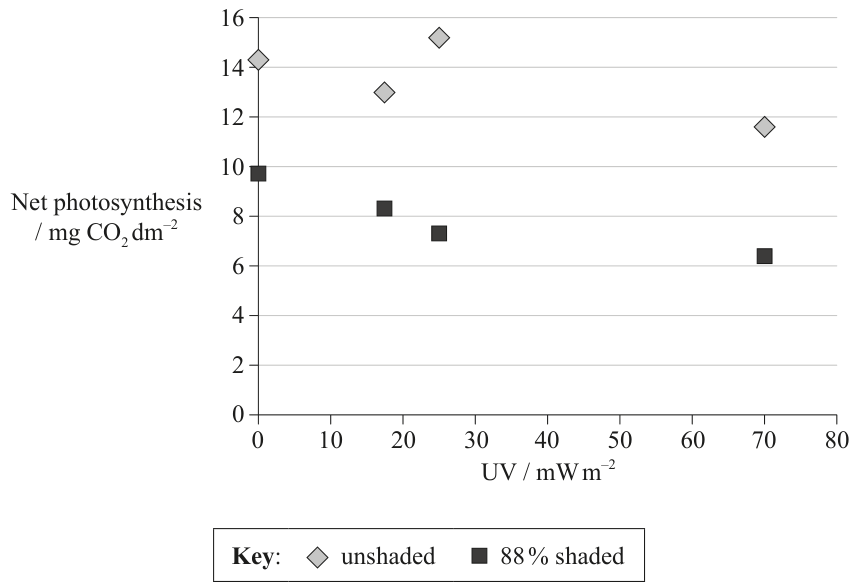
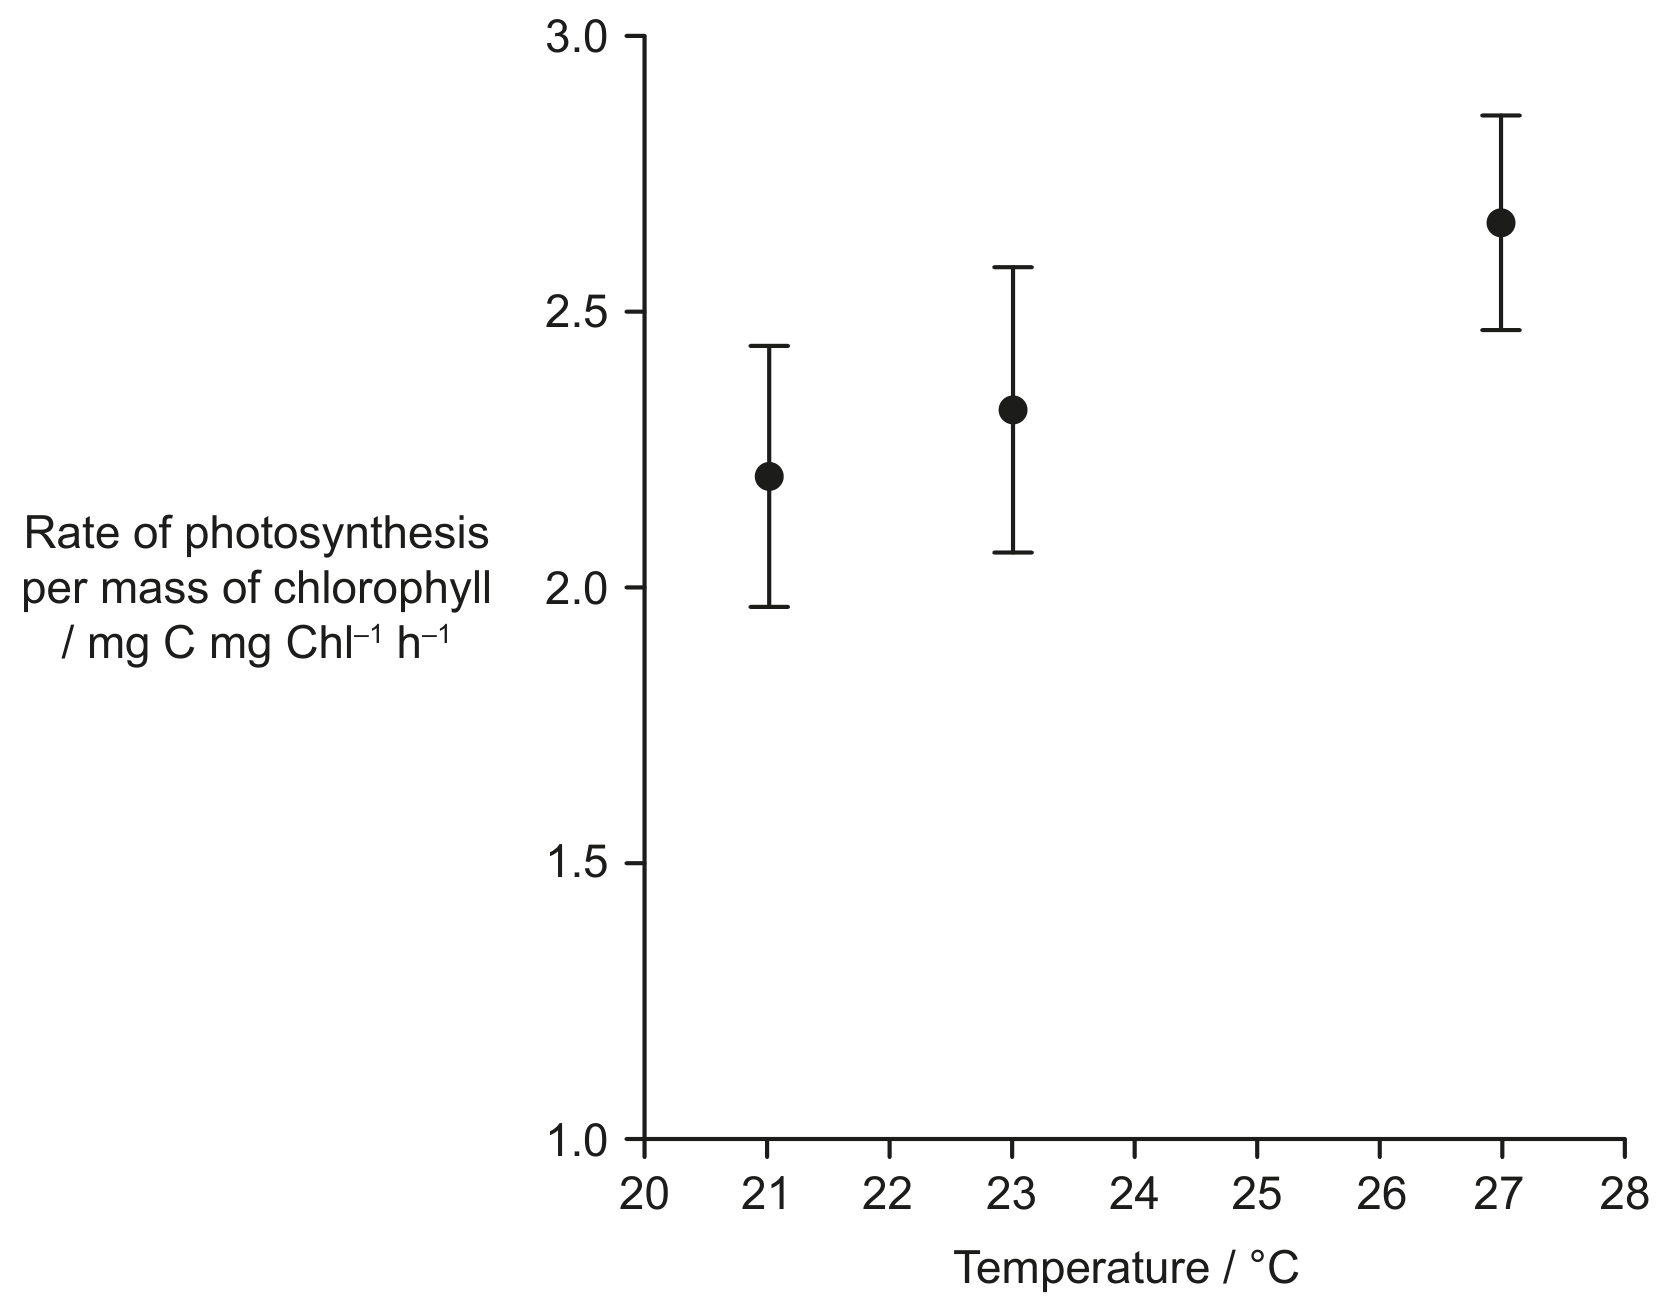
Explain the evidence provided by the data in the bar chart for the hypothesis that isoprene improves plants' tolerance to high temperatures.

[ 2 ]
(i)

Suggest two reasons for some plant species synthesizing and emitting isoprene, but not other plant species such as common beans.

[ 2 ]
[Maximum number: 9]

Ozone gas in the atmosphere helps to block high-energy ultraviolet light (UV) from reaching the Earth's surface. Over the past few decades, the ozone layer has been decreasing, thus allowing through more UV.

The effect of this decrease in the ozone has been studied in different plants. An early study was undertaken on patience dock plants (Rumex patientia) to test the effect of atmospheric ozone levels decreasing by 38 %. The net photosynthesis (total photosynthesis minus total respiration) and respiration of the plants were measured during seven days of exposure to UV. The rates of photosynthesis and respiration are given in rates of carbon dioxide uptake per unit area of leaf.

Question image
Key: -- control plants - - exposed to UV with 38 % less ozone

Key: -- control plants - - exposed to UV with 38 % less ozone

(a)

Calculate the decrease in the net photosynthesis from day 1 to day 7 in the plants exposed to UV. Workings should be shown and units given.

[ 1 ]
(b)

Distinguish between the results for the plants exposed to UV and the controls without UV in

[ 2 ]
(i)

net photosynthesis.

[ 2 ]
(c)

The rate of photosynthesis can be measured by the rate of carbon dioxide uptake.

State two other ways that the rate of photosynthesis may be measured.

Some recent measurements indicate a 60 % thinning of the ozone layer in some parts of the atmosphere.

[ 2 ]
(d)

Predict the possible effect on R. patientia plants.

[ 2 ]
(e)

Another study was undertaken to investigate the cumulative effects of different levels of UV over a six week period on net photosynthesis in soybean (Glycine max). One set of plants was in full sunlight (unshaded) and the other set received only 12 % of full sunlight ( 88 % shaded). UV was given using lamps above all of the plants.

Question image

Compare the results of the unshaded and shaded plants.

[ 2 ]
[Maximum number: 2]

Sockeye salmon (Oncorhynchus nerka) spend the first years of their lives in the freshwater lakes of Alaska before migrating to marine waters. Their first months in marine waters are spent foraging and growing near the shore line. They then move to offshore regions of the North Pacific Ocean for 2 to 3 years.

Question image

The graph shows fork length frequency of juvenile O. nerka caught during their first months in marine waters in autumn 2008 and ocean age one O. nerka caught 15 months later during winter 2009 in the North Pacific Ocean.

Question image
Table
(a)

Outline any correlation between total lipid content and fork length in autumn 2008 and in winter 2009.

Autumn 2008:

Winter 2009:

[ 2 ]
[Maximum number: 6]

RfR_{\mathrm{f}} values for photosynthetic pigments may be determined using the technique of thin-layer chromatography (TLC).

Question image
(a)

Outline what happens when spinach extract is spotted on a TLC plate and placed into a container of solvent.

[ 2 ]
(b)

Explain what the RfR_{\mathrm{f}} values represent in chromatography.

[ 3 ]
(c)

State two photosynthetic pigments that could be identified using chromatography.
1.
2.

[ 1 ]
[Maximum number: 5]

Chromatography is a technique used to separate the components of a mixture. The photosynthetic pigments from three organisms were separated by thin layer chromatography: spinach (Spinacia oleracea), a red alga (Porphyra) and a brown alga (Fucus).

Spinacia oleracea

Spinacia oleracea

Porphyra

Porphyra

Fucus

Fucus

(a)

Identify a pigment found in all three organisms.

[ 1 ]
(b)

Compare and contrast absorption spectra and action spectra.

[ 2 ]
(c)

Porphyra also contains phycoerythrin, which is a red pigment.

[ 2 ]
(i)

Suggest a reason for phycoerythrin being absent from the Porphyra chromatogram.

[ 1 ]
(ii)

Predict one colour of light that will be absorbed efficiently by phycoerythrin.

[ 1 ]
[Maximum number: 8]

A variegated Pelargonium plant was grown outdoors in a plant pot. Figure 1 shows one leaf of the Pelargonium. The plant was left in the dark for 24 hours to inhibit photosynthesis. After this time, a sketch was made of the leaf to show the colours (Figure 2), then part of the leaf was covered with black card (Figure 3). Following the exposure of the plant to sunlight for six hours, the black card was removed and the leaf tested for starch (Figure 4).

Question image
(a)

Outline a reason for inhibiting photosynthesis for 24 hours.

[ 1 ]
(b)
(i)

Identify which two areas, W, X, Y or Z , in Figure 4 show that light is required for photosynthesis.

[ 1 ]
(ii)

Identify which two areas, W, X, Y or Z , in Figure 4 show that chlorophyll is required for photosynthesis.

[ 1 ]
(iii)

Discuss briefly whether the detection of starch in this experiment was proof that photosynthesis had occurred in the leaf.

[ 2 ]
(c)
(i)

Using the axes, sketch the action spectrum for photosynthesis in the green area of the leaf in Figure 1.

Question image
[ 1 ]
(ii)

Predict how the action spectrum from the white areas of the leaf would differ from the green areas.

[ 1 ]
(d)

Suggest reasons that plants with variegated leaves are rarely found growing wild naturally.

[ 1 ]
[Maximum number: 2]

A community living in the water of an estuary was used to investigate how climate change may affect ecological systems. The food web in this community included phytoplankton (producers), zooplankton (consumers) and saprotrophic bacteria. Small plastic mesocosms were set up with water from the estuary containing only these three groups of organisms. The mesocosms were subjected to four different temperatures and two nutrient levels (control and nutrients added) to replicate local variations of the conditions in the estuary during springtime warming.

The graph shows the biomass of the community for each of the eight mesocosms at the end of the experimental period. Biomass was measured in terms of the amount of carbon present. The horizontal line indicates the initial biomass.

Question image
(a)

Chlorophyll concentration was used as an estimate of the photosynthetic capacity of the community. The rate of photosynthesis and mass of chlorophyll per unit volume were measured in a mesocosm at three different temperatures.

Question image

Explain the effect of temperature on the rate of photosynthesis in this mesocosm.

[ 2 ]
[Maximum number: 1]

An experiment on aerobic respiration was performed using a plant in a pot containing fertile soil. The apparatus was set up as shown in the diagram. Sodium hydroxide and limewater (calcium hydroxide) are both alkaline solutions. Limewater goes cloudy when carbon dioxide is bubbled into it.

Question image
(a)

The same apparatus was used in another experiment, but the potted plant was exposed to light. Predict with a reason the results for lime water in flask C after one hour.

[ 1 ]
[Maximum number: 1]

The graph shows the effect of light intensity on the rate of photosynthesis of a green plant at different CO2\mathrm{CO}_{2} concentrations. The temperature is kept constant at 25C25^{\circ} \mathrm{C}.

Question image

What is the limiting factor at × ?

A

Chlorophyll

B

CO2\mathrm{CO}_{2} concentration

C

Temperature

D

Light intensity

[Maximum number: 1]

The graph shows the rate of photosynthesis as light intensity increases at two different carbon dioxide ( CO2\mathrm{CO}_{2} ) concentrations.

Question image
Question image

What are the limiting factors of photosynthesis at regions X and Y on the graph?

X

Y

CO2\mathrm{CO}_{2} concentration

light intensity

temperature

light intensity

light intensity

CO2\mathrm{CO}_{2} concentration

light intensity

temperature

0