EduNinja
[Maximum number: 4]

White clover (Trifolium repens) is native to Eurasia but is now a common plant found worldwide in lawns, next to roads, in pastures and similar habitats.

Question image

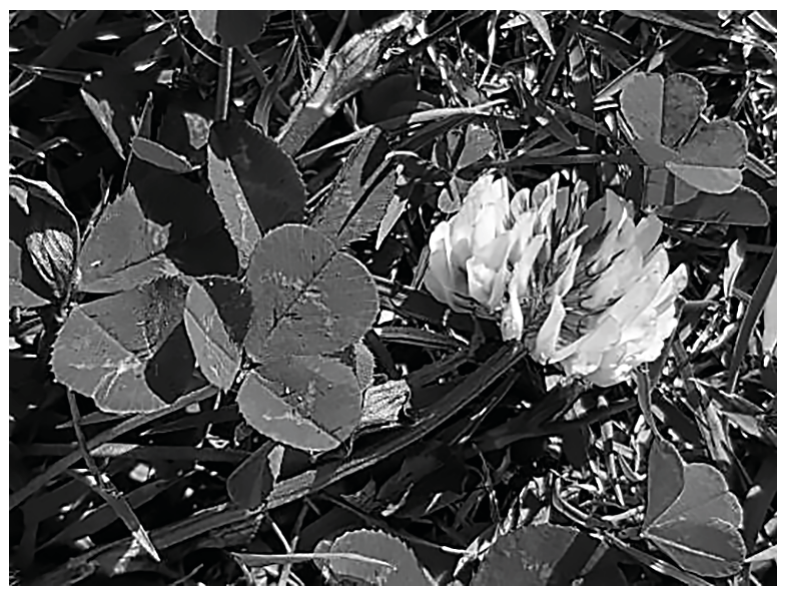
Some T. repens plants are able to produce the toxin hydrogen cyanide (HCN) by cyanogenesis. A study at 128 sites ( 2509 plants) in Toronto (Canada) looked at the proportion of T. repens plants producing HCN. The sites were at regular intervals from the city centre towards rural areas.

Question image
(a)
(i)

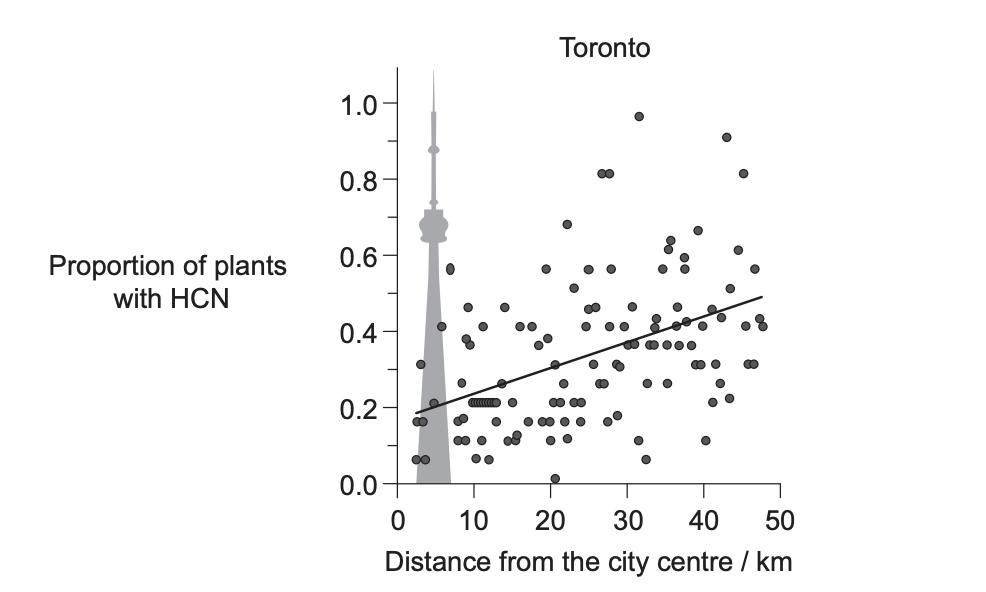
State the distance from the city centre at which the highest proportion of plants sampled contained HCN.

[ 1 ]
(ii)

Outline the relationship shown in the graph.

To determine whether similar patterns in cyanogenesis were seen in other cities, studies were also carried out around New York City and Boston (USA) and Montreal (Canada).

Question image
[ 1 ]
(b)

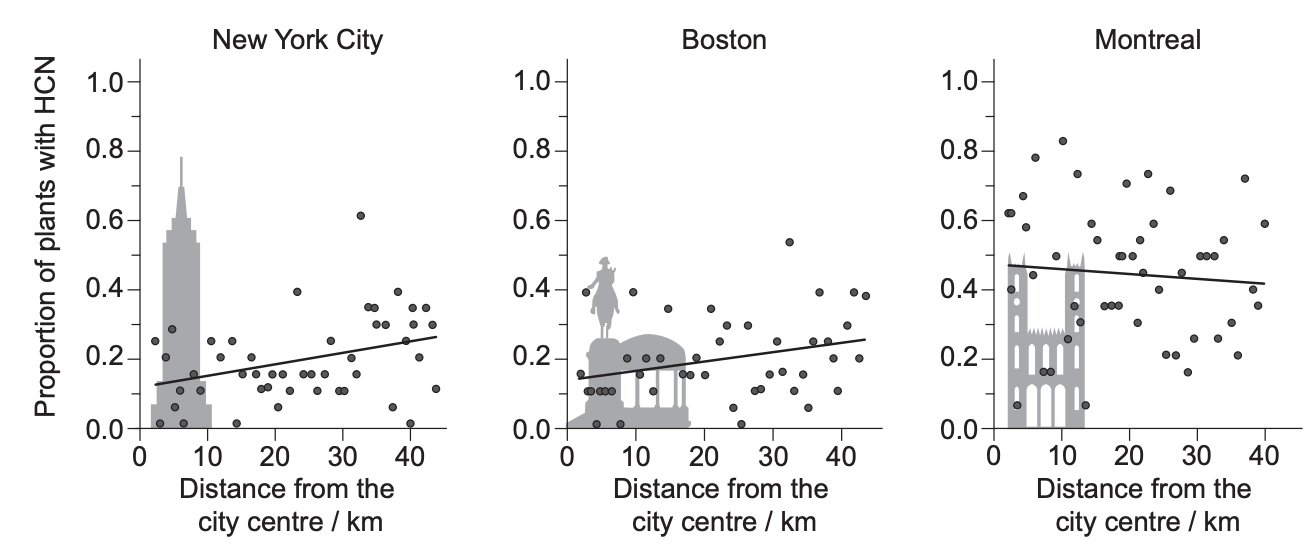
Deduce whether the pattern of cyanogenesis was the same in all of the areas around all four cities.

[ 2 ]
[Maximum number: 1]

The incidence of white syndrome, an infectious disease of coral, was investigated in a six-year study on Australia's Great Barrier Reef. The map shows disease conditions on coral reefs at six study sites.

Question image
(a)

This study was carried out over six years on the Australian Great Barrier Reef. State one advantage of field investigations compared with mesocosm experiments to study ecological processes.

[ 1 ]
[Maximum number: 3]

Honeybees (Apis mellifera) are key pollinators in most ecosystems. The worldwide use of neonicotinoid pesticides has caused concern because they may be contributing to the decline of honeybee populations.

Scientists measured the concentration of five neonicotinoids (acetamiprid, clothianidin, imidacloprid, thiacloprid and thiamethoxam) in honey samples from 198 different locations across the world. Each pie chart shows the relative frequency of neonicotinoids in honey samples from a continent.

Question image
(a)

Identify in which continent the fewest types of neonicotinoid were detected in honey samples.

[ 1 ]
(b)

Using the data, outline the different use of thiamethoxam in North and South America.

[ 1 ]
(c)

The neonicotinoids can be used alone or together with other neonicotinoids. The percentage of honey samples with 0,1,2,3,4 or 5 different neonicotinoids in each continent are shown in the stacked bar chart.

Question image

Identify the total percentage of honey samples contaminated with neonicotinoid pesticides in the continent with the lowest overall levels of contamination.

[ 1 ]
[Maximum number: 2]

A community living in the water of an estuary was used to investigate how climate change may affect ecological systems. The food web in this community included phytoplankton (producers), zooplankton (consumers) and saprotrophic bacteria. Small plastic mesocosms were set up with water from the estuary containing only these three groups of organisms. The mesocosms were subjected to four different temperatures and two nutrient levels (control and nutrients added) to replicate local variations of the conditions in the estuary during springtime warming.

The graph shows the biomass of the community for each of the eight mesocosms at the end of the experimental period. Biomass was measured in terms of the amount of carbon present. The horizontal line indicates the initial biomass.

Question image
(a)

The first study used mesocosms and the second study was carried out in natural grassland. Discuss the use of mesocosms as opposed to a study in a natural environment.

[ 2 ]
[Maximum number: 5]

The biodiversity of insects worldwide is in decline. Destruction of habitats, pollution and climate change have contributed to the decline in global insect populations and to the extinction of insect species. A comprehensive literature review was carried out to determine the annual global rate of decline in insect species. The graph shows the results for three major orders of terrestrial insects and the total decline in insect biomass worldwide.

Question image
(a)

State the mean annual decline in insect biomass.

[ 1 ]
(b)

Compare and contrast the results for Hymenoptera and Lepidoptera.

[ 2 ]
(c)

Calculate the number of Coleoptera species that would be expected to exist after one year from a starting number of 400000 species, assuming the mean rate of decline.

[ 1 ]
(d)

The graph shows the percentage of bumblebees that survived each day while being fed on different P:L diets. For each trial, n=15.

Key:

Key:

...
100\% protein 50:1 25:1 10:1 5:1 1:1 1:5 1:10

State the relationship between high lipid content and survivability on day 7.

[ 1 ]
[Maximum number: 6]

There is growing evidence of a decrease in bee populations. This decrease is a serious problem because of their valuable role as pollinators in the ecosystems where they live. Neonicotinoid pesticides have been implicated in this decrease because they have been found at trace levels in the nectar and pollen of crop plants and in the bee colonies.
Scientists placed colonies of a species of bumblebee, Bombus terrestris, in the laboratory to test the effects of different levels of a neonicotinoid on their development. They divided the colonies into three groups:
- The control colonies were given a solution of water and sugar that resembled nectar produced by flowers.
- A second group of colonies was given the same sugar solution containing a neonicotinoid dissolved in it at low concentrations, similar to those found in nature.
- A third group of colonies was given the same sugar solution containing a neonicotinoid dissolved in it at high concentrations, similar to those found in nature.

After two weeks, all colonies were placed in the field to allow the bumblebees to feed naturally.

(a)
(i)

Compare and contrast the cumulative increase in mass of the three groups of colonies once they were placed in the field.

[ 2 ]
(ii)

Suggest a reason for the changes in mass in the colonies between weeks 6 and 8.

[ 1 ]
(b)

The number of queen bumblebees produced in each colony was recorded. New bumblebee colonies are started by a queen.

Question image

Using the data in the graph, predict how the use of neonicotinoid pesticides will affect bumblebee populations.

[ 3 ]
[Maximum number: 7]

Common shrews (Sorex araneus) are small mammals found in Northern Europe. Their diet includes insects, slugs, spiders, worms and amphibians. They do not hibernate in winter because their bodies are too small to store sufficient fat reserves.

Question image

To study brain size in shrews, researchers anesthetize them, X-ray their skulls and measure the height of the braincase (BCH) where the brain is located. The graph shows the relationship between BCH and the brain mass of individual adult shrews.

Question image
(a)

State the relationship between BCH and brain mass of shrews.

[ 1 ]
(b)

Outline how the shrew labelled P differs from the normal relationship between BCH and brain mass.

[ 1 ]
(c)

Shrews were observed in different seasons and the time they spent on a particular activity was recorded and expressed as a percentage of the total observation time. The circles in the kite shapes represent the mean value of time for each activity.

Question image

State the activity and season that occupied the greatest mean percentage of observation time.

[ 1 ]
(d)

Suggest a reason for the difference in the time observed eating and drinking.

[ 2 ]
(e)

The researchers were interested in the seasonal differences in searching for food. They set up a square arena with sides of 110 cm and four entrances (A, B, C and D). Containers were placed in the arena, some with food and others with no food. The diagram shows a top-down view of the arena.

Question image

Each shrew was starved of food for two hours before its cage was opened at one of the entrances to the arena. The length of the path taken by the shrew to obtain food was measured. This was standardized by dividing the path length by the straight-line distance from the entrance to the containers with food. Each shrew was used for 10 trials.

The graph shows the standardized mean path length taken by all the shrews at different seasons of the year. The letters show where the cages were placed for each trial.

Question image

Calculate the percentage of containers that contained food.

[ 1 ]
(f)

Outline a reason that the path length was standardized

[ 1 ]
(a)

1. There is increasing interest in the bacteria that live in the human gut, known as the gut microbiota. Evidence is accumulating of widespread effects on human health, with some species of bacteria increasing the prevalence of specific diseases and others giving protection.

Long-term diet appears to influence the numbers and types of bacteria that are present in an individual's gut. Several different characteristic combinations of bacteria (called enterotypes) have been discovered. The stacked column graph shows relative amounts of different genera of bacteria in the gut of people with four of these enterotypes. The Bacteroides 2 (B2) enterotype is associated with an increased prevalence of inflammatory bowel disease.

Question image

Using the data in the stacked column graph, describe the features that characterize the B2 enterotype.

[ 2 ]
(b)

Samples of feces were collected from 40 individuals and were immediately frozen to preserve them. The numbers of bacteria in the feces (cell counts /1011/ 10^{11} cells g1\mathrm{g}^{-1} ) were later measured and the enterotype was determined. The box plot shows this data. Each data point shows the cell count from one fecal sample.

Question image

Estimate the median number of bacterial cells per gram of feces in the R enterotype.

[ 1 ]
(c)

Distinguish between the cell counts in the R and B2 enterotypes.

[ 2 ]
(d)

Comment on the data for the P enterotype.

[ 1 ]
(e)
(i)

Statins are drugs that are commonly prescribed to reduce cholesterol concentrations in the blood. As part of research into the effects of statins, the enterotype and body mass index (BMI) of 782 individuals were determined. The results are shown in the stacked graph.

Question image

Key:
B1 = Bacteroides 1
P = Prevotella
R = Ruminococcaceae
B2 = Bacteroides 2

Estimate the prevalence of the P enterotype at a BMI of 50.

[ 1 ]
(ii)

State the relationship between BMI and the prevalence of the B 2 enterotype.

[ 1 ]
(f)

Evaluate the evidence provided by the data in the graph for the hypothesis that the R enterotype causes low BMI.

[ 2 ]
(g)

The 782 individuals for whom BMI and enterotype had been determined were divided into four groups, according to whether or not they were taking statins and their BMI category. The prevalence of the four enterotypes in each of these groups is shown as a percentage in the pie charts.

Question image

The prevalence of inflammatory bowel disease rises with increases in BMI. At any BMI level, individuals with the B2 enterotype have a higher prevalence of inflammatory bowel disease than with other enterotypes. Using the data in the graph, discuss whether statins could reduce the incidence of inflammatory bowel disease.

[ 2 ]
[Maximum number: 4]

According to the UN Inter-agency Group for Child Mortality Estimation, in the year 2000 there were 9.82 million deaths of children under the age of 5 . Many of these deaths were caused by infectious diseases. The pie chart shows estimates for the percentages of deaths that were attributable to two of the most frequent pathogens, Streptococcus pneumoniae and Haemophilus influenzae.

Question image
(a)

Calculate the number of deaths in children under the age of 5 that were attributed to S. pneumoniae in the year 2000.

[ 1 ]
(b)

Acute respiratory infection (ARI) is a frequent reason for antibiotic use among children in low-income and middle-income countries (LMICs). S. pneumoniae is the predominant, but not the only, cause of ARI in children.

In a large-scale study, data were collected in 18 LMICs from 65815 children under the age of 5 . The data were analysed to estimate the fraction of ARI cases among the children that could be attributed to S. pneumoniae as shown in the graphs.

The upper estimate in the graphs is for all cases, whether or not they were treated with antibiotics. The lower estimate is for the subset of cases that required antibiotic treatment.

The range of estimates is shown by violin plots, with a point for the median estimate and lines for 95 % confidence intervals.

Question image

Using the data in the violin plots, deduce the age range at which children are most likely to develop ARI due to S. pneumoniae.

[ 2 ]
(c)

Estimates were made of the extent of antibiotic use in low-income and middle-income countries. Graphs were constructed to show global estimates for the numbers of cases in LMICs per year of ARI treated with antibiotic in children under the age of 5 . The estimates for LMICs were divided according to income: low income, lower-middle income and upper-middle income.

The graph shows estimates for three levels of vaccination for S. pneumoniae with PCV:
- no vaccination
- 2018 coverage: the vaccine coverage that there was in 2018
- universal coverage: predictions assuming that in the future all children in all LMICs receive the vaccination.

Question image

When there is no vaccination, the estimated number of cases for lower-middle income countries is larger than in either low income or upper-middle income countries. Suggest one reason for this.

[ 1 ]
[Maximum number: 3]

Type II diabetes, a widespread and challenging health problem, is due to insulin resistance, which results in raised blood glucose. Alpha-glucosidase enzymes catalyse the hydrolysis of carbohydrates. Inhibition of the enzymes slows the absorption of glucose in the intestine and thus slows the rise in blood glucose. A study examined the inhibitory effect of five species of seaweed (Palmaria palmata, Saccharina latissima, Fucus vesiculosus, Ascophyllum nodosum and Alaria esculenta) on alpha-glucosidase. Dried seaweed extracts made with water or ethanol were added to maltose. The solutions were incubated, then analysed for glucose content.

The graph shows percent inhibition of alpha-glucosidase with different seaweed extracts compared with uninhibited enzyme activity (control).

Question image
(a)

Calculate the greatest increase in mean body mass over 11 weeks.

[ 1 ]
(b)

Distinguish between the results for S. Iatissima and P. palmata.

Glycated hemoglobin (HbA1c) is formed when glucose in blood plasma binds spontaneously to hemoglobin. A high percentage of HbA1c indicates that glucose levels in the blood have been raised for much of the time.

At the beginning of the investigation, after 8 hours without food, blood was taken from all the mice and tested for HbA 1 c levels. The levels were similar for all mice. The graph shows the levels of HbA1c after 10 weeks of treatment with the seaweed extracts.

Question image
[ 2 ]
0