EduNinja
[Maximum number: 10]

Tufted ducks (Aythya fuligula) are found in lakes and lagoons throughout Europe. They eat molluscs, insects and plants, sometimes from the surface but mostly by diving under the water. The graph shows how the heart rate of a tufted duck changes when diving under the water.

Question image
(a)

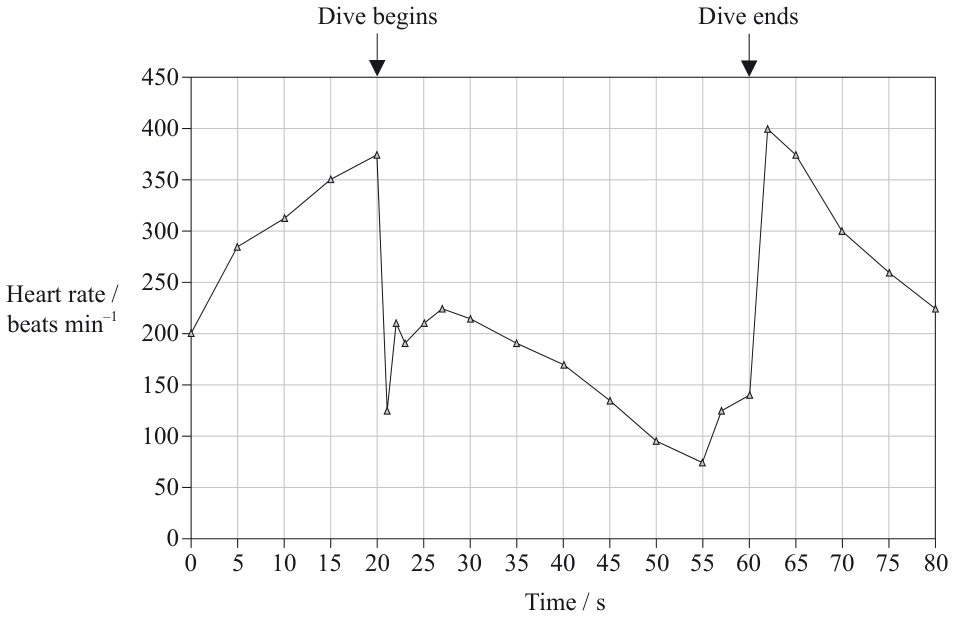
State the length of time the tufted duck was under the water.

[ 1 ]
(b)

Outline the changes in the heart rate during the dive.

[ 2 ]
(c)

When swimming on the surface, the blood supply to different parts of the body of the tufted duck varies according to whether it is swimming at normal speed or maximum speed.

Question image

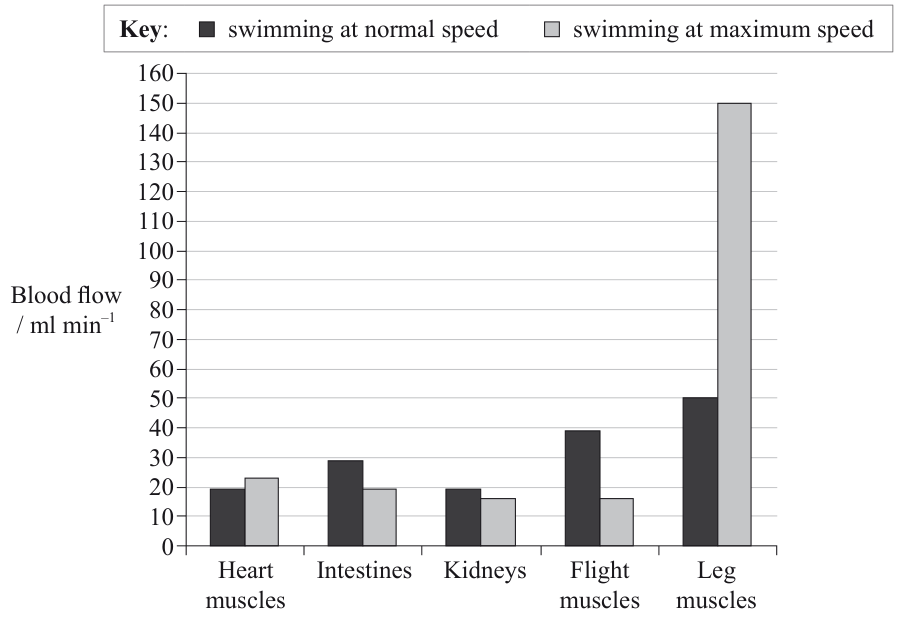
Calculate the percentage increase in blood flow to the leg muscles when the tufted duck changes from swimming at normal speed to swimming at maximum speed.

[ 1 ]
(d)

Compare the blood flow to the heart muscles with the blood flow to the flight muscles when changing from swimming at normal speed to swimming at maximum speed.

[ 2 ]
(e)

Explain the changes in blood flow that occur when swimming at maximum speed.

[ 2 ]
(f)

Predict, with reference to both graphs, what would happen to the blood flow to the heart muscles when the tufted duck is diving.

[ 2 ]
[Maximum number: 4]

Hypertension (blood pressure exceeding 140 mmHg ) affects millions of people worldwide. Many modern societies consume more sodium in the form of salt (NaCl) than is required for normal physiology. The effect of changing the levels of dietary sodium has been studied in various organisms.

Scientists recorded the blood pressure changes in chimpanzees (Pan troglodytes) fed a diet without added sodium (control) or a sodium supplemented diet (experimental) as follows
- 5 grams of salt per day from December 1991 until May 1992
- 10 grams of salt per day until June 1992
- 15 grams of salt per day until August 1993
after which no more salt was added to the diet until the experiment ended.

Question image
(a)

Outline the effect shown in the graph of increasing the sodium in the diet of chimpanzees.

[ 2 ]
(b)

Blood pressure is measured in the arteries. Explain how arteries are adapted to withstand increases in blood pressure.

[ 2 ]
[Maximum number: 4]

Consumption of dark chocolate has been shown to have health benefits. A study was undertaken to see the effects of epicatechin (Epi), a substance in dark chocolate, on the aerobic capacity of leg muscles of mice.

A group of adult mice was used to measure the effects of a low dose of Epi given over 15 days. The mice were divided into four groups and given either water or Epi and were either kept idle (no exercise) or made to exercise on a treadmill.

After 15 days, the results were analysed. The blood capillary density in leg muscle was measured under the light microscope.

Question image
(a)
(i)

Outline the trends in capillary density in the results of this experiment.

[ 2 ]
(b)

Describe how increased capillary density could affect the aerobic capacity of muscle.

[ 2 ]
[Maximum number: 1]

Phytoremediation is the use of plants to extract and remove contaminants or lower their bioavailability (amount available to organisms) in soil. Tree species are used because they have deep root systems and fast growth rates that enable them to take up contaminants in larger amounts than plants such as grasses. The diagram shows the steps in phytoremediation in plants.

Question image

A study in North Carolina, USA, used different tree species for phytoremediation of groundwater contaminated by leaked petrochemicals. Four types of hybrid poplar clones (Populus sp.), loblolly pine (Pinus taeda) and willow (Salix sp.) were planted from 2006 to 2008, and measurements were made of trees in 2010 and 2012. The graph shows percent survival of hybrid poplar clones, loblolly pine and willow trees on the phytoremediation site.

Question image
(a)

Removal of excess soil water increases oxygen levels in the soil. Suggest how this may be beneficial in soil phytoremediation.

In the same study, the levels of TPH (total petroleum hydrocarbons) and BTEX (benzene, toluene, ethylbenzene and xylene) present in the soil of contaminated areas were measured each winter and summer from 2007 to 2013 before and after planting trees.

Question image
[ 1 ]
[Maximum number: 6]

In an investigation to compare the elasticity of arteries and veins, rings of the same diameter (20 mm)(20 \mathrm{~mm}) of artery and vein tissue were cut from blood vessels obtained from a mammal.

Question image

Each ring was attached to a clamp. Multiple masses of 10 g were added and removed. The vertical diameter of the artery and the vein was measured, both with the mass and once the mass had been removed.

Question image

The results are shown in the table.

Diameter of vein / mmDiameter of artery / mm
Mass / gWith massMass removedWith massMass removed
020202020
1026262622
2034333023
3038363523
4040373824
(a)

State the independent and dependent variables in this experiment.

Independent:
Dependent:

[ 2 ]
(b)

State one feature of the rings that has to be kept constant apart from their initial diameter.

[ 1 ]
(c)

Explain the differences between the results shown for vein and artery.

[ 3 ]
[Maximum number: 6]

In an investigation to compare the elasticity of arteries and veins, rings of the same diameter (20 mm)(20 \mathrm{~mm}) of artery and vein tissue were cut from blood vessels obtained from a mammal.

Question image

Each ring was attached to a clamp. Multiple masses of 10 g were added and removed. The vertical diameter of the artery and the vein was measured, both with the mass and once the mass had been removed.

Question image

The results are shown in the table.

Table
(a)

State the independent and dependent variables in this experiment.

Independent:
Dependent:

[ 2 ]
(b)

State one feature of the rings that has to be kept constant apart from their initial diameter.

[ 1 ]
(c)

Explain the differences between the results shown for vein and artery.

[ 3 ]
[Maximum number: 1]

The micrograph shows a section of an organ in the human body.

Question image
(a)

One of the functions of this organ is absorption. On the micrograph, draw an arrow showing the direction of absorption.

[ 1 ]
[Maximum number: 2]

The image shows a severed aphid stylet embedded in plant tissue.

(a)

Identify the tissue labelled II.

Question image
[ 1 ]
(b)

Outline one piece of evidence that the tissue labelled I is phloem tissue.

[ 1 ]
[Maximum number: 7]

A leafy shoot was cut from a plant and connected to a potometer to measure the transpiration rate. The length of the air column in the glass tube was measured using the ruler.

Question image
(a)

Describe how the apparatus could be used to demonstrate that the transpiration rate is affected by air movement.

[ 3 ]
(b)

One criticism of the experiment is that it only measured the rate of transpiration indirectly. Explain how the experiment is an indirect measurement of transpiration.

[ 2 ]
(c)

Red dye was added to the water in the potometer. A cross section of the stem was observed under the light microscope.

Question image
[ 2 ]
(i)

Label with an R the tissue where the red dye would appear.

[ 1 ]
(ii)

Label with a C the tissue where organic compounds are transported.

[ 1 ]
(a)

Evaluate the benefits of reducing dietary cholesterol in lowering the risk of coronary heart disease.

[ 2 ]
0