EduNinja
[Maximum number: 6]

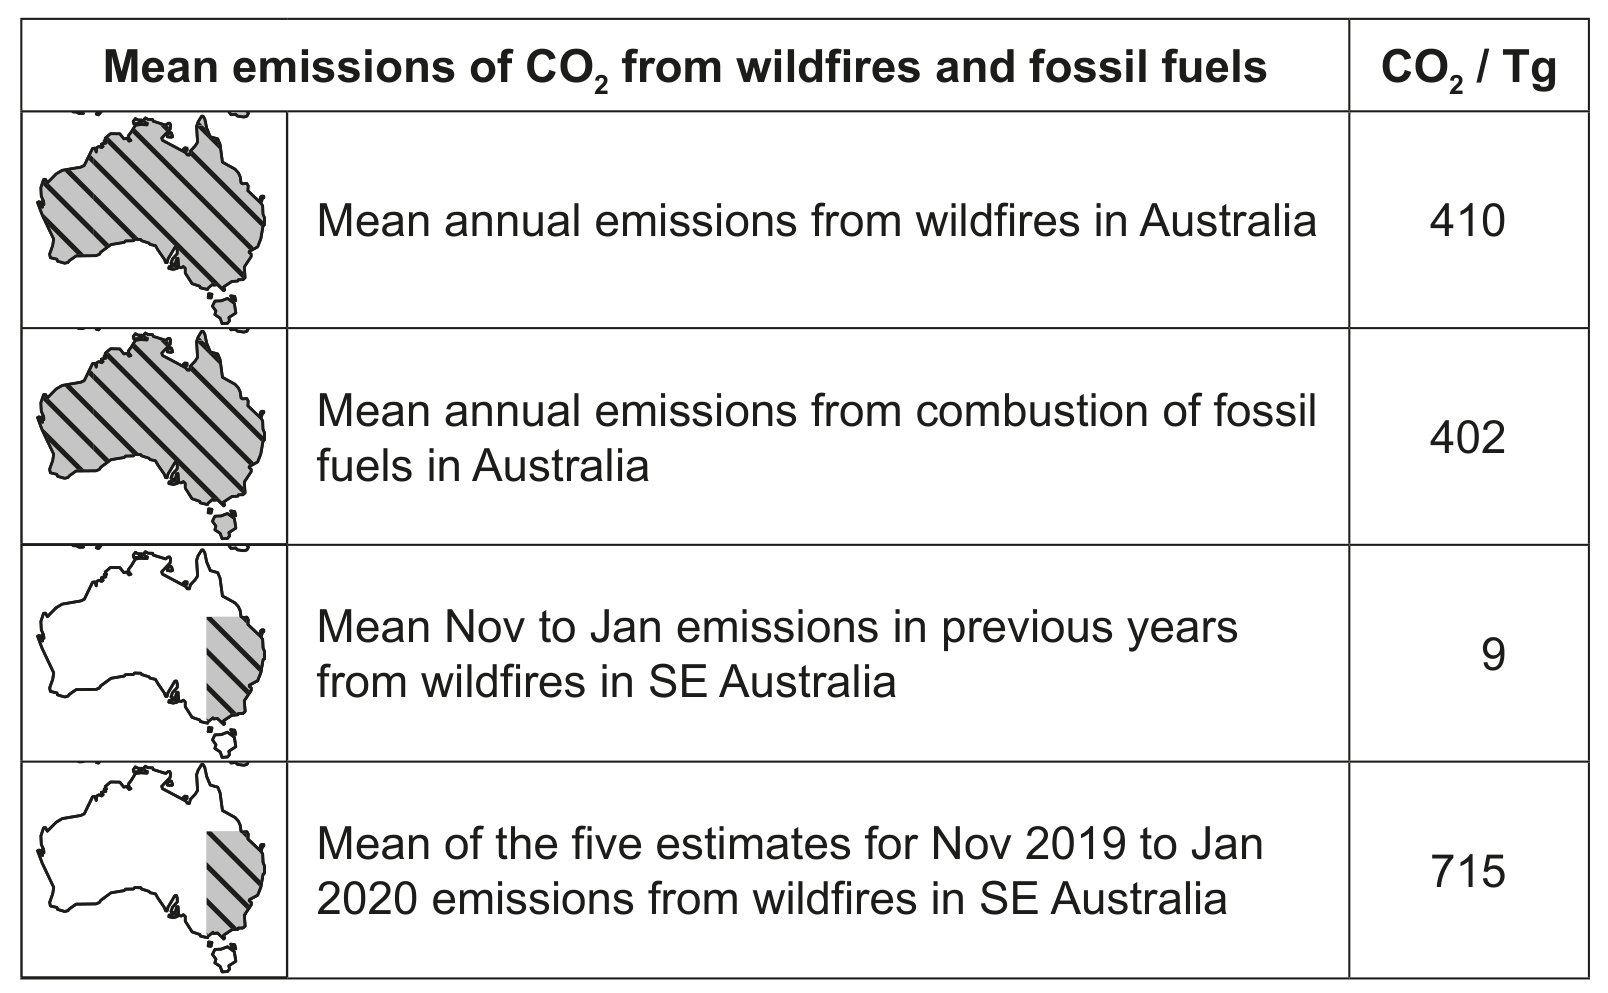
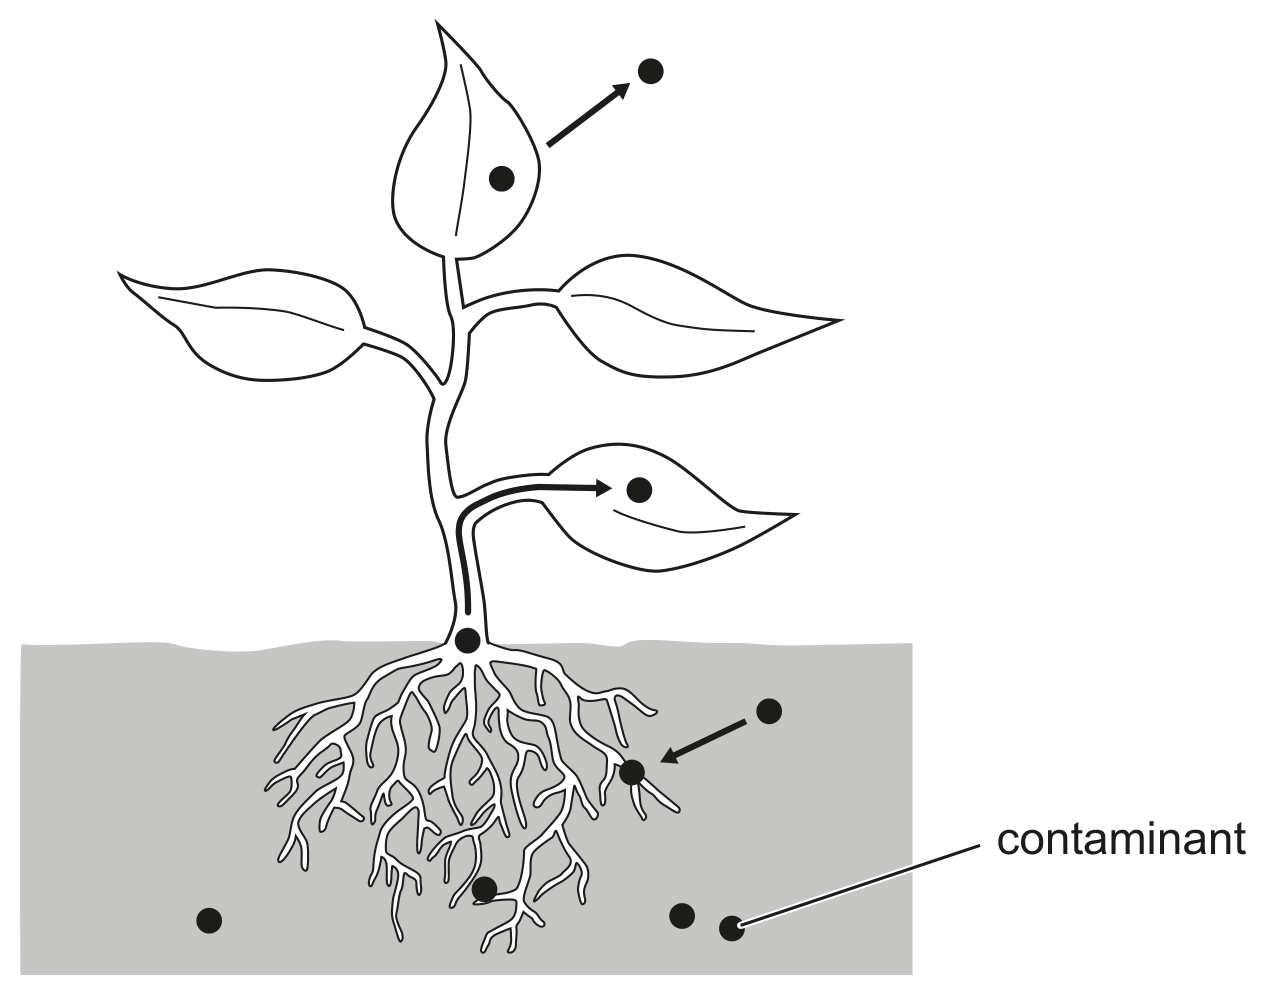
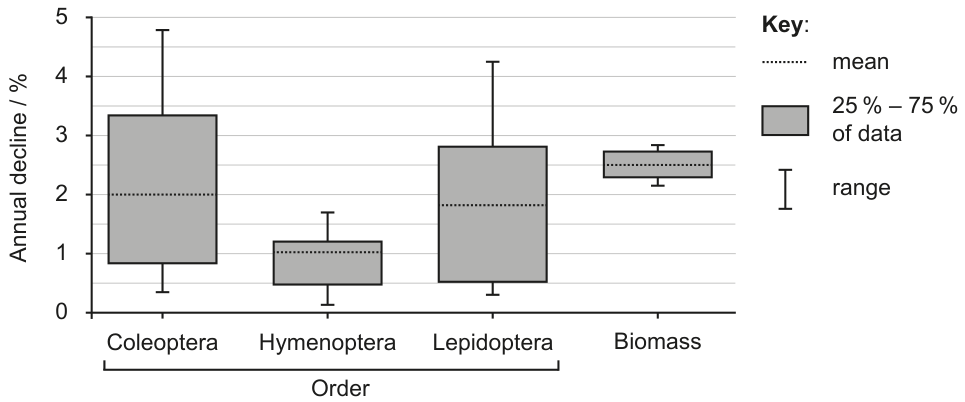
The biodiversity of insects worldwide is in decline. Destruction of habitats, pollution and climate change have contributed to the decline in global insect populations and to the extinction of insect species. A comprehensive literature review was carried out to determine the annual global rate of decline in insect species. The graph shows the results for three major orders of terrestrial insects and the total decline in insect biomass worldwide.

Question image
(a)

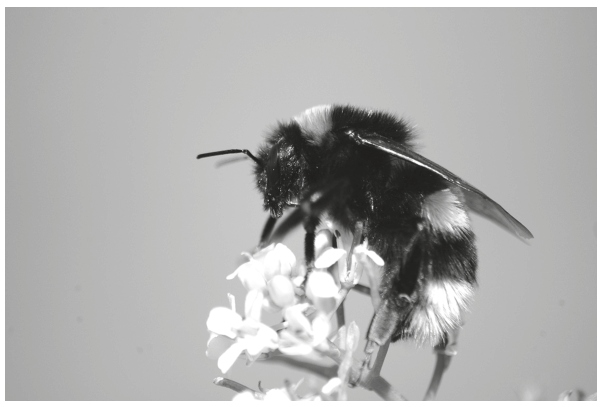
One species of the order Hymenoptera is the buff-tailed bumblebee (Bombus terrestris), which feeds on pollen and nectar obtained from specific plants.

Question image

Destruction of preferred habitats has affected the size of bumblebee populations and for survival, bumblebees have to feed on pollen from other available plant habitats. To simulate different pollens, researchers fed bumblebees on eight diets consisting of a mixture of proteins and lipids in different ratios (P:L). The bumblebees also had access to sucrose. There was no restriction on the amount of each food the bumblebees could consume. The chart shows the mean daily mass of food eaten for eight diets with different P:L ratios.

Question image

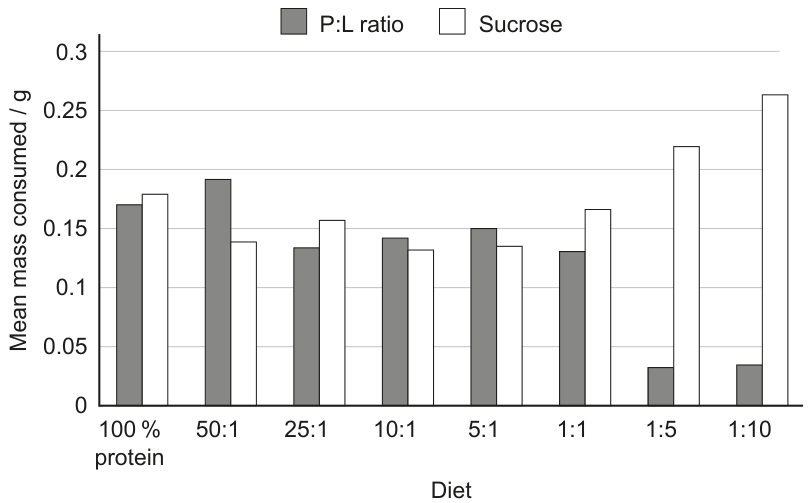
Identify in how many of the diets sucrose was the greatest mass of food consumed.

[ 1 ]
(b)

Compare and contrast the results for the 1:1 and the 1:10 P:L diets.

[ 2 ]
(c)

Suggest with a reason which P: L diet is closest to the normal diet of these bumblebees.

[ 1 ]
(d)

Discuss whether these studies show that habitat destruction can affect global bumblebee numbers.

[ 2 ]
[Maximum number: 7]

Remote sensing satellites are used to monitor the Earth's ecosystems. One measure of ecosystem status is leaf area index (LAI), which is the total area of leaves in square metres per square metre ( m2 m2\mathrm{m}^{2} \mathrm{~m}^{-2} ) of the Earth's surface. The graph shows LAI estimates, calculated using data from the Global Inventory Monitoring and Modelling System (GIMMS), during the period from 1981 to 2011. The data points are monthly averages in four latitudinal zones in the northern hemisphere.

Question image
(a)

The data in the graph show a long-term trend in global LAI.

[ 2 ]
(i)

Global ecosystem modelling suggests that most of the change in LAI is due to increases in atmospheric carbon dioxide. Explain how rising atmospheric carbon dioxide ( CO2\mathrm{CO}_{2} ) concentration could cause the observed change in LAI.

[ 2 ]
(b)

The 2015 Paris Agreement sets out an international framework for avoiding dangerous climate change. A key aspect is conserving and enhancing sinks of greenhouse gases, including forests.

Free air carbon dioxide enrichment (FACE) experiments are being used to investigate whether increases in atmospheric CO2\mathrm{CO}_{2} concentration will cause biomass increases in existing forests. Three FACE experiments have been running for at least ten years in young, developing forests. Photosynthesis rates are measured in 25 to 30 m diameter plots. In control plots, carbon dioxide concentrations remain at current atmospheric levels (ambient CO2). In treatment plots, the CO2 concentration is raised by 50 % (elevated CO2\mathrm{CO}_{2} ).

The table gives some details of these experiments and the highest annual net primary production recorded during the period of the experiment. Net primary production is the mass of carbon absorbed and fixed by photosynthesis in plants that is not released due to plant respiration.

Question image

State the effect of elevated CO2\mathrm{CO}_{2} on net primary production in these young, developing forests.

[ 1 ]
(c)

Outline one benefit of conducting similar FACE experiments in multiple locations.

In each forest, there are two or three trial plots per CO2 treatment. The bar chart shows the allocation of carbon from net primary production to different parts of the trees in these trial plots.

Question image
[ 1 ]
(d)

In each forest, there are two or three trial plots per CO2 treatment. The bar chart shows the allocation of carbon from net primary production to different parts of the trees in these trial plots.

Question image

Evaluate the evidence from the bar chart that increases in carbon dioxide cause increases in carbon storage in young, developing forests.

[ 3 ]
[Maximum number: 13]

There were widespread and intense wildfires in Southeast Australia during the summer season from November 2019 to January 2020. Estimates have been made of carbon dioxide emissions from these fires based on satellite monitoring data. The bar chart shows estimates made by five different research programmes: GFED, GFAS, QFED, FEER and FINN.

Question image

The table shows other statistics for comparison.

Table

2019-2020 constrained by satellite. Nature (597), pp. 366-369. https://doi.org/10.1038/s41586-021-03712-y.]

(a)

The highest estimate of CO2\mathrm{CO}_{2} emitted from wildfires in Southeast Australia between November 2019 and January 2020 is 820 Tg , from the FEER research programme. State the lowest estimate.

Programme:
Estimate:

[ 1 ]
(b)

Using the data in the table, comment on the magnitude of the wildfires in Southeast Australia from November 2019 to January 2020.

In addition to carbon dioxide, carbon monoxide and other gases, the wildfires emitted smoke. Smoke is an aerosol of solid particles and liquid droplets suspended in air. The complex mixture of chemicals in this aerosol includes black carbon (soot) and compounds of nitrogen, phosphorus and iron. This aerosol absorbs light, allowing its optical density and movement to be assessed by satellite monitoring.

Much of the smoke from the wildfires in Southeast Australia in 2019-2020 was carried eastwards across the South Pacific Ocean. The study area shown in the map was affected by the smoke.

Question image

Australian wildfires. Nature (597), pp. 370-375. https://doi.org/10.1038/s41586-021-03805-8.]

The graph shows the optical density of the air and the chlorophyll concentrations of the water in this study area. The concentration of chlorophyll is proportional to the density of phytoplankton (photosynthetic bacteria and algae) in the water.

Daily measures of aerosol optical density (AOD)
8-day mean chlorophyll concentration in 2019-2020

Key:

Key:

[ 3 ]
(c)

Identify two differences between aerosol optical density (AOD) in the months before the wildfires and during the period of wildfires.

[ 2 ]
(d)

Using the data in the graph, distinguish between phytoplankton populations in 2019-2020 and in previous years.

Samples of air carrying the aerosol from the wildfires were filtered at Mount Wellington on Tasmania, and the amounts of iron and levoglucosan on the filters were measured.
Levoglucosan is produced by combustion of carbohydrates such as starch and cellulose, so is used as a chemical tracer for biomass burning.

Bars on the graph show amounts of levoglucosan, and datapoints show amounts of iron.

Question image
[ 3 ]
(e)

Explain the conclusions that can be drawn from the data in the graph.

[ 2 ]
(f)

In the South Pacific Ocean, chlorophyll production and growth of phytoplankton are usually limited by a low concentration of iron in the water. Suggest a hypothesis for the cause of the unusual pattern of phytoplankton growth during the summer of 2019-2020.

[ 2 ]
[Maximum number: 1]

Fish play a key role in the functioning of temperate shallow lakes. They affect nutrient cycles and interactions between trophic levels. Studies were done to compare fish community structure and dynamics between shallow lakes in Denmark (temperate) and in Uruguay (subtropical).

The following organisms were found in one of these lakes:
- macrophytes - large aquatic plants
- zooplankton - microscopic animals
- piscivorous fish (eat other fish)
- algae - aquatic plants
- omnivorous fish (eat plants and animals)
- planktivorous fish (eat plankton)
- phytoplankton - microscopic plants
- herbivorous fish (eat plants)

(a)
(i)

Suggest one way that fish can increase the nutrient content in shallow lakes.

[ 1 ]
[Maximum number: 5]

Phytoremediation is the use of plants to extract and remove contaminants or lower their bioavailability (amount available to organisms) in soil. Tree species are used because they have deep root systems and fast growth rates that enable them to take up contaminants in larger amounts than plants such as grasses. The diagram shows the steps in phytoremediation in plants.

Question image

A study in North Carolina, USA, used different tree species for phytoremediation of groundwater contaminated by leaked petrochemicals. Four types of hybrid poplar clones (Populus sp.), loblolly pine (Pinus taeda) and willow (Salix sp.) were planted from 2006 to 2008, and measurements were made of trees in 2010 and 2012. The graph shows percent survival of hybrid poplar clones, loblolly pine and willow trees on the phytoremediation site.

Question image
(a)

Calculate the percentage change in BTEX from February 2007 to July 2013.

[ 1 ]
(b)

Determine with evidence from the bar chart which type of contaminant is removed at a greater rate from the soil between February 2007 and August 2007.

Dioxane is another environmental contaminant that is difficult to remove from contaminated sites. Hybrid poplar cuttings (Populus deltoides x nigra) were grown. Once they had rooted, seven cuttings were transferred to individual reactors, as shown in the diagram. Five cuttings were as shown and two were controls. One control had the leaves removed, and the stem and roots of the other control were not immersed in the nutrient solution. The concentration of dioxane that remained in the nutrient solution was measured daily.

Question image
Question image
[ 1 ]
(c)

Using all the data, evaluate the use of trees in phytoremediation.

[ 3 ]
[Maximum number: 1]

Albatrosses (belonging to the Family Diomedeidae) are large marine birds that can live for up to 50 years and feed at the highest trophic level. They have a very large wing span (up to 3 m ) and can use winds to travel long distances over water while foraging for food at sea. However, their survival and reproduction are threatened by both climate change and accidental death. This may be caused by being caught in the lines or nets of commercial fishing vessels that are in their foraging areas.

A 31-year study analysed population data of three different species: the wandering albatross (Diomedea exulans), the grey-headed albatross (Thalassarche chrysostoma) and the black-browed albatross (T. melanophris). All three species breed in colonies on the same island in the Antarctic.

(a)

Krill are tiny marine crustaceans that have a very important role in the Antarctic food chains. Krill are a major source of food for many marine species, including whales, seals, fish and albatrosses. The graph shows the survival of adult grey-headed albatross related to krill density between 1996 and 2011.

Question image
[ 1 ]
(i)

Calculate the percentage increase in krill density from 1996 to 2002.

[ 1 ]
[Maximum number: 2]

Common bottlenose dolphins, Tursiops truncatus, are marine mammals of temperate and tropical oceans throughout the world, where they feed on fish, squid and crustaceans.

Research has been carried out on a population of these dolphins in Sarasota Bay, Florida. The table shows the mean sea surface temperature in Sarasota Bay and catch per unit effort (CPUE) in winter and summer. A large CPUE indicates it would take little effort for the dolphin to catch a lot of prey.

Table
(a)
(i)

Calculate the difference between summer and winter sea surface temperatures.

[ 1 ]
(ii)

Calculate summer CPUE as a percentage of winter CPUE.
\%

[ 1 ]
[Maximum number: 3]

Freshwater mussels are molluscs found in rivers and lakes worldwide. They filter water for food and remove algae, bacteria and detritus, improving the water quality.

Question image

Researchers in South Korea placed mussels (U. douglasiae) in water containing cyanobacteria, a type of photosynthetic bacteria that cause eutrophication of rivers and lakes. The density of cyanobacteria is proportional to the concentration of chlorophyll in the water. The filtration rate by mussels can be determined by measuring the change in concentration of chlorophyll at various time intervals. The experiments were conducted with two different levels of dissolved oxygen in the water (DO). In the control experiment, no mussels were present and the DO level was 9.0mgL19.0 \mathrm{mg} \mathrm{L}^{-1}.

Question image

Key:
- DO 0.5mgL10.5 \mathrm{mg} \mathrm{L}^{-1}
- DO 9.0mgL19.0 \mathrm{mg} \mathrm{L}^{-1}
- Control

(a)

Suggest a reason for the change in the chlorophyll concentration of the control during the experiment.

[ 1 ]
(b)

Using all the data, deduce with reasons whether the water quality of the River Thames changed from 1964 to 2020.

[ 2 ]
[Maximum number: 2]

Male Lepidoptera (butterflies and moths) commonly drink from pools of water or from moist soil. This behaviour, called puddling, was investigated in an undisturbed area where male tiger swallowtails, Papilio glaucus, had been seen puddling.

Four successive sets of experiments were performed under similar conditions of temperature and humidity. In each set, equal samples of sand were spread out evenly on trays and then treated differently. Except for one dry sample (in the first set), all others were saturated with a different liquid. Results of the observations are given in the table below.

Question image
(a)

Identify the dissolved element always present in the three samples with most puddling time.

[ 1 ]
(b)

Suggest one reason for puddling behaviour in male Lepidoptera.

[ 1 ]
[Maximum number: 1]

The grey partridge (Perdix perdix) is a species of bird that is found on farmland. Sparrowhawks (Accipiter nisus) and buzzards (Buteo buteo) are birds of prey that kill and feed on birds, including grey partridge. The number of grey partridges in a region of southern England was monitored from 1970 to 2004. The numbers of sparrowhawks and buzzards, seen from sampling positions during regular observation periods, were counted. The results are shown in the graph below.

Question image
(a)

Suggest a conservation measure that would be most likely to prevent the extinction of grey partridges from southern England.

[ 1 ]
0