EduNinja
[Maximum number: 2]

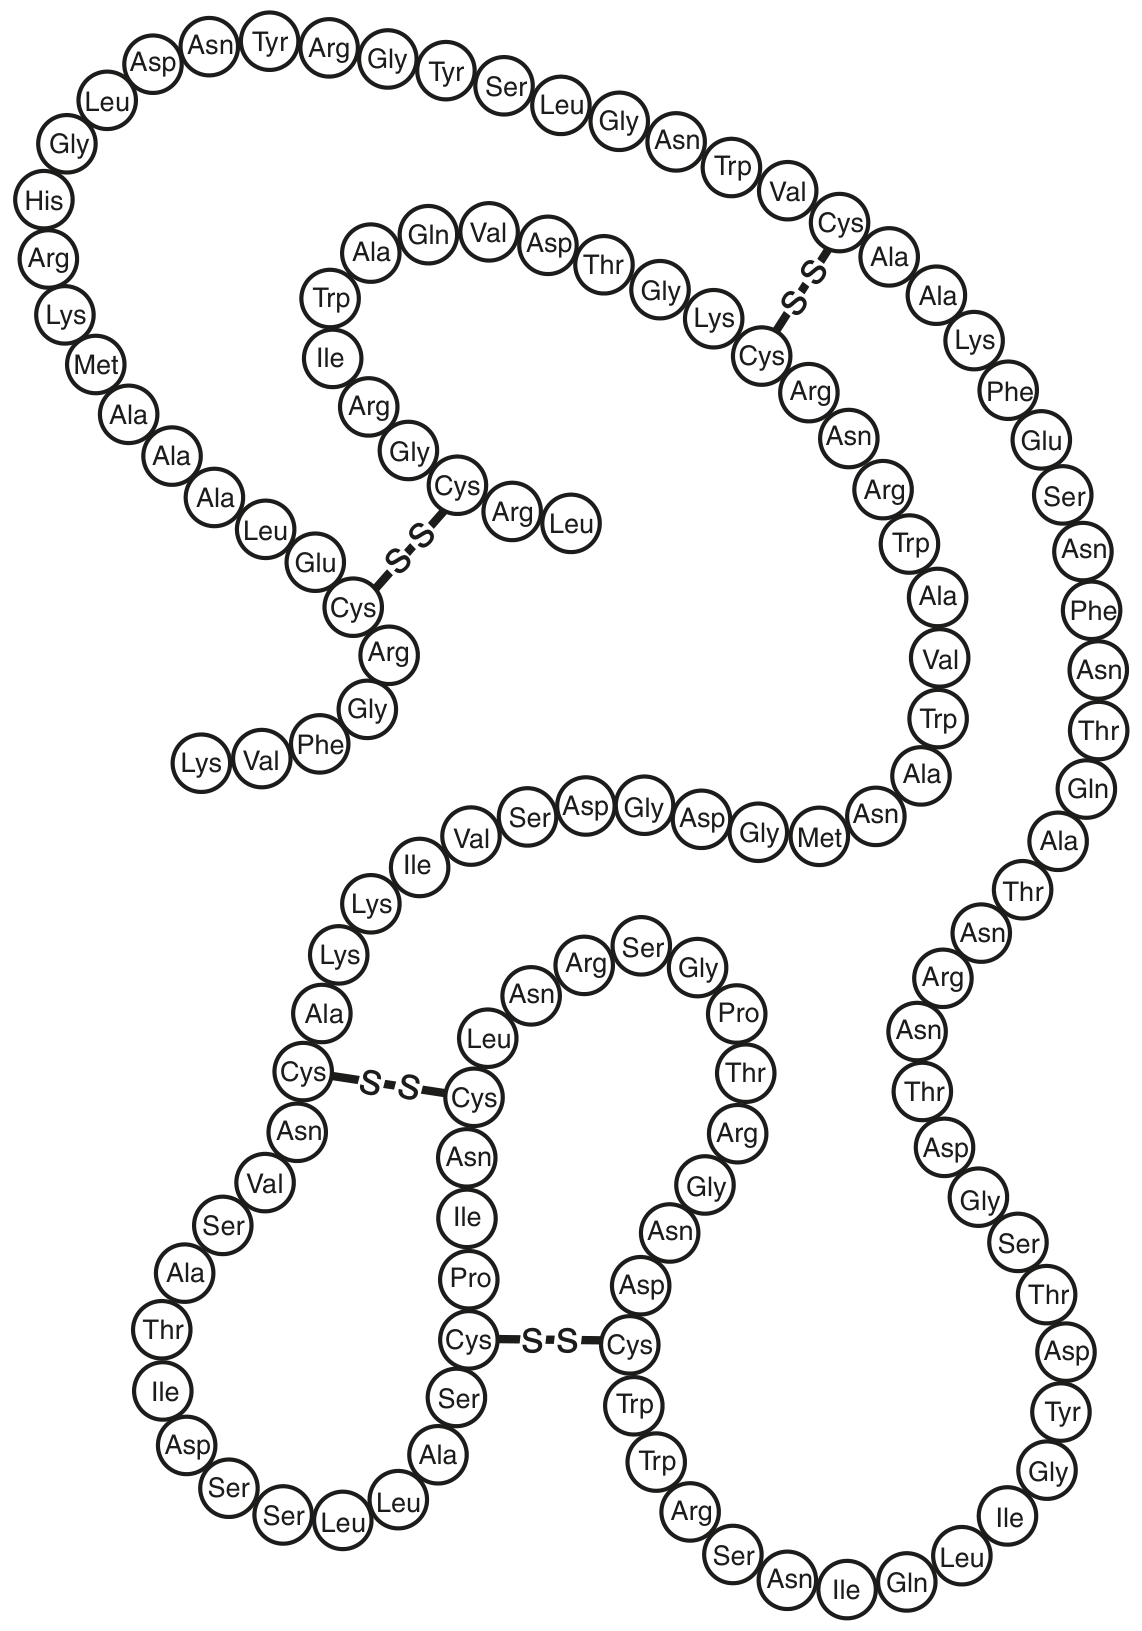
Phosphatases are enzymes that catalyse the removal of phosphate groups from organic compounds.

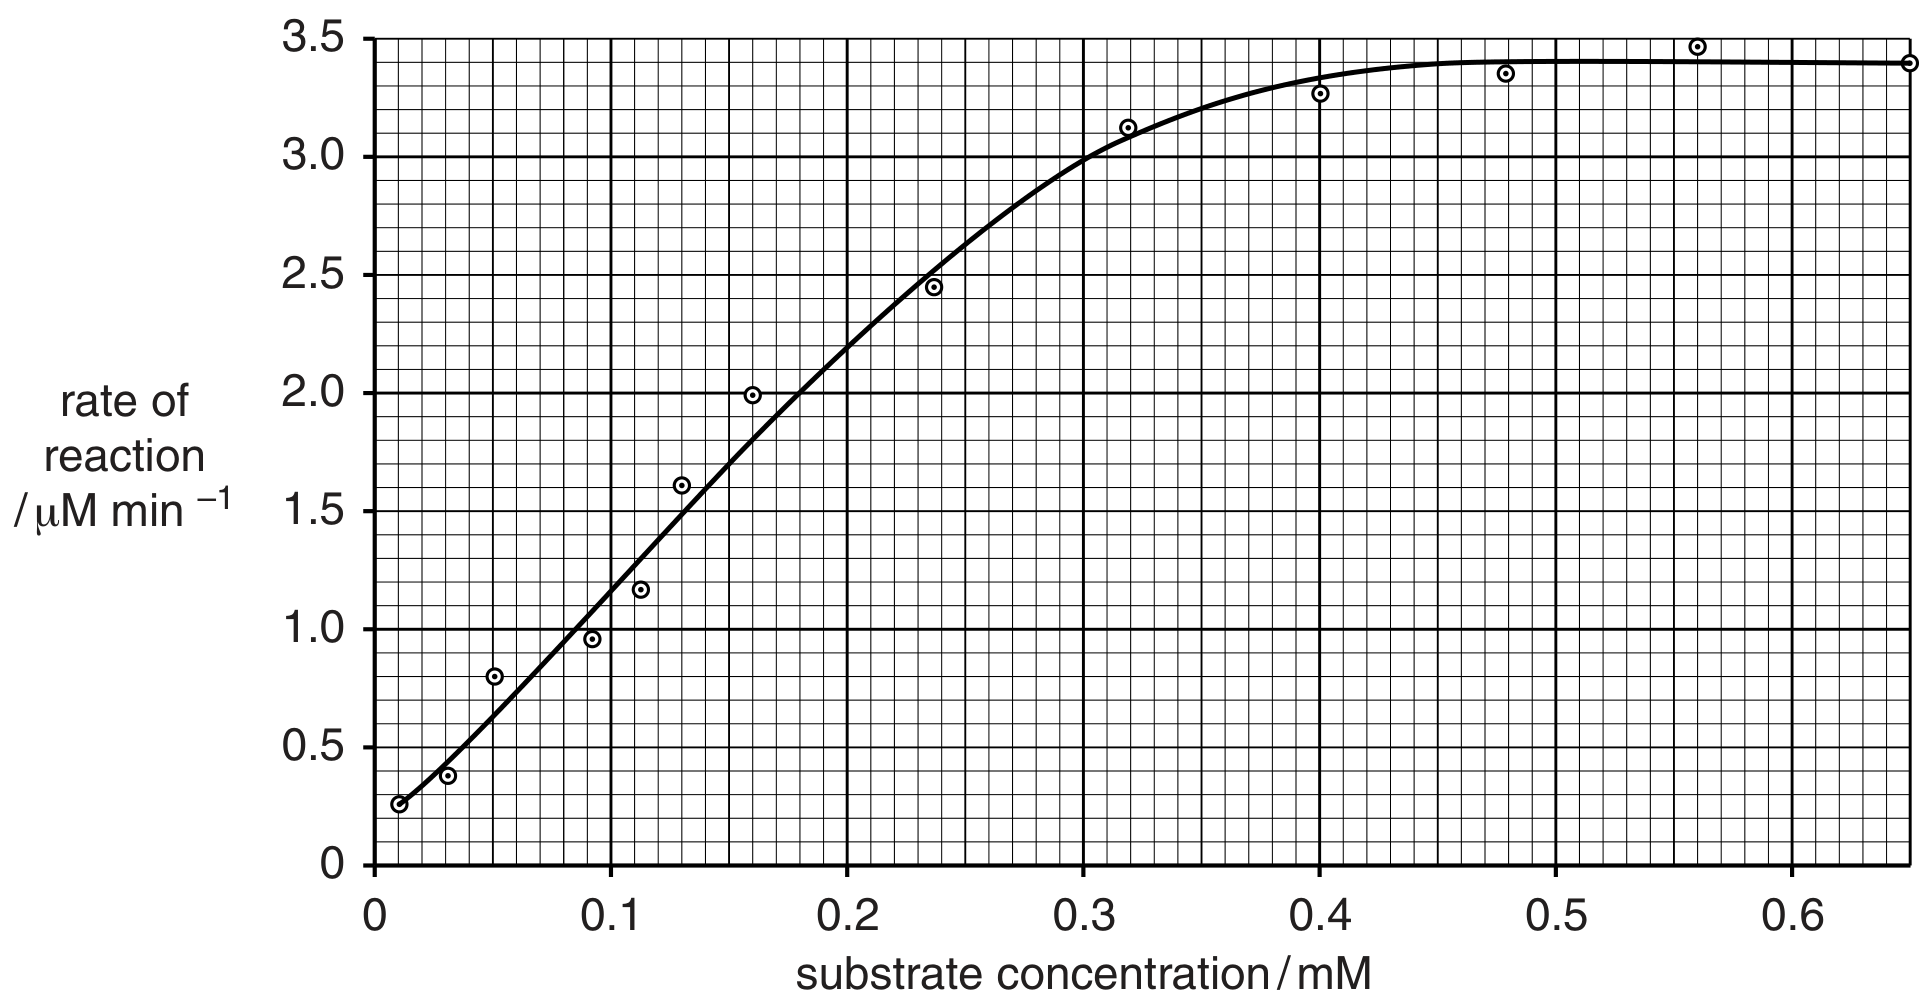
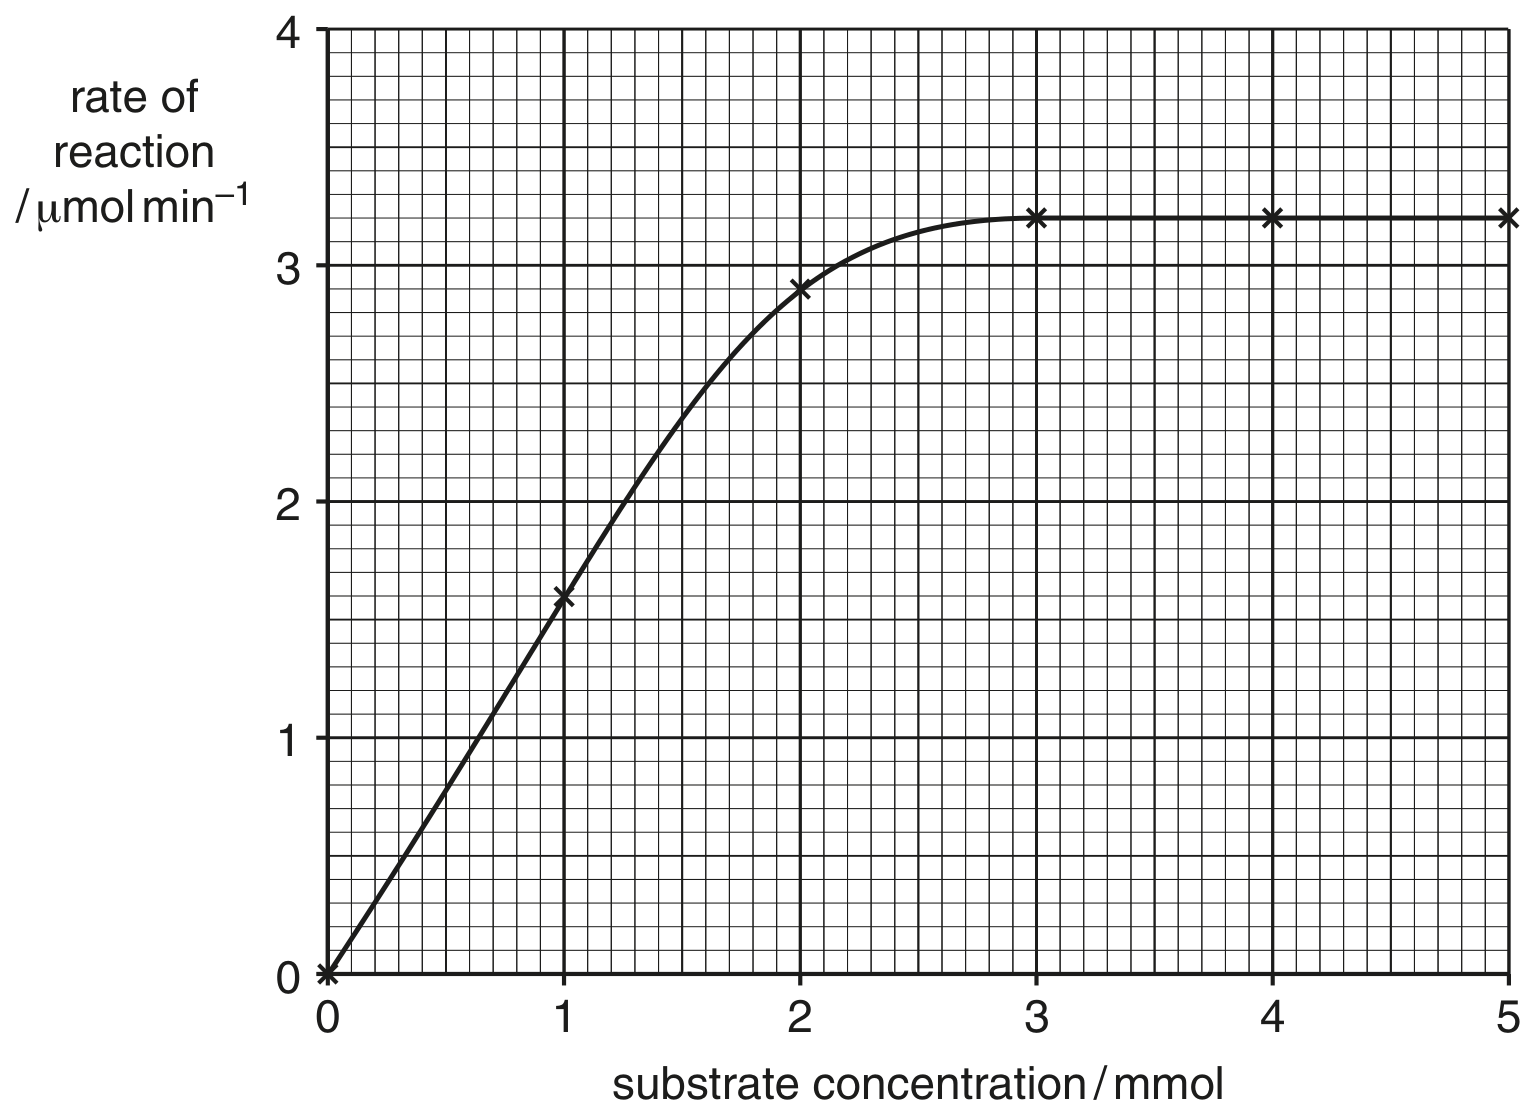
Some students investigated the effect of substrate concentration on the rate of the reaction catalysed by an acid phosphatase (enzyme A). The results are shown in Fig. 2.1.
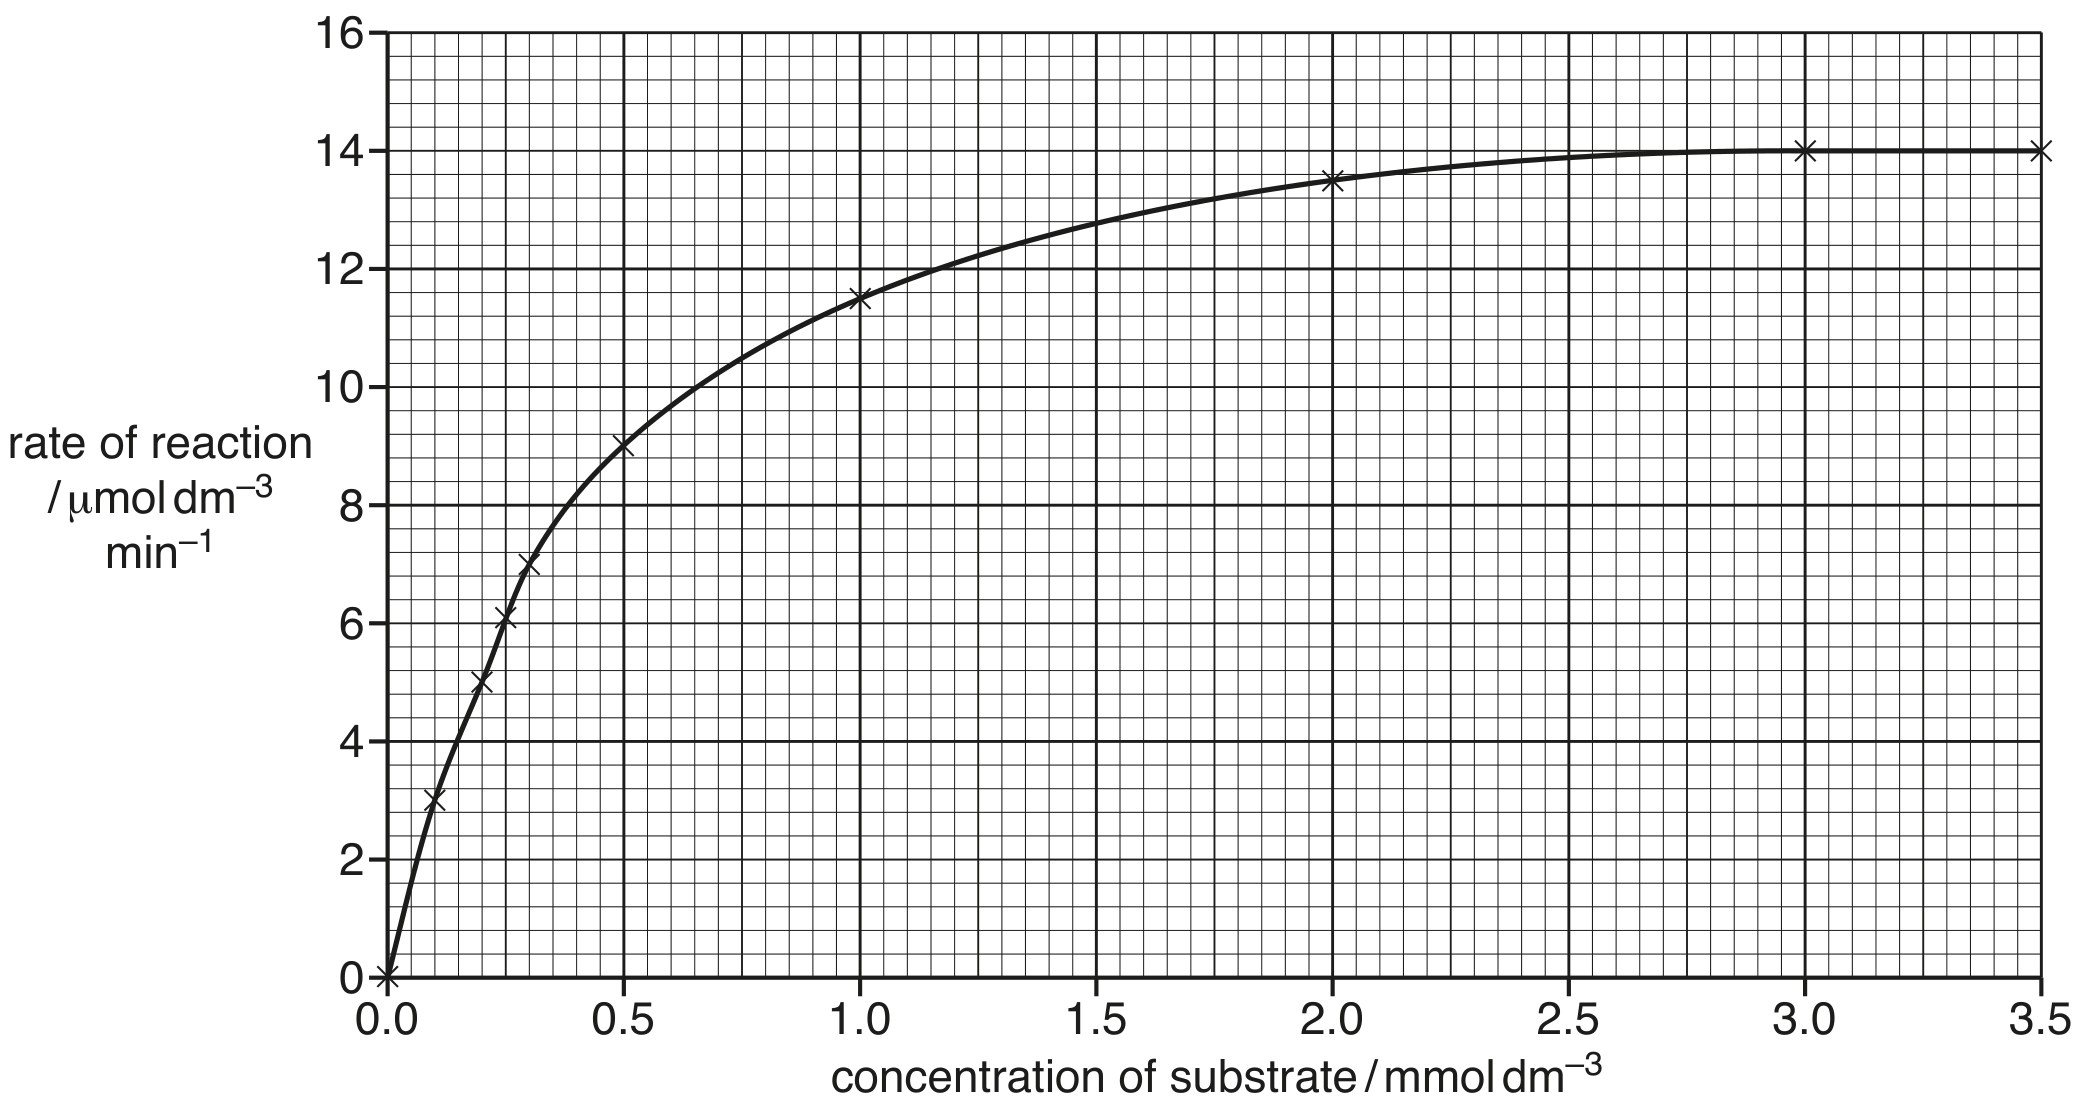
Fig. 2.1

Fig. 2.1

(a)

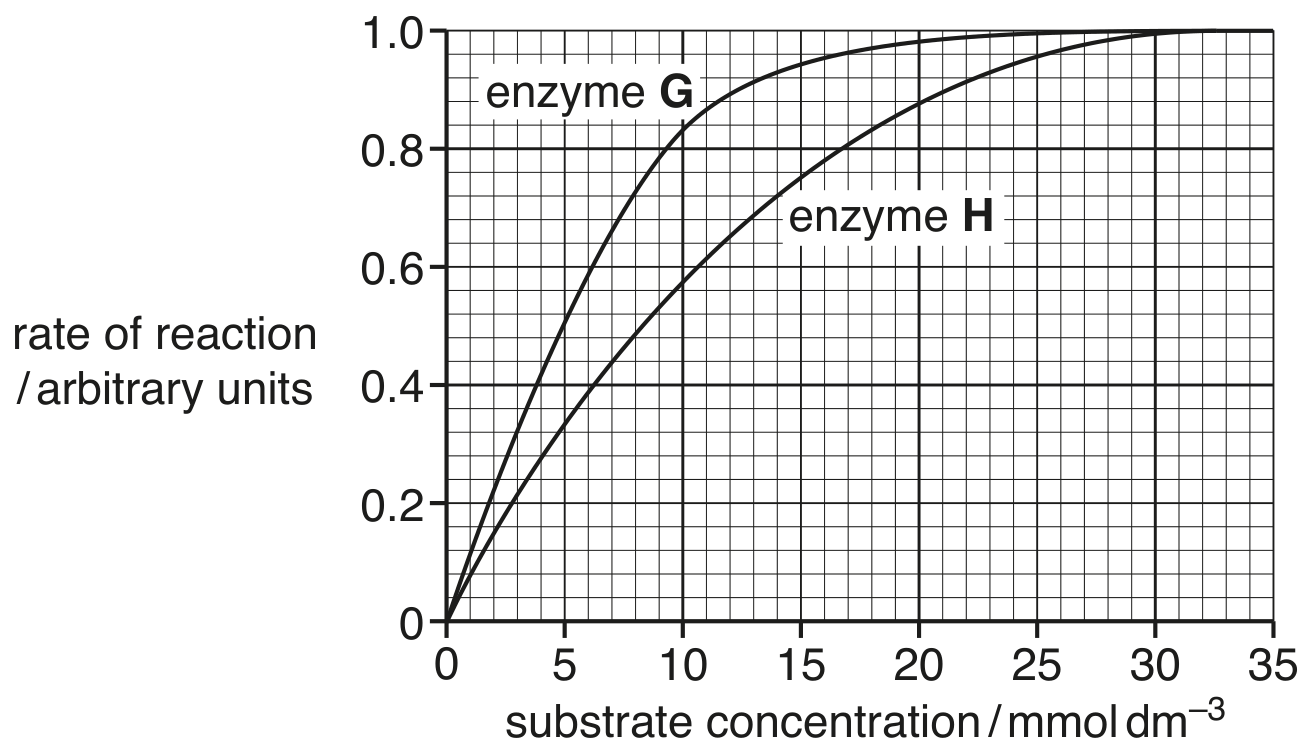
The students investigated a different phosphatase enzyme (enzyme B) and found the value of Km\mathrm{K}_{\mathrm{m}} to be higher than 0.3mmoldm30.3 \mathrm{mmol} \mathrm{dm}^{-3}.

Explain the difference between the values of Km\mathrm{K}_{\mathrm{m}} for these two phosphatase enzymes.

[ 2 ]
[Maximum number: 1]

Fig. 2.1 is a transmission electron micrograph of a cell from a leaf.

Fig. 2.1

Fig. 2.1

(a)

Some plant cells produce a polypeptide called systemin.

[ 1 ]
(i)

The presence of competitive inhibitors, such as serpins, increases the Michaelis-Menten constant ( Km\mathrm{K}_{\mathrm{m}} ) for the enzymes they inhibit.

Explain why the Km\mathrm{K}_{\mathrm{m}} value increases.

[ 1 ]
[Maximum number: 3]

Trypsin is a protease enzyme found in the digestive system.

Fig. 2.1 shows how the substrate concentration affects the rate of reaction of trypsin.

Fig. 2.1 shows how the substrate concentration affects the rate of reaction of trypsin.

(a)

Use Fig. 2.1 to:

[ 3 ]
(i)

determine Vmax \mathrm{V}_{\text {max }} for trypsin

[ 1 ]
(ii)

calculate Km\mathrm{K}_{\mathrm{m}} for trypsin.

Show your working.

[ 2 ]
[Maximum number: 4]

Hydrolytic enzymes can function within the cell or can be secreted by the cell, where they are able to catalyse reactions.

(a)

The rates of reaction of two different hydrolytic enzymes, enzyme G and enzyme H, were measured at different substrate concentrations. The results are shown in Fig. 3.1.

The two enzymes have different values of the Michaelis-Menten constant ( Km\mathrm{K}_{\mathrm{m}} ).

Fig. 3.1

Fig. 3.1

[ 4 ]
(i)

The Km\mathrm{K}_{\mathrm{m}} value of enzyme G is 5mmoldm35 \mathrm{mmol} \mathrm{dm}^{-3}.

Use Fig. 3.1 to derive the Km\mathrm{K}_{\mathrm{m}} value for enzyme H.
Show your working.

[ 2 ]
(ii)

With reference to Fig. 3.1, explain how the values of Km\mathrm{K}_{\mathrm{m}} for these enzymes provide information about the relationship between the enzyme and their substrates.

Cells can break down an old or damaged organelle, such as a mitochondrion, by enclosing the organelle in a membrane formed from the endoplasmic reticulum. This forms a vacuole. Vesicles containing hydrolytic enzymes fuse with the vacuole and the organelle is then digested.

[ 2 ]
[Maximum number: 1]

The graph shows the effect of substrate concentration on the rates of reaction of three enzymes, X, Y, and Z.

Question image

What is the correct order of affinity of these enzymes for their substrates, starting with the enzyme with the highest affinity?

A

XYZ\mathrm{X} \rightarrow \mathrm{Y} \rightarrow \mathrm{Z}

B

XZYX \rightarrow Z \rightarrow Y

C

YXZ\mathrm{Y} \rightarrow \mathrm{X} \rightarrow \mathrm{Z}

D

ZXY\mathrm{Z} \rightarrow \mathrm{X} \rightarrow \mathrm{Y}

[Maximum number: 1]

Fig. 3.1 shows the structure of the enzyme lysozyme.

Fig. 3.1

Fig. 3.1

(a)

Fig. 3.2 shows the results of an investigation into the effect of substrate concentration on the rate of reaction catalysed by lysozyme.

Fig. 3.2

Fig. 3.2

Use Fig. 3.2 to:

[ 1 ]
(i)

state the lowest substrate concentration to give the maximum rate of reaction, Vmax\mathrm{V}_{\max }

[ 1 ]
(ii)

determine the Michaelis-Menten constant, Km\mathrm{K}_{\mathrm{m}}.

Km=\mathrm{K}_{\mathrm{m}}=
[Maximum number: 1]

Which aspect of enzyme activity can be compared by the Michaelis-Menten constant?

A

activation energy of a reaction with or without an enzyme

B

affinity of different enzymes for their substrates

C

affinity of an enzyme at different substrate concentrations

D

maximum rate of reaction ( Vmax \mathrm{V}_{\text {max }} ) at different temperatures

[Maximum number: 1]

Which statements about the Michaelis-Menten constant (Km)\left(\mathrm{K}_{\mathrm{m}}\right) are correct?
1 The higher the Km\mathrm{K}_{\mathrm{m}}, the higher the enzyme affinity for the substrate.
2 Km2 \mathrm{~K}_{\mathrm{m}} is a measure of the degree of enzyme affinity for the substrate.
3 Km3 \mathrm{~K}_{\mathrm{m}} is defined as the substrate concentration at which the enzyme functions at half its maximum rate.

A

1, 2 and 3

B

1 and 2 only

C

1 and 3 only

D

2 and 3 only

0