[Maximum number: 9]
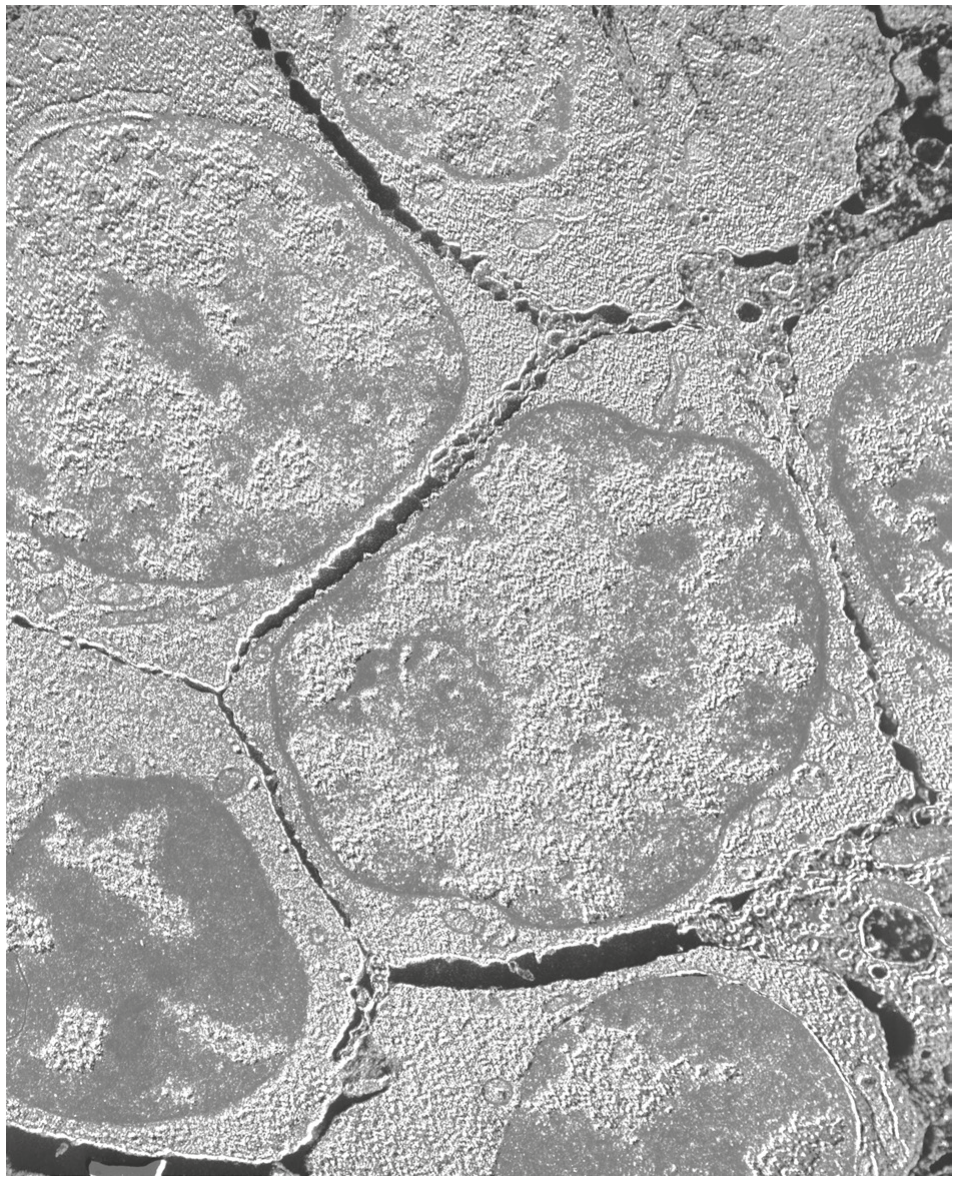
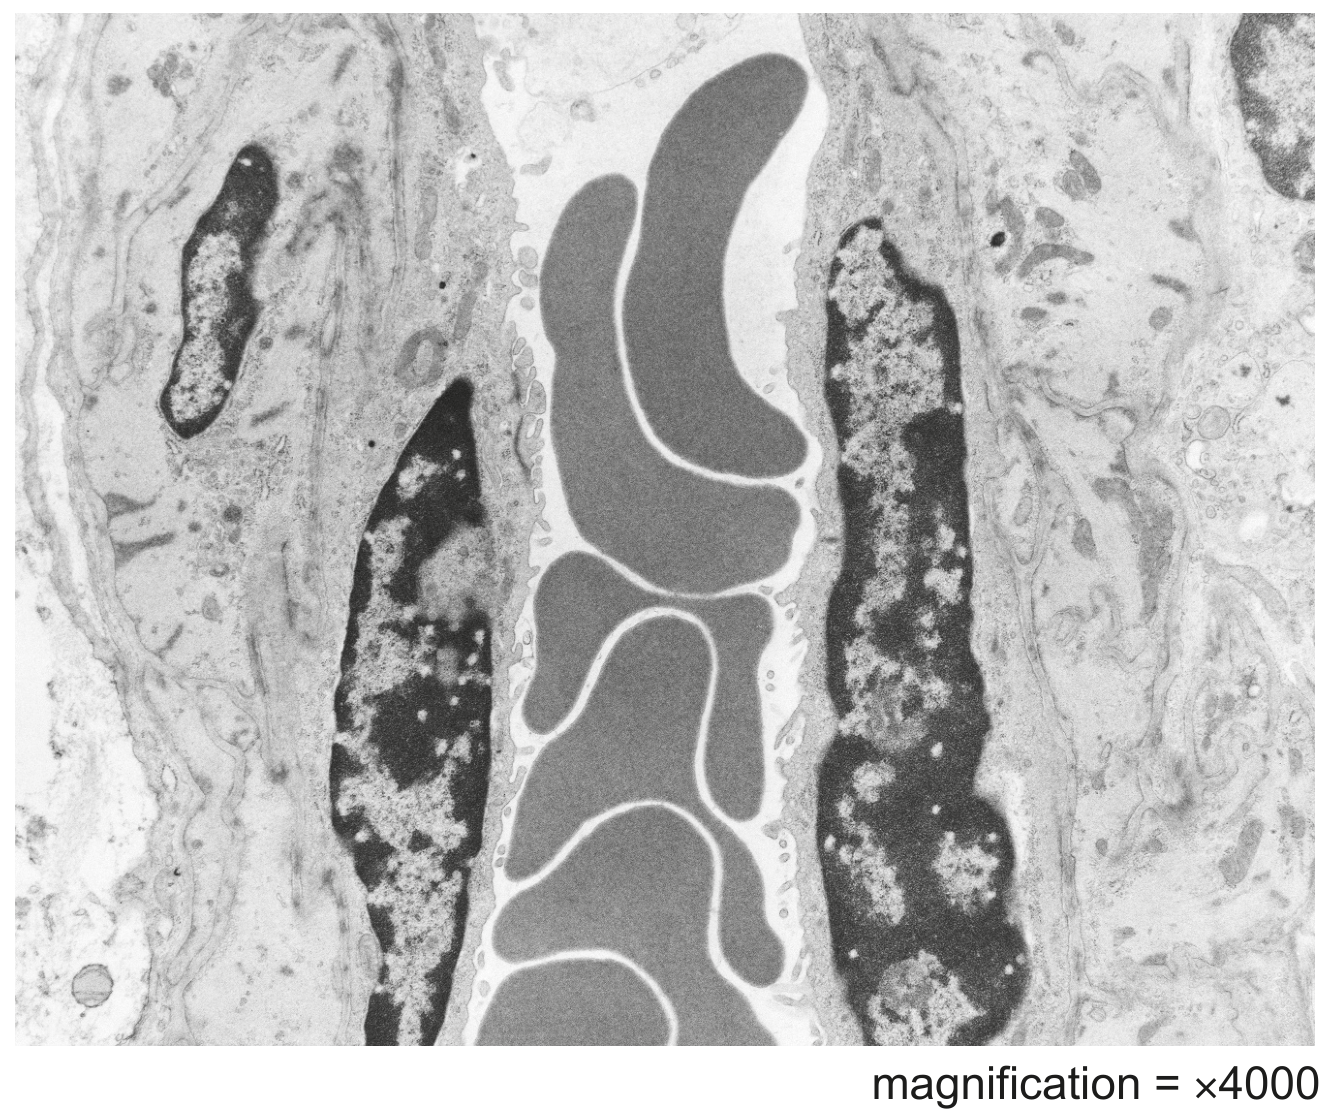
Fig. 1.1 and Fig. 1.2 are photomicrographs showing the distribution of tissues in the lungs.
Fig. 1.1 is a photomicrograph of a section through part of the lungs.
Fig. 1.2 is a high-power view of the area indicated on Fig. 1.1.
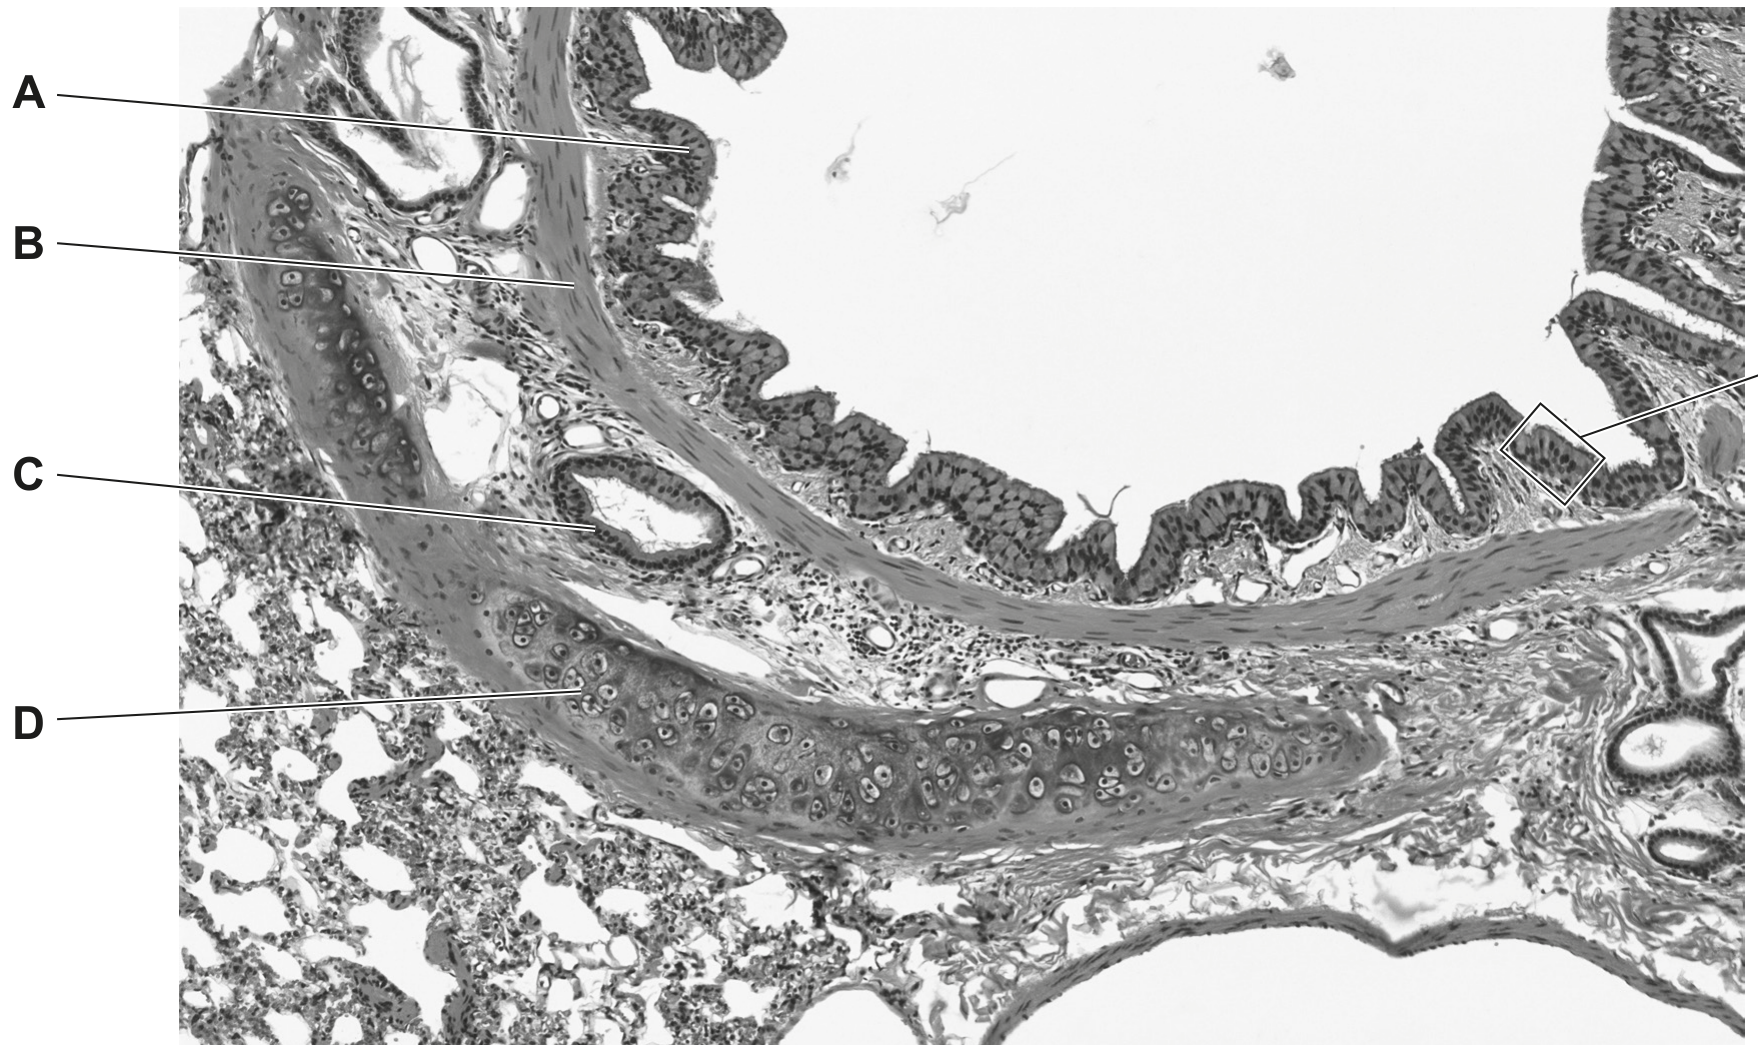
Fig. 1.1
section enlarged in Fig. 1.2
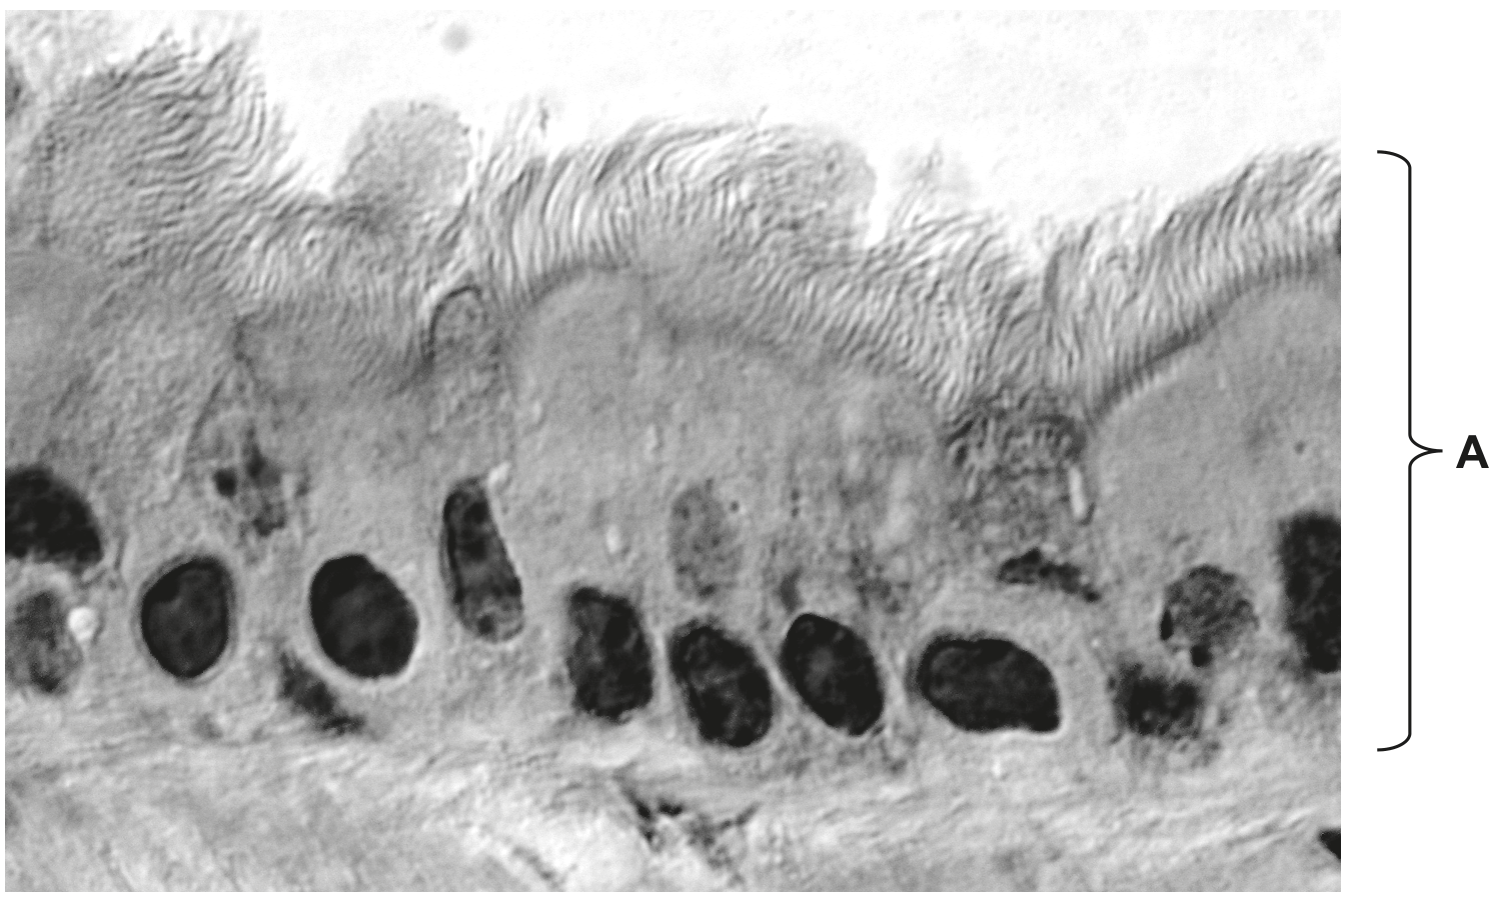
Fig. 1.2
(a)
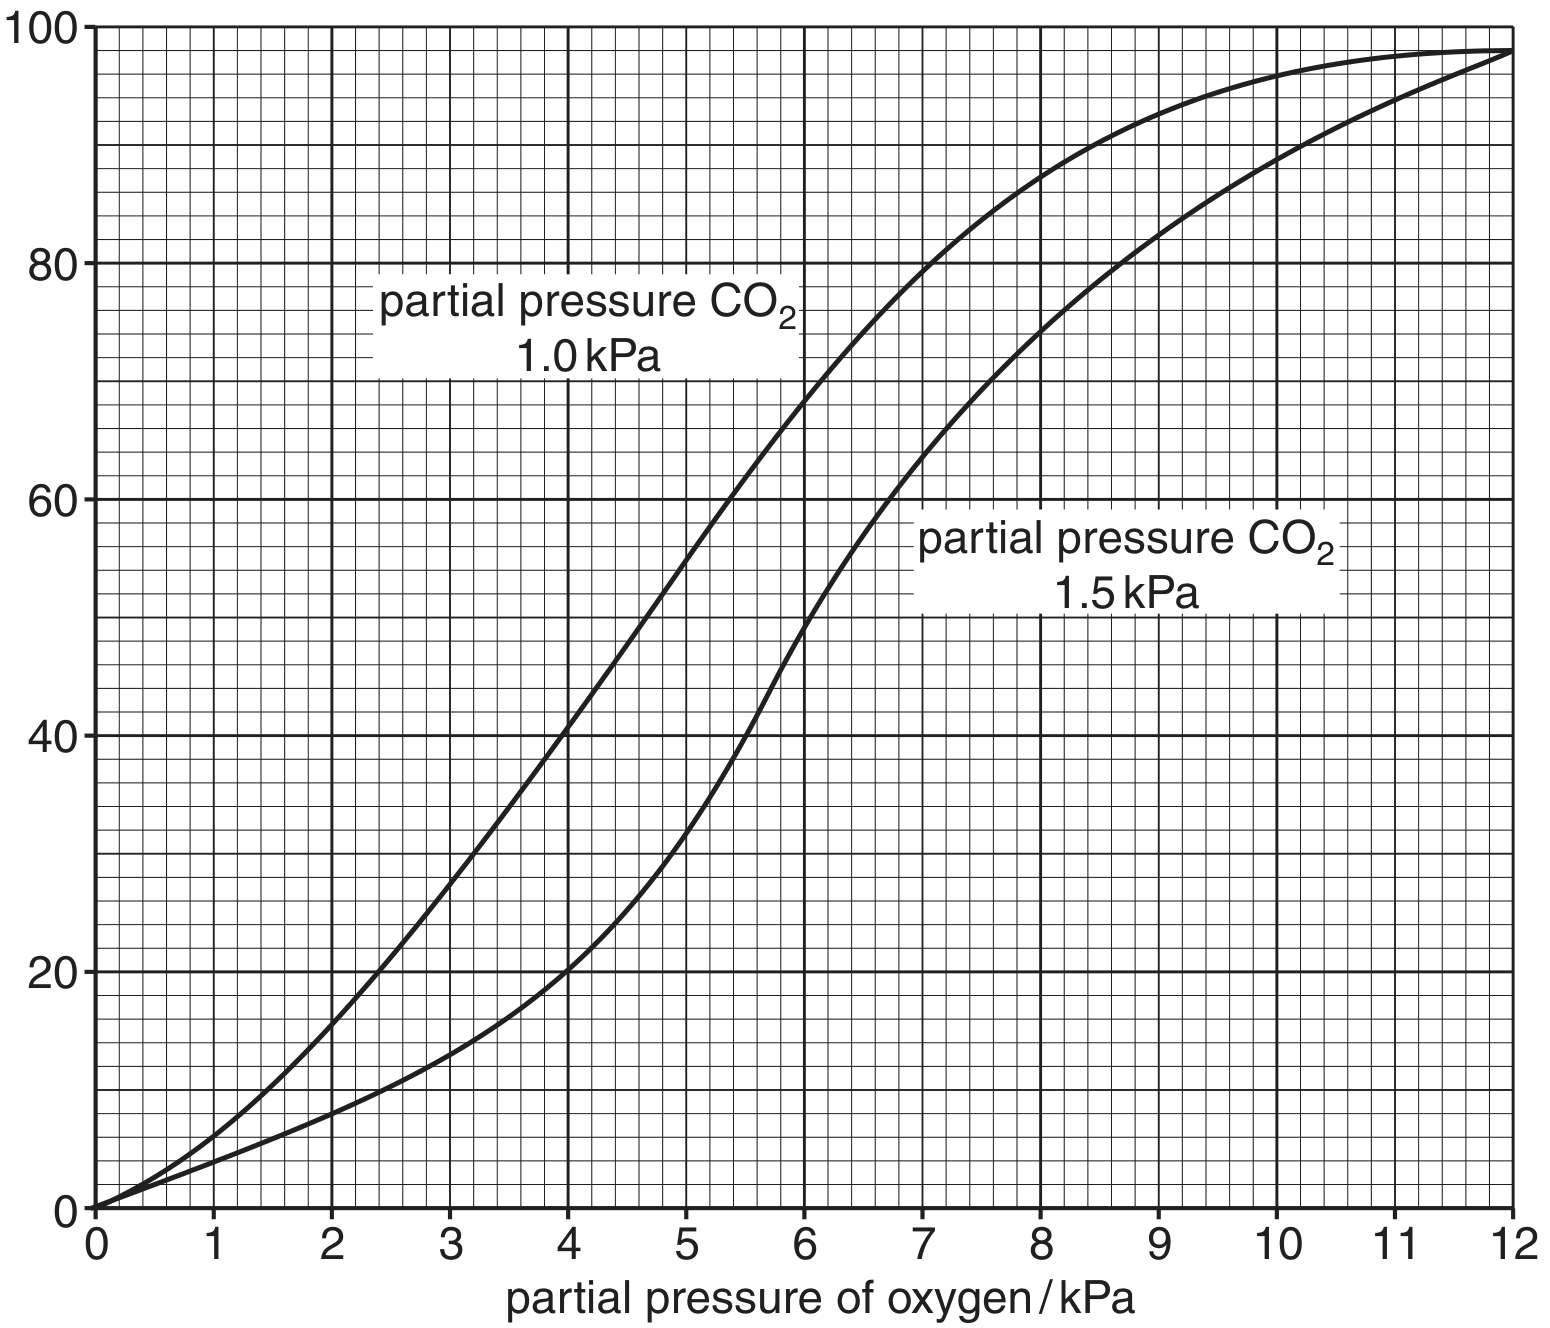
Hyperventilation occurs when a person breathes too fast or too deeply.
The effects of hyperventilation are:
- a decrease in the partial pressure of carbon dioxide in alveolar air
- an increase in the pH of the blood.
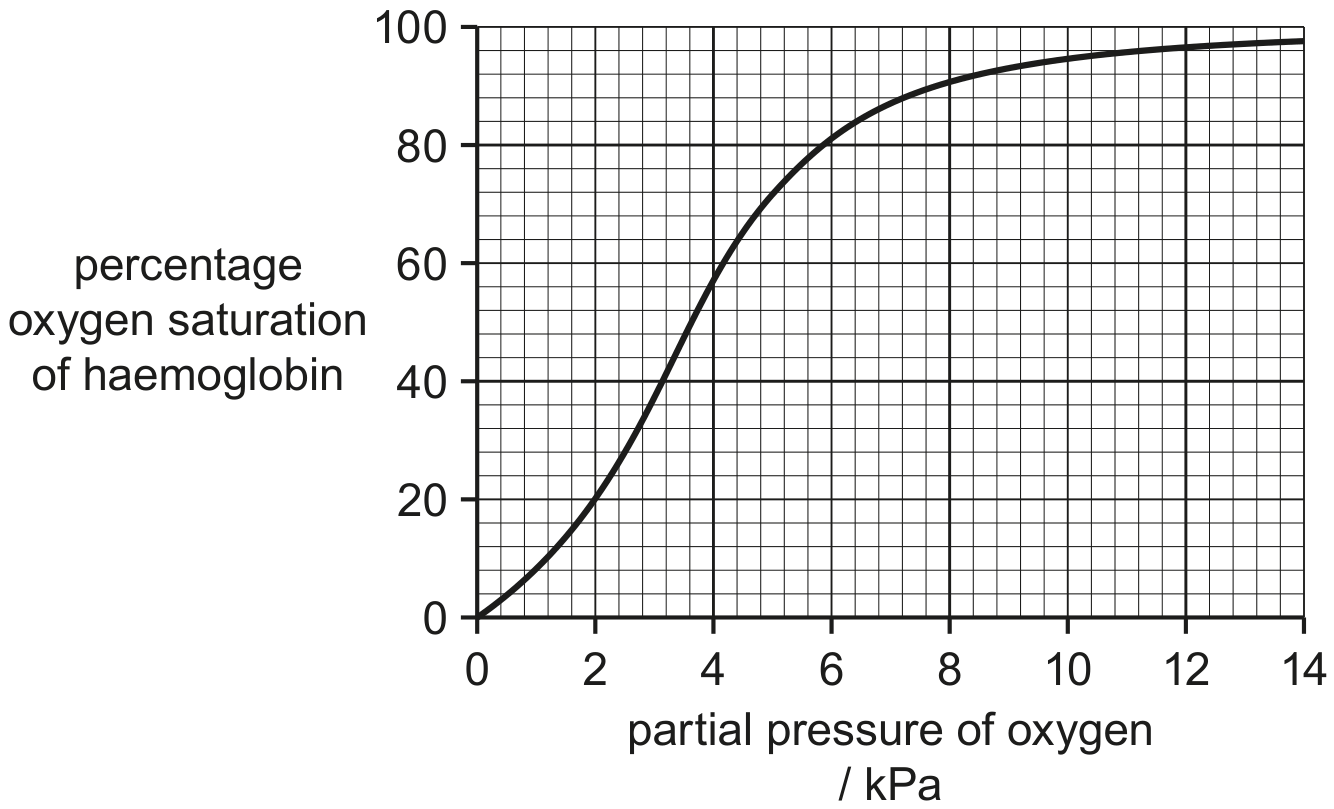
Fig. 1.3 shows the change in the oxygen dissociation curve as a result of hyperventilation.
percentage saturation of haemoglobin with oxygen
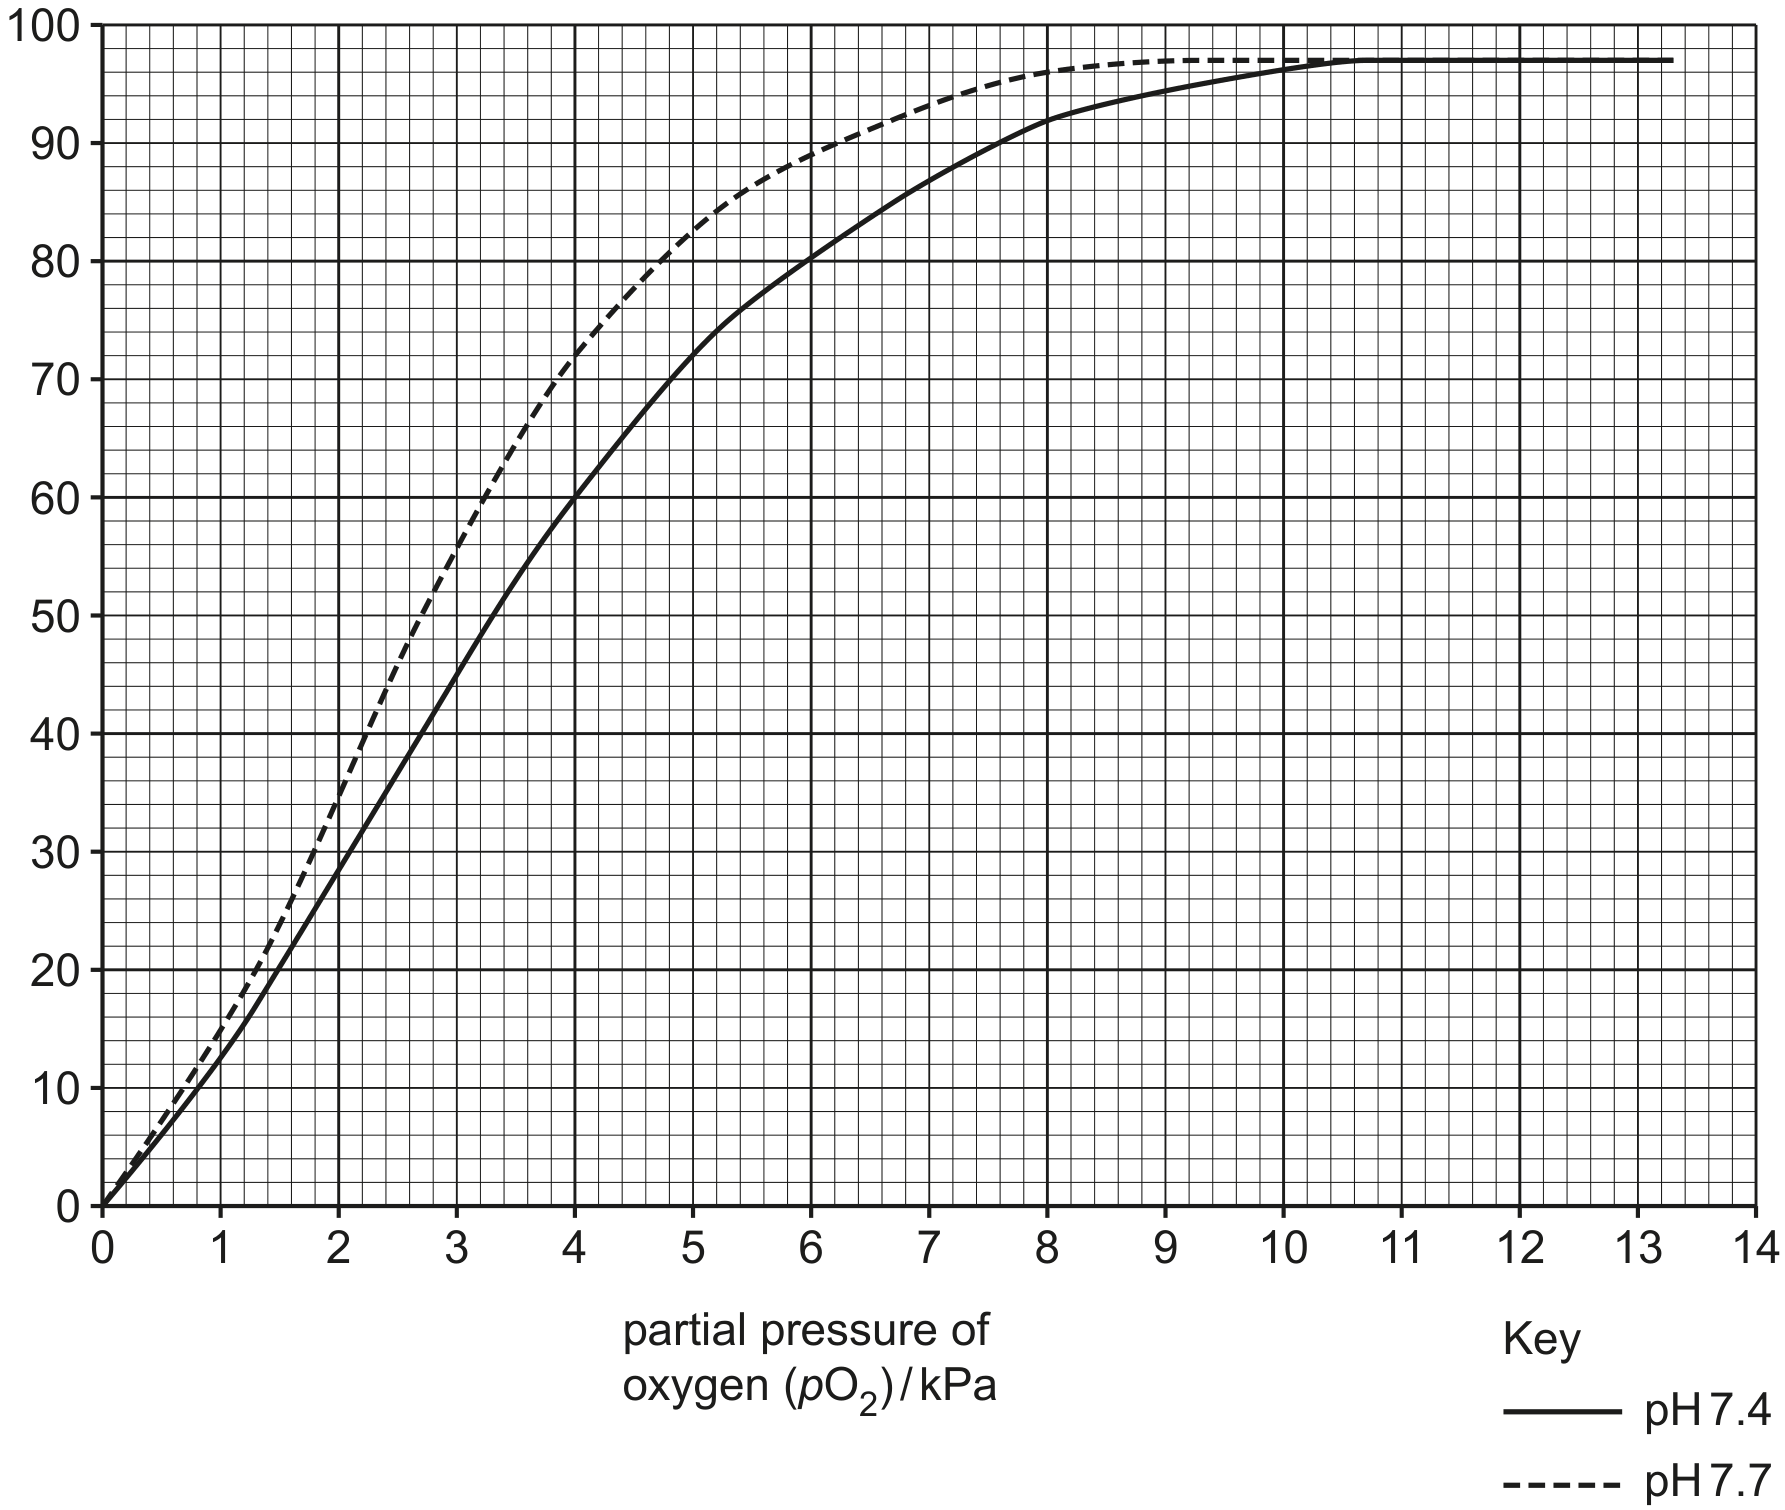
Fig. 1.3
[ 3 ]
(i)
State the percentage saturation of haemoglobin at a of 4.0 kPa .
pH=7.7 kPa
pH=7.4 kPa