C4.2.11—Energy pyramids
Energy pyramids explains how energy flow, matter cycling, trophic transfer or carbon movement is represented, measured or limited within ecosystems.
- Syllabus
- First assessment 2025
- Objective
- C4.2.11
- Level
- SL
Energy pyramids explains how energy flow, matter cycling, trophic transfer or carbon movement is represented, measured or limited within ecosystems.

Coverage 2010–2024 · Updated 16 Jul 2026
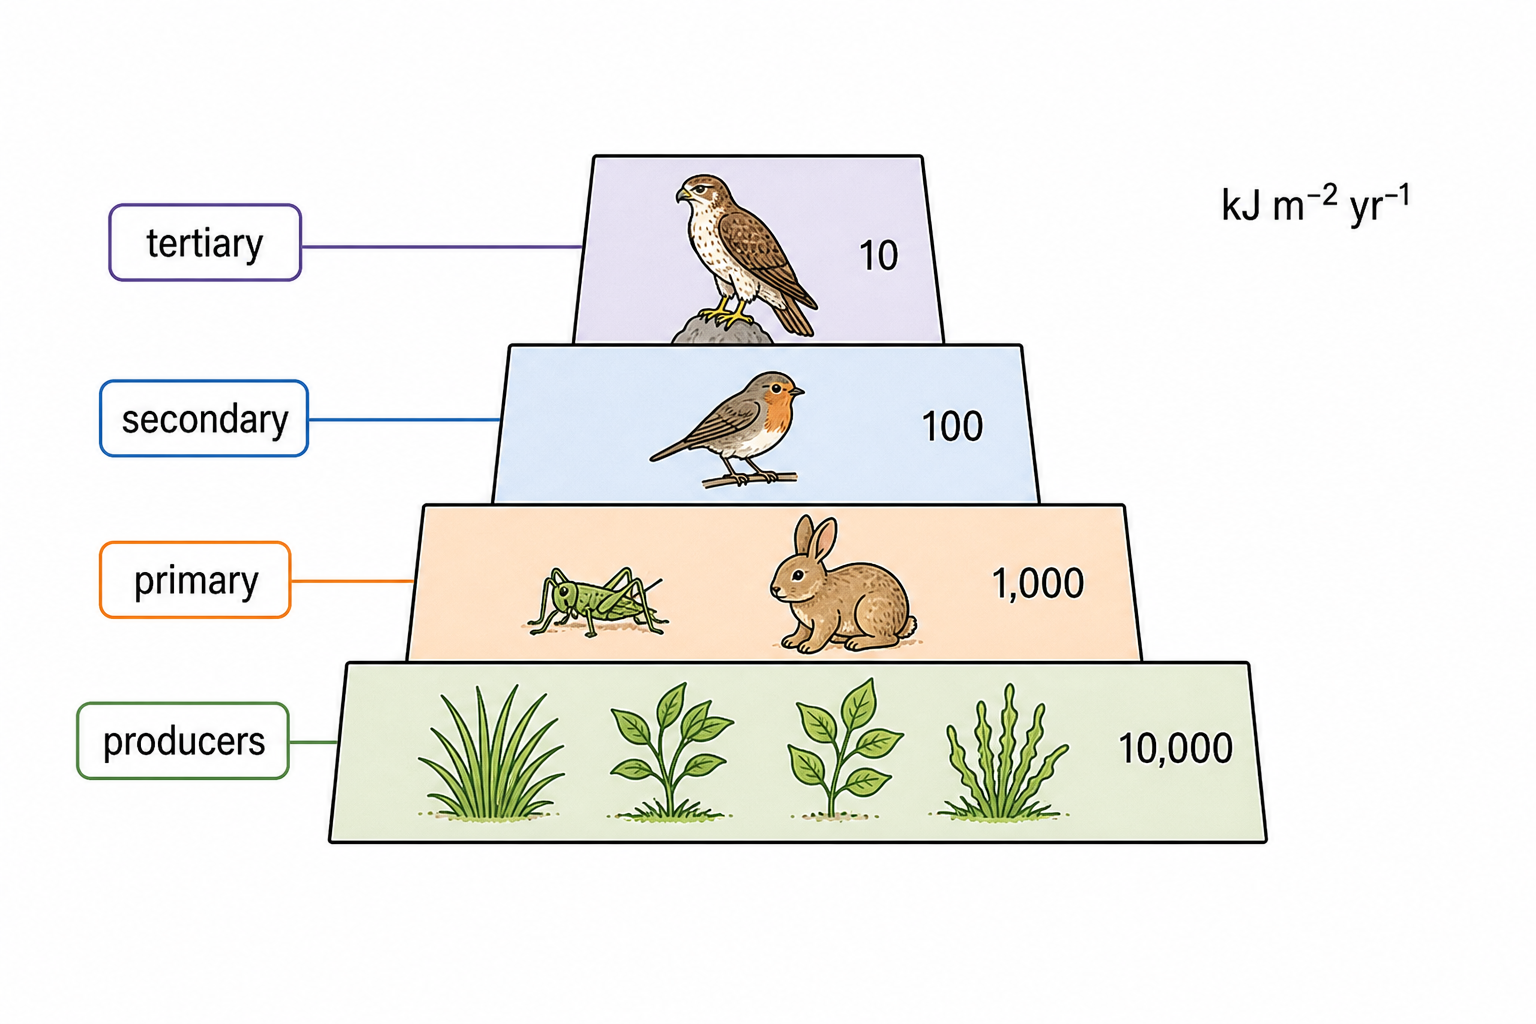
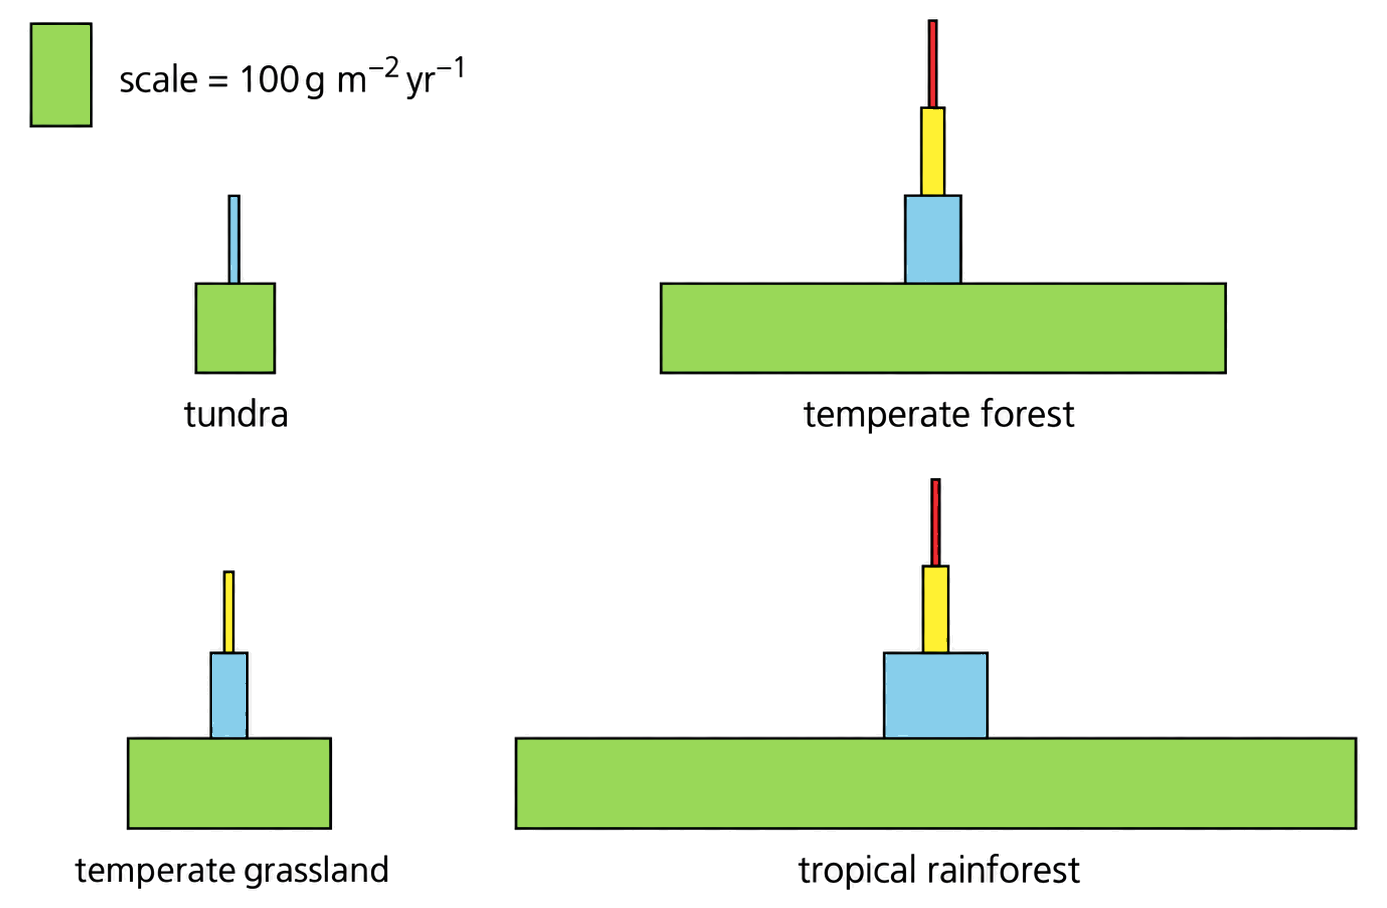
An energy pyramid uses measured research data to show energy available at successive trophic levels per unit area per unit time.
Choose one specific ecosystem dataset; verify that all values use compatible energy, area and time units; order producer to higher consumers; draw bars with widths proportional to the reported values; label every value and unit.
For each transfer, calculate loss as energy at lower level minus energy at next level, and transfer efficiency as (next-level energy ÷ lower-level energy) × 100%. Use the dataset's real values rather than assuming a fixed percentage.
A correctly constructed pyramid lets the reader compare the measured producer energy with each consumer level and see both absolute loss and proportional transfer between adjacent levels.
An energy pyramid is not a pyramid of numbers or standing biomass. Do not invent missing values or mix units or measurement intervals from different ecosystems.
This objective is assessed through structured response, commonly using Identify / Label / Explain.
Identify / Label / Explain / Describe / Outline / State / Draw / Discuss / Sketch
Build the answer around this relationship: Energy pyramids must be linked to the correct source, store, transfer or loss process.
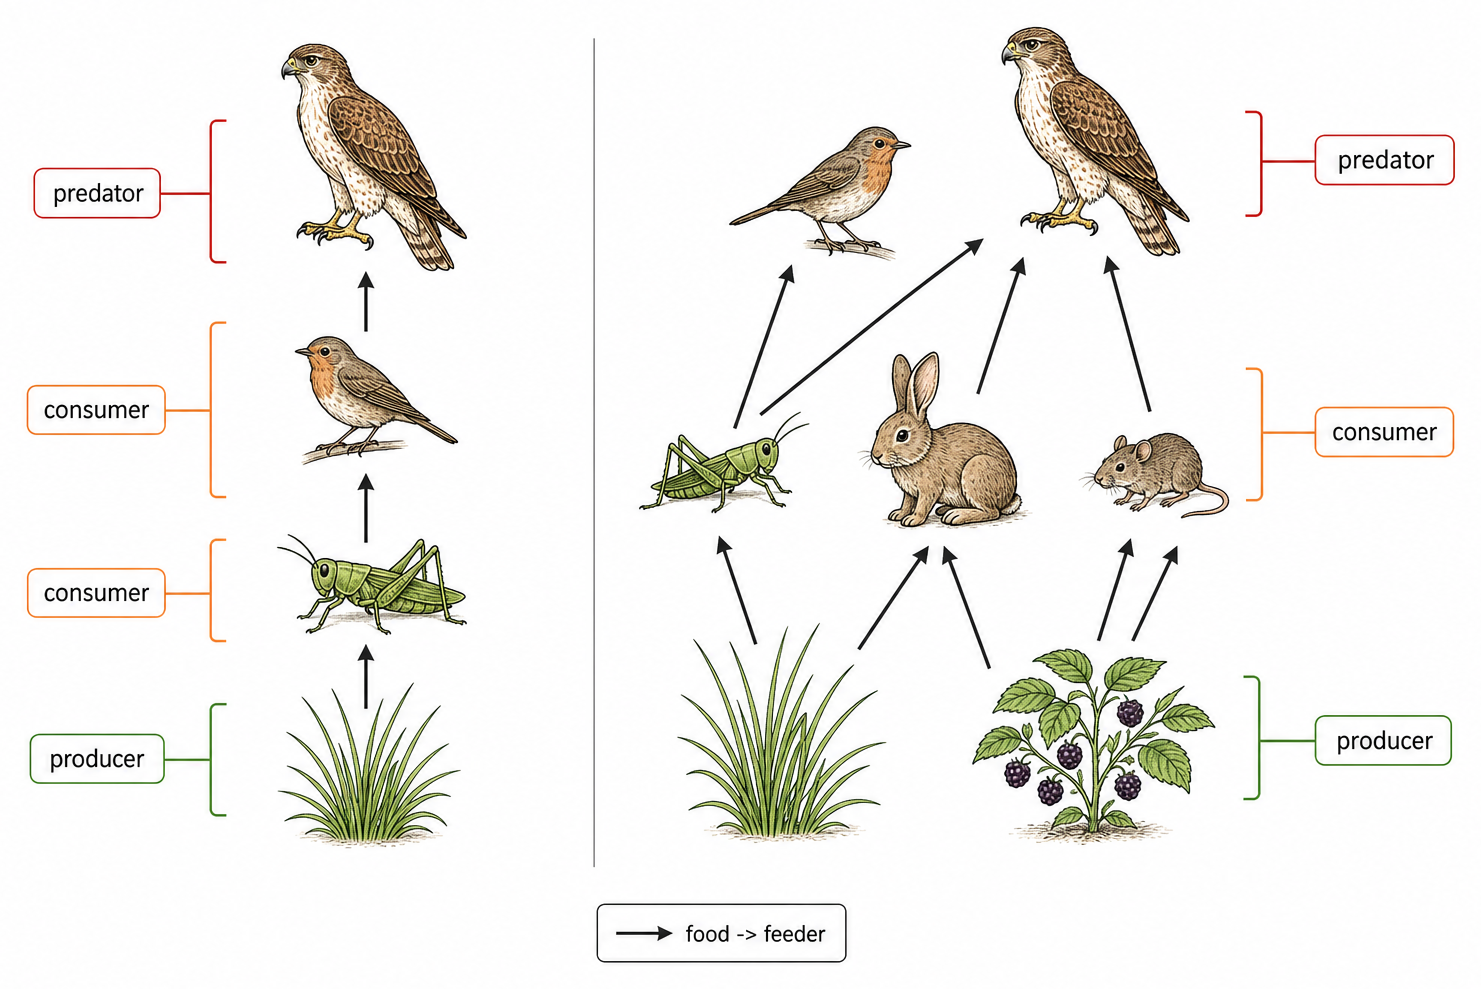
Reversing food-web arrows instead of showing energy transfer direction.
Representative question
Ecologists sometimes display data from an ecosystem using a diagram called a pyramid of energy. Describe what is shown in pyramids of energy.
pyramid of energy shows the flow of energy from one trophic level to the next (in a community);
units of pyramids of energy are energy per unit area per unit time /kJm−2yr−1;
bar width is proportional to the energy stored (in the biomass) in that trophic level;
the first/lowest trophic level is producers;
second level is primary consumers/herbivores;
third level of secondary consumers/carnivores;
only a small amount (10 to 20 % ) of energy of one level is passed to the next;
bar width/energy stored in the trophic level decreases (proportionally) as you go up each level;
pyramid shows that there is a limit to the length of food chains;
Award any of the above marking points to a correctly drawn and clearly labelled pyramid.