IB Biology SL Interaction and Interdependence Concepts

Interaction and Interdependence explains how cells, organisms and ecosystems exchange information, energy and matter through regulated relationships and environmental feedback.

Syllabus
First assessment 2025
Section
Level
SL

Exam analysis

Published Concept evidence in Interaction and Interdependence clusters around regulated processes, signalling, defence and ecological relationships. The recurring pattern is explaining how interactions control biological outcomes, from enzyme activity and energy transfer to population change and ecosystem cycling.

Most tested topics

Practice this section

Recent 5 years · Updated 22 Jul 2026

In this section

Topic C1.1

C1.1 Enzymes and metabolism

Enzymes and metabolism explain how catalysts, active sites, reaction conditions and pathway regulation control cellular chemical reactions in living systems.

54% of analysed papers 75 papers · 99 questions

Objectives in this topic

Enzymes Speed Reactions as Catalysts

Enzymes are biological catalysts that increase reaction rate without being consumed.

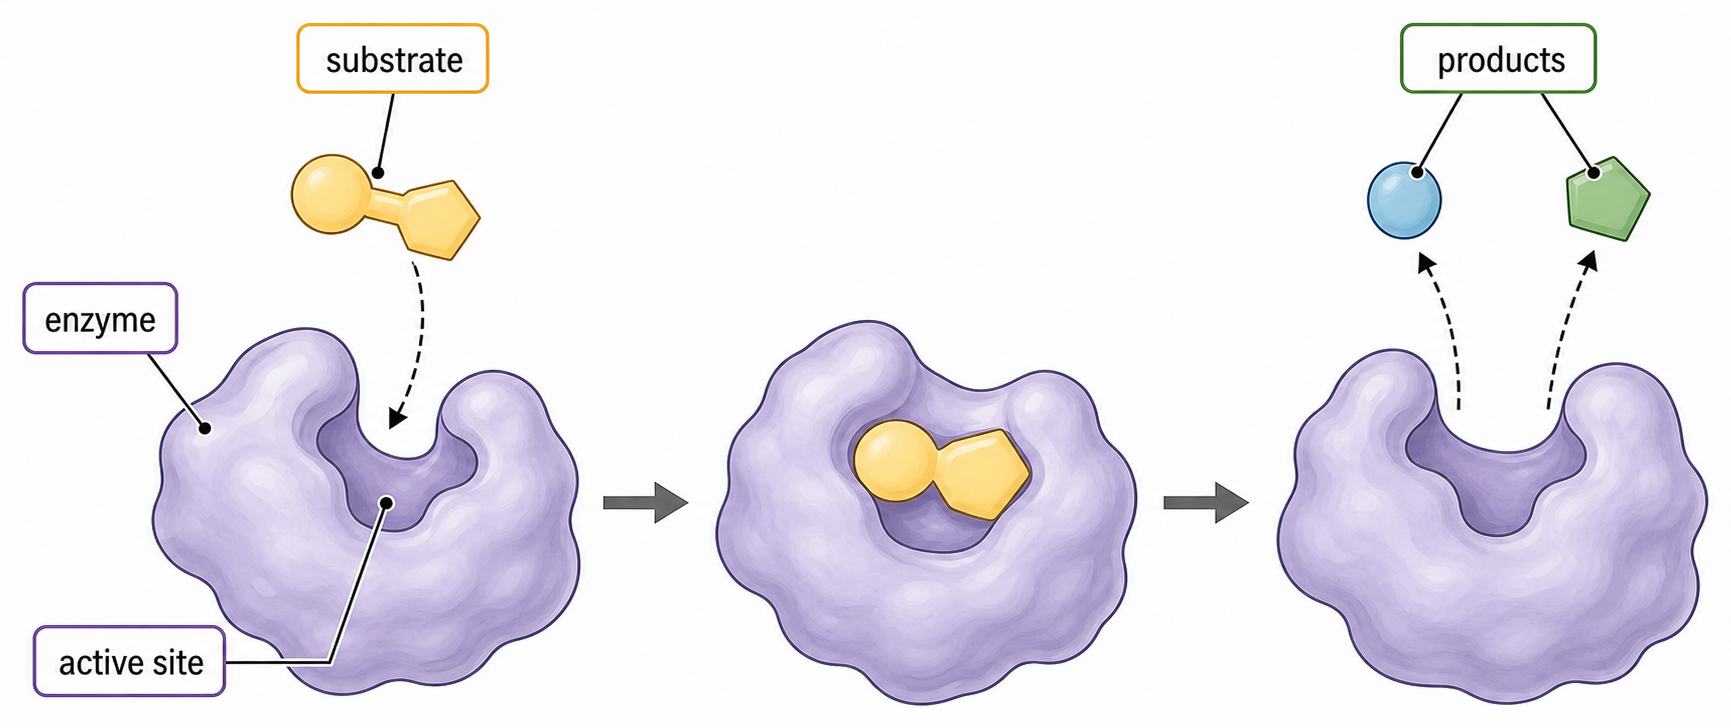
They provide an alternative pathway with lower activation energy, so more substrate molecules can react at a given temperature. The enzyme is regenerated after products leave its active site.

For a catalyst claim, check:

  • reaction rate increases
  • activation energy decreases
  • enzyme is not used up
  • equilibrium position is unchanged

Adding catalase to hydrogen peroxide makes oxygen bubbles appear faster, but the catalase remains available for further reactions.

An enzyme changes kinetics, not the overall energy difference or equilibrium constant.

Enzymes as catalysts

Assessment in practice

4 marks
How it is assessed

This objective is assessed through structured response, commonly using Outline / Explain.

Command terms

Outline / Explain

What earns marks

Build the answer around this relationship: Enzymes speed biological reactions without being used up.

Representative question

Question 1

[Maximum number: 3]

Explain how enzymes catalyse chemical reactions.

Enzymes Organize Metabolic Reactions

Metabolism is the complex network of interdependent and interacting chemical reactions occurring in a living organism; each step is catalysed by a specific enzyme.

Enzyme specificity requires many different enzymes, because each active site catalyses only a limited reaction. Linking enzyme-controlled steps lets the products of one reaction become substrates for another.

Cells control metabolic flux by changing enzyme synthesis, activity, location or access to substrate. Regulation at one key step can alter the output of an entire pathway while other pathways continue independently.

In a pathway A → B → C, one enzyme catalyses A → B and a different enzyme catalyses B → C; inhibiting the first step reduces both B formation and downstream C production.

Metabolism is not one reaction or only energy release: it includes all interacting anabolic and catabolic reactions and the controls acting through their enzymes.

Role in metabolism

Assessment in practice

1–4 marks
How it is assessed

This objective is assessed through structured response, commonly using Define / Explain.

Command terms

Define / Explain

What earns marks

Build the answer around this relationship: Metabolism is the total set of chemical reactions in cells or organisms.

Representative question

Question 1

[Maximum number: 4]

Explain the role of enzymes in metabolic pathways.

Anabolism Builds; Catabolism Breaks Down

Anabolic reactions build larger molecules from smaller units and require energy; catabolic reactions break down or oxidize molecules and often release usable energy.

Anabolism commonly joins monomers by condensation, forming covalent bonds and releasing water. Catabolism includes hydrolysis of macromolecules in digestion and oxidation of respiratory substrates.

Anabolism Catabolism
Amino acids → proteins by condensation Proteins → amino acids by hydrolysis in digestion
Glucose → glycogen Glycogen or other macromolecules → smaller units
Carbon dioxide → organic molecules in photosynthesis Glucose/fatty acids oxidized during respiration

Catabolic respiration can supply ATP and reducing power that drive anabolic protein or glycogen synthesis, linking the two parts of metabolism.

Energy input or release is a typical consequence, not the sole classification rule: identify whether the cellular pathway constructs or breaks/oxidizes material.

Anabolic and catabolic reactions

Assessment in practice

1 marks
How it is assessed

This objective is assessed through structured response, commonly using Identify / Distinguish.

Command terms

Identify / Distinguish

What earns marks

Build the answer around this relationship: Anabolism builds larger or more complex molecules from smaller units.

Representative question

Question 1

[Maximum number: 2]

Identify the following processes as either anabolism or catabolism by placing a tick ( ✓ ) in the correct box.

ProcessAnabolismCatabolism
Light-independent reactions of photosynthesis\square\square
Glycolysis\square\square

Globular Protein Shape Creates an Active Site

Most enzymes are globular proteins whose overall three-dimensional fold creates a small active-site pocket for substrate binding and catalysis.

Only a few amino-acid residues directly form the active site, but interactions among many residues elsewhere—hydrogen bonds, ionic attractions, hydrophobic effects and sometimes disulfide bonds—position those catalytic residues correctly.

The active site binds substrate to form an enzyme–substrate complex and presents chemical groups with the charge, polarity and geometry needed to stabilize the transition state and promote reaction.

Changing a residue far from the pocket can disrupt the protein fold and reposition an active-site residue, reducing catalysis even though that altered residue never contacts substrate.

The active site is only a small part of the enzyme, but it depends on the entire globular conformation; a matching outline alone is not enough for catalytic chemistry.

Enzymes as globular proteins

Assessment in practice

1 marks
How it is assessed

This objective is assessed through structured response, commonly using Define / State.

Command terms

Define / State

What earns marks

Build the answer around this relationship: Most enzymes are globular proteins with specific folded shapes.

Representative question

Question 1

[Maximum number: 1]

State a role of the active site of an enzyme.

Induced Fit Improves Catalysis

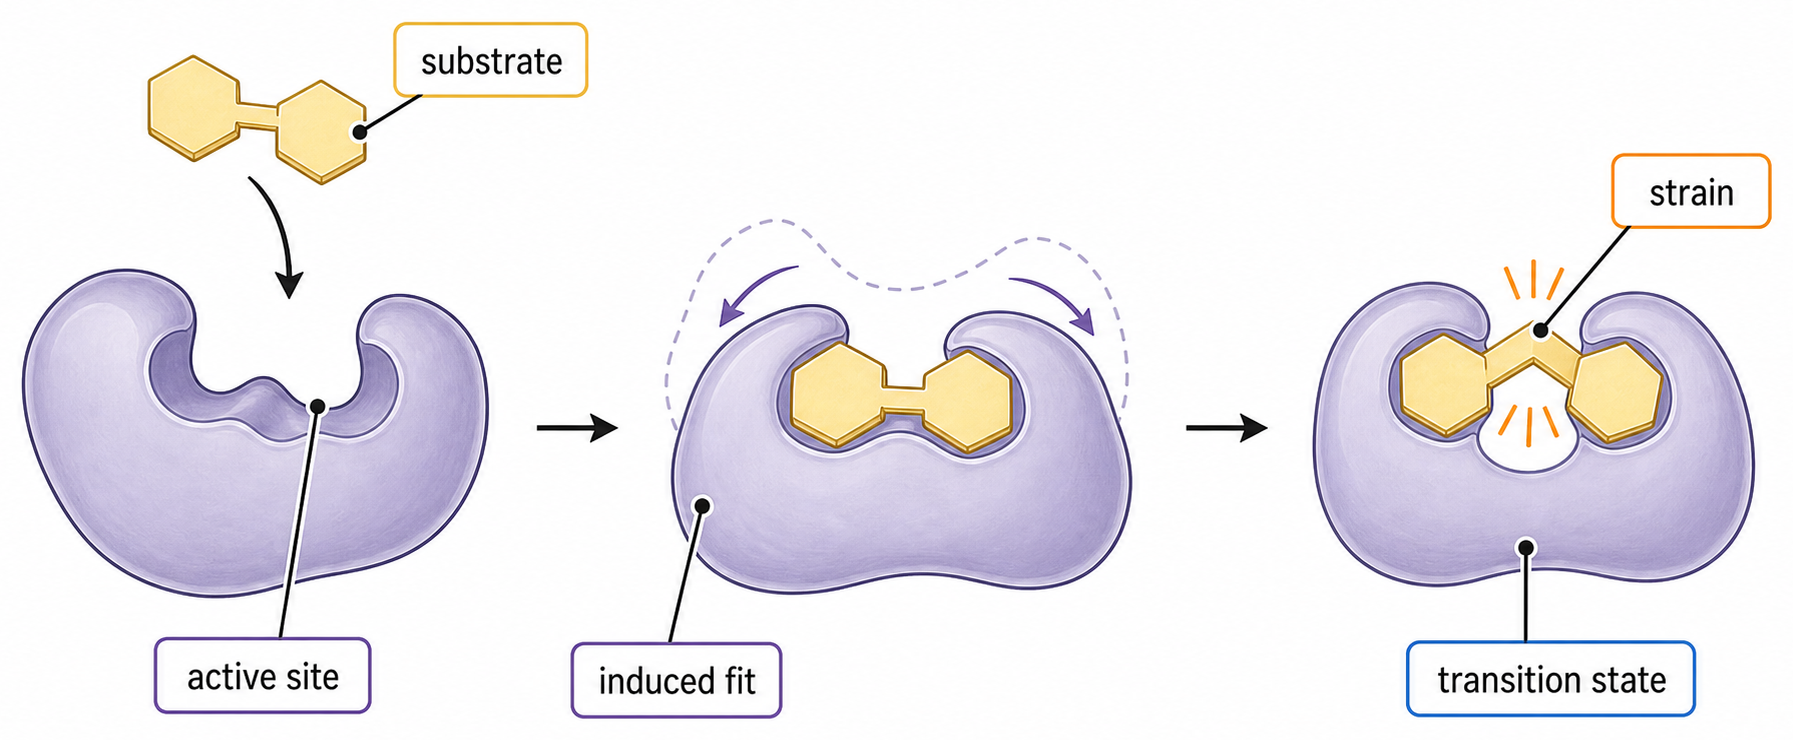
In induced-fit binding, initial substrate contact changes the conformation of both the enzyme active site and the substrate, producing a catalytically effective fit.

Enzyme side chains move to align catalytic groups, while the substrate can be bent, strained or have bonds polarized. These changes make the transition state easier to reach.

Sequence: initial recognition → enzyme–substrate complex → reciprocal conformational change → transition-state stabilization → products form and leave → enzyme returns to a reusable state.

Hexokinase closes around glucose and ATP, aligning them and excluding water; after phosphate transfer, the differently shaped products have weaker interactions and are released.

Induced fit is not a rigid lock-and-key event and does not mean the enzyme permanently changes. Specificity remains because only suitable substrates trigger productive interactions.

Induced-fit binding

Assessment in practice

2–3 marks
How it is assessed

This objective is assessed through structured response, commonly using Describe / Outline.

Command terms

Describe / Outline

What earns marks

Build the answer around this relationship: Induced fit involves a shape change when substrate binds.

Representative question

Question 1

[Maximum number: 6]

Describe the lock and key model of enzyme activity and how the induced fit model extends it.

Molecular Motion Enables Enzyme Encounters

Enzyme catalysis requires random molecular motion to bring a substrate into a productive collision with an active site.

Higher kinetic energy increases motion and collision frequency up to the point where enzyme structure becomes unstable. A collision must also have suitable orientation and enough energy for binding and reaction.

Sometimes a large substrate is effectively immobilized, so enzyme molecules diffuse to exposed sites. In other systems the enzyme is immobilized in a membrane, and moving substrate molecules collide with its fixed active sites.

A membrane-embedded enzyme remains in one location while dissolved substrate diffuses through the membrane environment and collides with the active site.

Immobilized does not mean inactive, and faster motion alone cannot guarantee catalysis: molecular complementarity, orientation and enzyme conformation still matter.

Molecular motion

Assessment in practice

1 marks
How it is assessed

This objective is assessed through multiple choice, commonly using Identify.

Command terms

Identify

What earns marks

Build the answer around this relationship: Substrates must collide with enzyme active sites for catalysis.

Representative question

Question 1

[Maximum number: 1]

Which statement applies to enzymes?

A

Enzyme function depends on collisions between substrate and active sites.

B

One active site typically binds to a broad range of substrates.

C

The active site on the substrate is specific to one enzyme.

D

When enzymes are immobilized they stop working.

Small Structural Changes Can Alter Enzyme Function

Substrate specificity depends on the three-dimensional arrangement and chemistry of amino acids in the active site; denaturation disrupts that arrangement and lowers activity.

A suitable substrate forms complementary shape, charge, polarity and hydrogen-bond interactions. Temperature extremes or unsuitable pH can disrupt bonds maintaining tertiary structure, changing the active site's geometry.

Trace the relationship: amino-acid interactions maintain fold → fold positions active-site residues → substrate binds specifically → catalysis occurs. Denaturation breaks this chain without normally hydrolysing peptide bonds.

If heating moves a charged catalytic residue away from the substrate-binding position, fewer enzyme–substrate complexes form and the reaction rate falls even after the solution is cooled.

Denaturation is a structural loss, not simply temporary active-site occupancy. The protein may remain present and its peptide sequence intact while its function is lost.

Relationships between structure and function

Assessment in practice

2–6 marks
How it is assessed

This objective is assessed through structured response, commonly using Explain.

Command terms

Explain

What earns marks

Build the answer around this relationship: Active-site structure determines which substrates can bind.

Representative question

Question 1

[Maximum number: 6]

Some proteins in membranes act as enzymes. Outline enzyme-substrate specificity.

Temperature, pH and Concentration Set Enzyme Rate

Enzyme activity depends on temperature, pH, substrate concentration and enzyme concentration within an appropriate range.

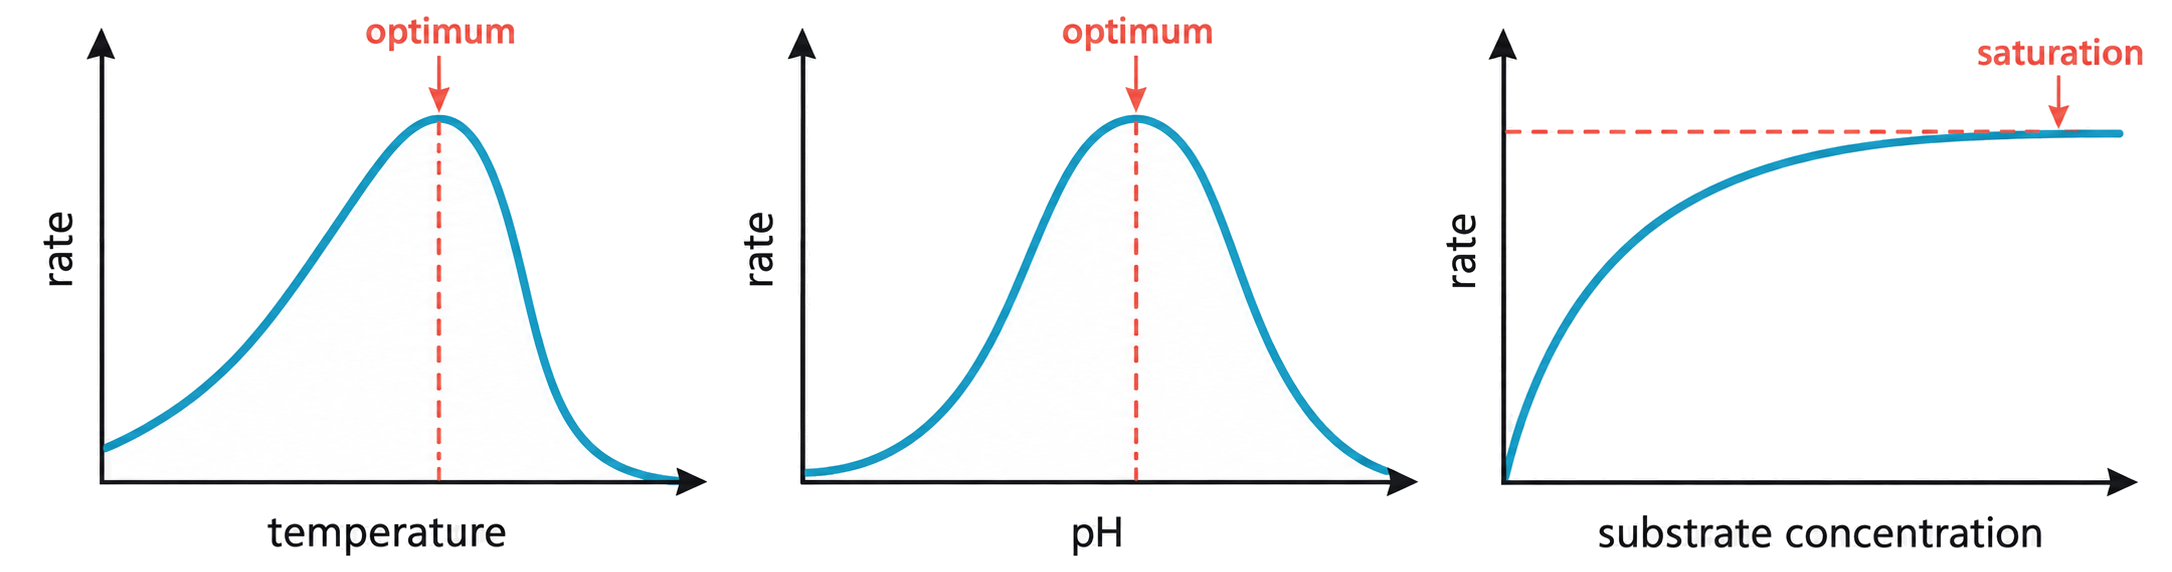
Warming usually increases collisions until bonds in the protein are disrupted; pH changes alter ionization and active-site interactions. More substrate or enzyme increases rate only while another factor is not limiting.

Interpret a rate curve by locating:

  • optimum region
  • limiting factor
  • denaturation or inhibition
  • plateau from saturated active sites

Increasing substrate raises rate until every active site is occupied; further substrate then produces little additional increase.

The optimum is not a universal constant: it depends on the enzyme’s structure and cellular environment.

Effects on enzyme activity

Assessment in practice

1–2 marks
How it is assessed

This objective is assessed through structured response, commonly using Explain / Outline / Describe.

Command terms

Explain / Outline / Describe / Determine / Compare / Evaluate / Suggest / Sketch / Label

What earns marks

Build the answer around this relationship: Temperature increases collision frequency up to an optimum before denaturation lowers activity.

Representative question

Question 1

[Maximum number: 8]

Explain the effect of changes of pH , substrate concentration and temperature on enzyme activity.

Measure Enzyme Reactions through a Changing Signal

An enzyme reaction rate is measured from the change in substrate or product concentration per unit time.

Choose a signal proportional to concentration, keep conditions controlled and use the initial linear section before substrate depletion or product inhibition changes the rate.

A sound measurement includes:

  • dependent signal and calibration
  • controlled temperature and pH
  • initial-rate interval
  • repeats and uncertainty

A colorimeter can track product colour every ten seconds; the slope of absorbance against time estimates the initial rate.

A final product amount alone cannot distinguish a fast reaction from a slow reaction allowed to run longer.

Measuring enzyme reactions

Assessment in practice

1–2 marks
How it is assessed

This objective is assessed through experimental design, commonly using Calculate / Suggest / Identify.

Command terms

Calculate / Suggest / Identify / Describe / Outline / Evaluate / Deduce / Discuss / State

What earns marks

Build the answer around this relationship: Enzyme activity can be measured through product formation or substrate disappearance.

Representative question

Question 1

[Maximum number: 3]

Suggest how the percentage of decolorization could be obtained experimentally.

Enzymes Lower Activation Energy

Enzymes lower activation energy by providing an alternative reaction pathway that stabilizes the transition state; reactant and product energy levels remain unchanged.

Energy must be supplied to distort or break bonds in substrate before new product bonds can form. Bond formation then releases energy; the balance between starting and ending states determines the overall energy change.

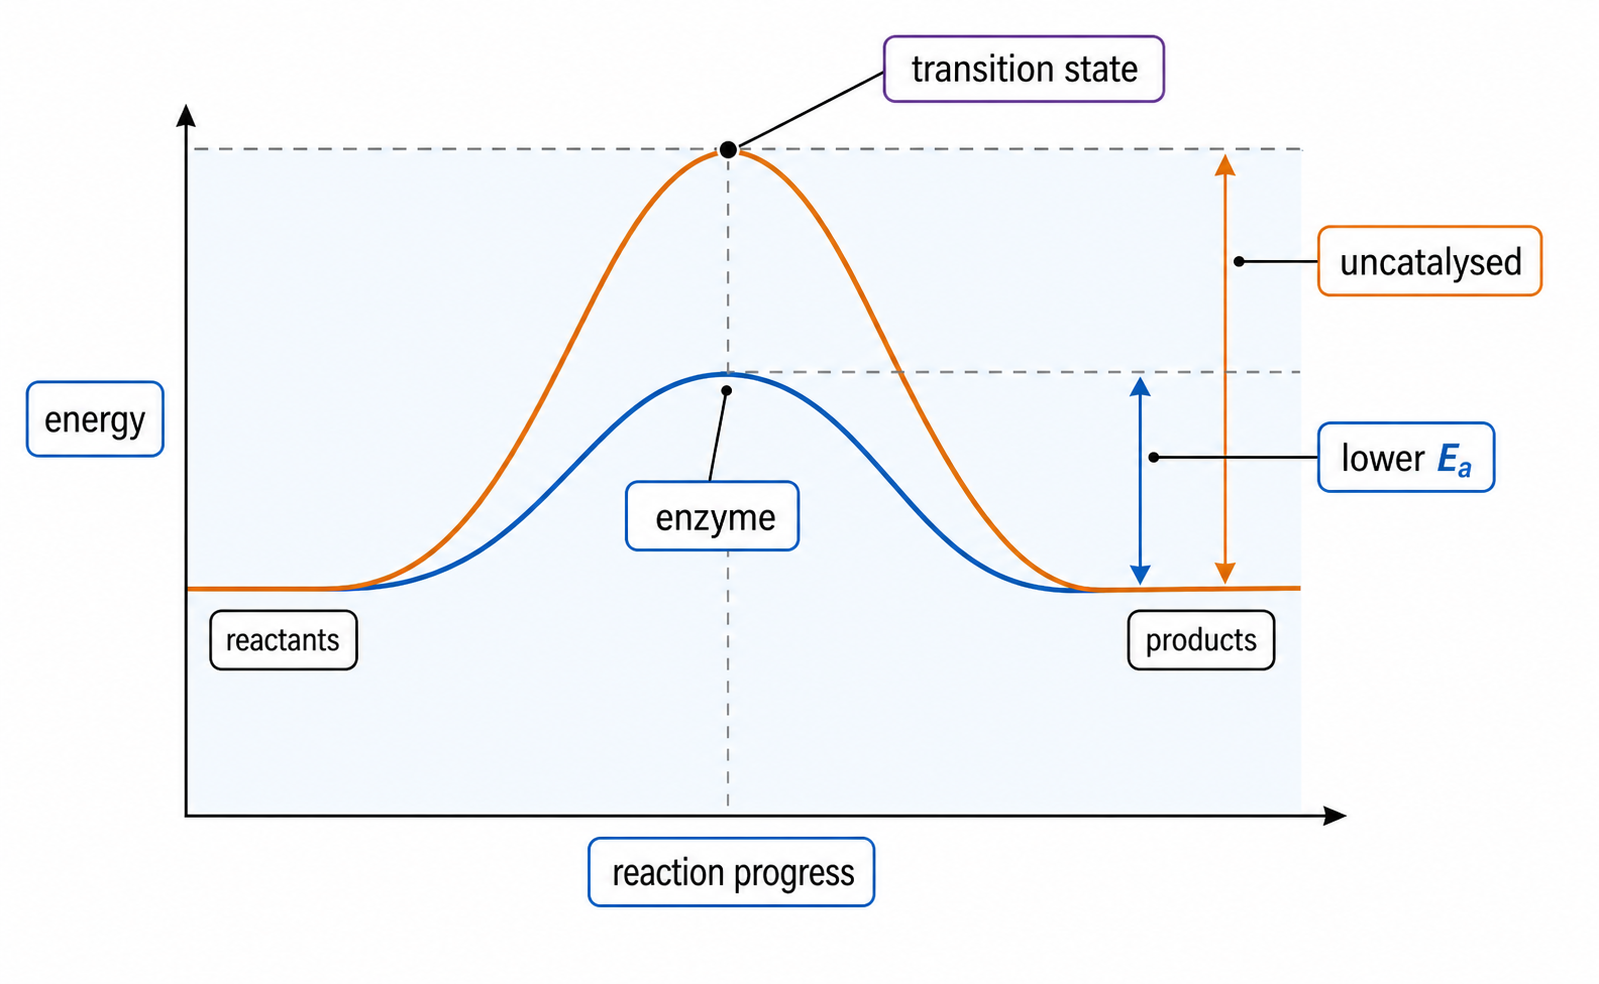
On an energy profile, catalysed and uncatalysed curves begin and end at the same levels, but the catalysed curve has a lower peak. More molecules can reach that lower transition-state barrier at the same temperature.

Read the vertical gap from reactants to the peak as activation energy: the enzyme reduces this gap but does not alter the vertical difference between reactants and products.

An enzyme does not remove the barrier, add net energy or make an endergonic reaction exergonic. It changes rate, not the equilibrium position.

Effect of enzymes on activation energy

Assessment in practice

1 marks
How it is assessed

This objective is assessed through multiple choice, commonly using Predict / Identify.

Command terms

Predict / Identify

What earns marks

Build the answer around this relationship: Enzymes lower the activation energy required for reaction.

Representative question

Question 1

[Maximum number: 1]

The graph shows energy changes during a reaction both with and without an enzyme present.

Which statement correctly identifies two of the regions labelled X, Y and Z in the graph?

A

X is the activation energy with an enzyme and Z is the net energy released from the reaction.

B

X is the energy released from the reaction and Y is the activation energy with an enzyme.

C

Y is the energy released with an enzyme and Z is the energy released when bonds are broken.

D

Y is the activation energy with an enzyme and Z is the net energy released.

Enzyme Catalysis and Rate

Enzymes are biological catalysts that lower activation energy and remain unchanged. Their globular protein shape creates active-site specificity; induced fit aligns substrates; molecular motion and collisions affect rate; temperature, pH, and substrate concentration change activity; assays measure substrate loss or product formation over time.

  • Define enzyme as biological catalyst, effective in small amounts and unchanged.
  • Use active site, specificity, induced fit, ES complex, and activation energy in mechanism answers.
  • Use curve shapes: temperature optimum/denaturation, pH optimum, and substrate saturation plateau.
  • For practicals, state what is measured per unit time and use initial rate, controls, and replicates.

Topic C1.2

C1.2 Cell respiration

Cell respiration transfers energy from organic compounds into ATP through glycolysis, anaerobic pathways and aerobic mitochondrial stages, supporting usable cellular work and measurable biological activity.

44% of analysed papers 62 papers · 102 questions

Objectives in this topic

ATP Delivers Small, Usable Energy Payments

ATP—adenosine triphosphate—is a small soluble nucleotide that distributes energy between energy-releasing reactions and energy-requiring cell work.

ATP can move within the cell, release a manageable amount of energy rapidly by hydrolysis and transfer its terminal phosphate to coupled reactions. It is continuously regenerated rather than stored in large quantities.

Its adenine, ribose and three-phosphate structure supports reversible cycling with ADP. Respiration supplies energy to form ATP; ATP hydrolysis then drives transport, synthesis or movement near the point of use.

A membrane pump couples ATP hydrolysis to a conformational change that moves ions against an electrochemical gradient, while ADP and phosphate are returned to ATP-producing pathways.

ATP is an energy-transfer currency, not the original source of energy and not long-term energy storage. Energy comes from reactions such as respiration and is partly transferred through ATP.

ATP distributes energy

Assessment in practice

1–3 marks
How it is assessed

This objective is assessed through structured response, commonly using Identify / Explain.

Command terms

Identify / Explain

What earns marks

Build the answer around this relationship: ATP stores and distributes usable energy within cells.

Representative question

Question 1

[Maximum number: 3]

Explain the properties of ATP that make it useful for distributing energy within cells.

Use And Recycle ATP

ATP hydrolysis/phosphorylation cycle with examples of cell work.

Hydrolysis of adenosine triphosphate (ATP) to adenosine diphosphate (ADP) and inorganic phosphate releases energy that can be coupled to cell work.

Energy from respiration is required to phosphorylate ADP + phosphate back to ATP. Rapid ATP ↔ ADP cycling links energy-yielding reactions to energy-requiring processes without requiring a large ATP store.

ATP supplies active transport across membranes, anabolic synthesis of macromolecules, movement of whole cells and movement of components such as chromosomes or motor proteins.

ATP hydrolysis powers a membrane pump; respiration then provides energy for ADP + Pi → ATP, allowing the same carrier system to support another round of transport.

ATP hydrolysis releases sufficient energy for many cell tasks, but a numerical kilojoule value is not required. ATP is recycled rather than used once.

Life processes using ATP

Assessment in practice

1–2 marks
How it is assessed

This objective is assessed through structured response, commonly using Identify / Explain / Outline.

Command terms

Identify / Explain / Outline / State

What earns marks

Build the answer around this relationship: ATP supplies energy for active transport across membranes.

Representative question

Question 1

[Maximum number: 5]

Outline, with examples, the wide range of uses of adenosine triphosphate (ATP) in cells.

ATP ↔ ADP interconversions

Assessment in practice

1–3 marks
How it is assessed

This objective is assessed through multiple choice, commonly using Identify / State.

Command terms

Identify / State

What earns marks

Build the answer around this relationship: ATP hydrolysis releases energy for cellular work.

Representative question

Question 1

[Maximum number: 1]

Which reaction does not cause a net release of energy?

A

ADP combines with inorganic phosphate to form ATP

B

ATP releases inorganic phosphate to form ADP

C

Loss of hydrogen from reduced NAD

D

Oxidation of reduced FAD

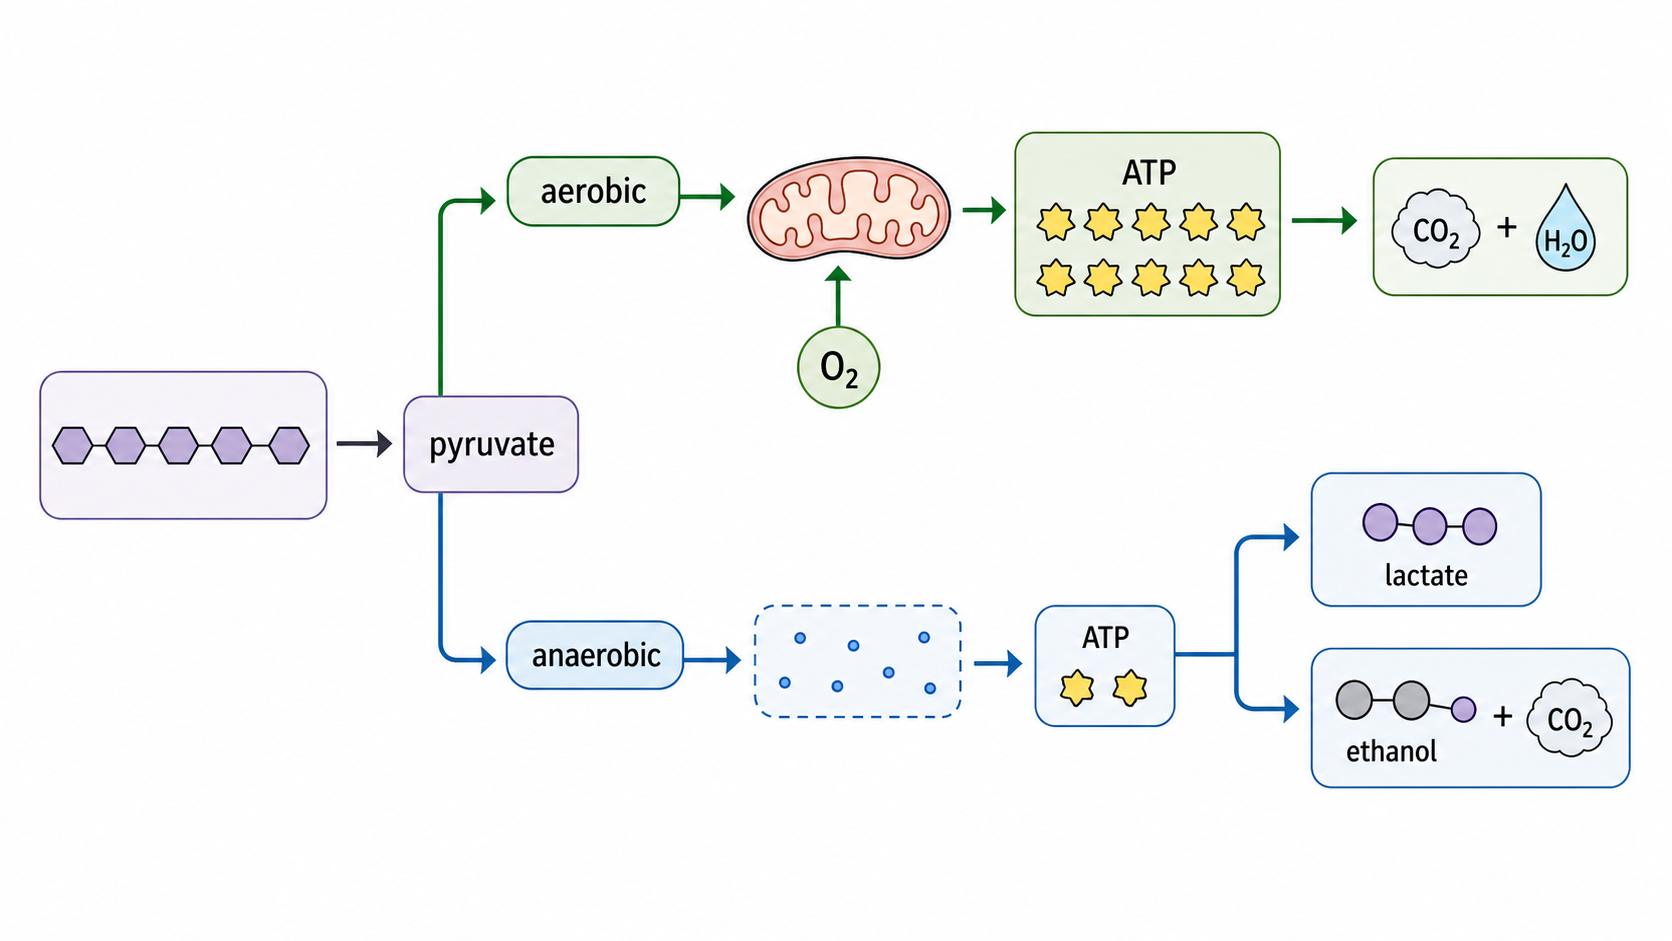
Aerobic and anaerobic respiration

Aerobic and anaerobic respiration compared by location, oxygen use, products, and ATP yield.

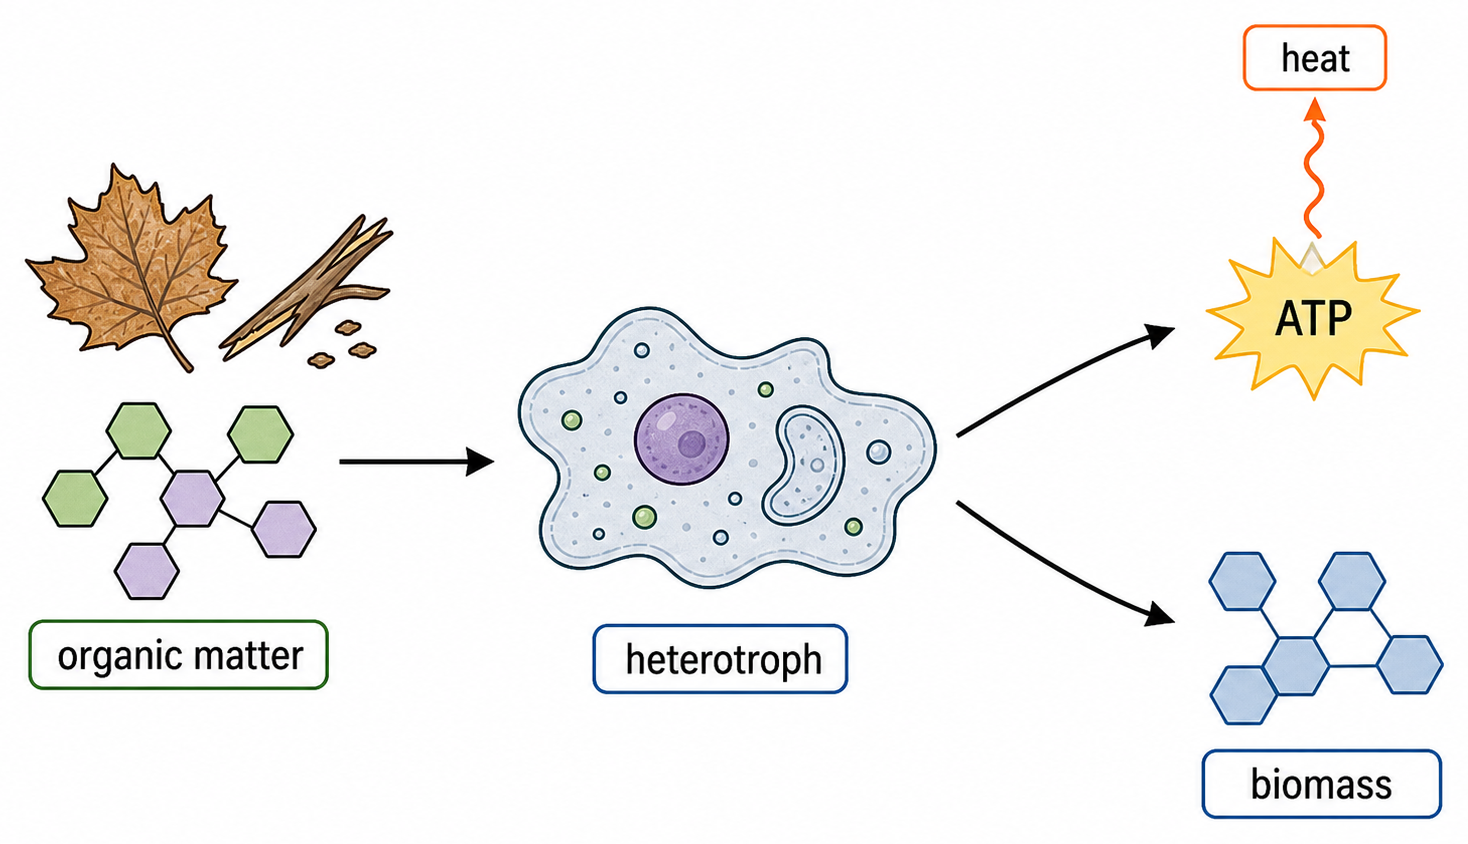
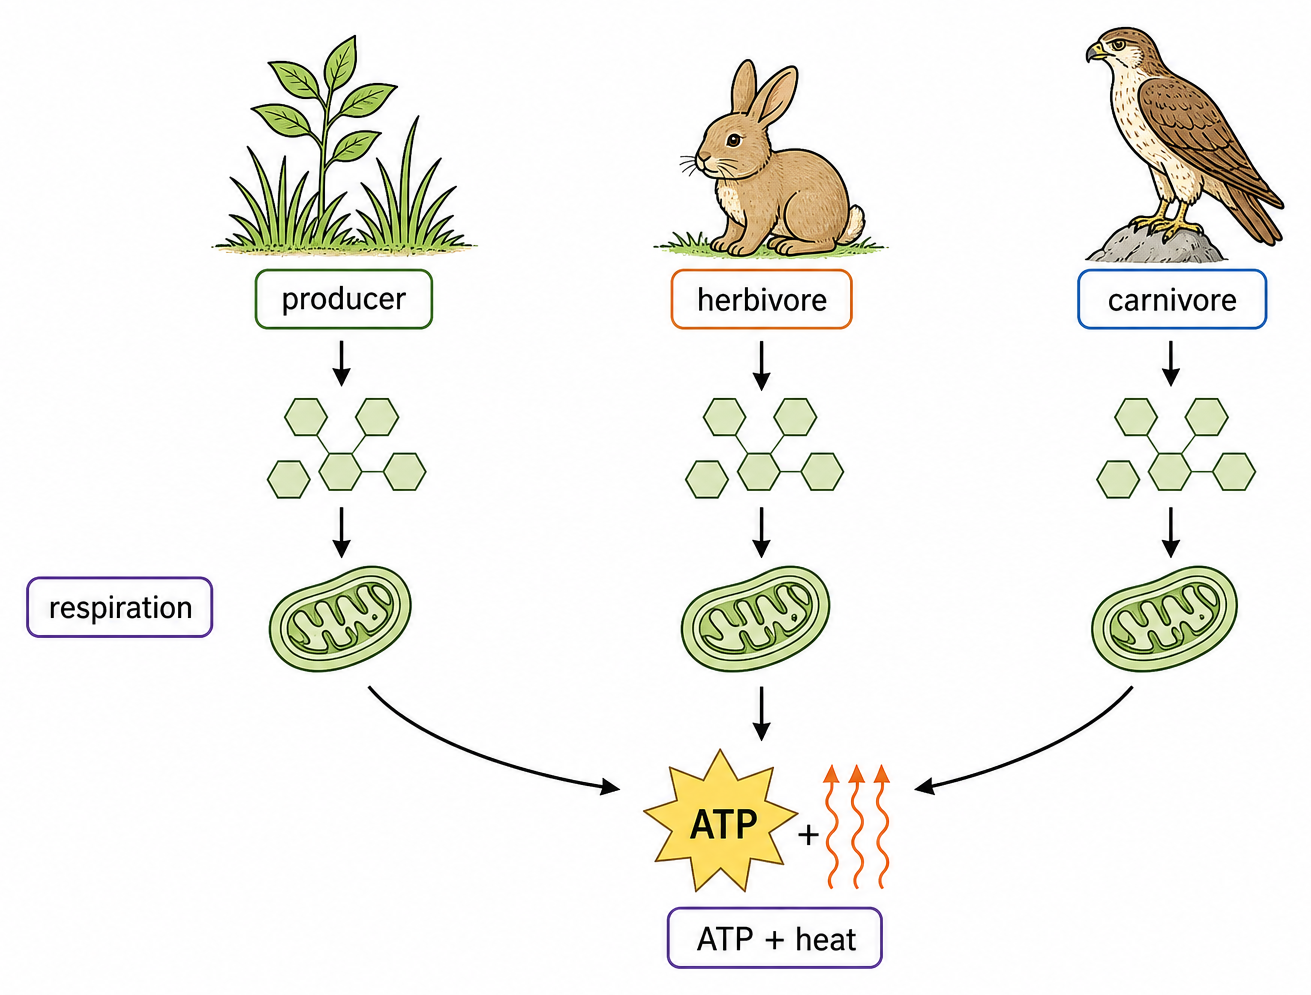
Cell respiration is an enzyme-controlled system that transfers energy released from carbon compounds into ATP; glucose and fatty acids are major substrates, although other organic compounds can also be used.

Feature in humans Aerobic respiration Anaerobic respiration
Oxygen Required Not required
Substrate Glucose, fatty acids and other organics Carbohydrate/glucose
Location Glycolysis in cytoplasm; later stages in mitochondria Cytoplasm only
ATP yield High Low: net 2 ATP per glucose
Waste products Carbon dioxide and water Lactate

Word equations: glucose + oxygen → carbon dioxide + water; glucose → lactate. In both cases energy released is transferred to ATP, but mitochondrial aerobic stages produce far more.

Cell respiration is chemical energy transfer inside cells; gas exchange is movement of oxygen and carbon dioxide across a surface. Mitochondria are required for aerobic but not human anaerobic respiration.

Cell respiration system

Assessment in practice

1–3 marks
How it is assessed

This objective is assessed through structured response, commonly using Identify / Outline / Distinguish.

Command terms

Identify / Outline / Distinguish / Suggest / Explain / Define / Compare / Describe

What earns marks

Build the answer around this relationship: Cell respiration releases energy from organic compounds to form ATP.

Representative question

Question 1

[Maximum number: 8]

Explain the need for energy in cells and how energy is released through cell respiration.

Anaerobic vs. aerobic respiration in humans

Assessment in practice

1–2 marks
How it is assessed

This objective is assessed through structured response, commonly using State / Compare / Identify.

Command terms

State / Compare / Identify / Distinguish / Outline / Explain / Suggest

What earns marks

Build the answer around this relationship: Aerobic respiration requires oxygen and uses mitochondria.

Representative question

Question 1

[Maximum number: 8]

Carbon dioxide is released during cell respiration. Explain anaerobic and aerobic respiration.

Respiration Rate Depends on Limiting Conditions

Cell-respiration rate can be measured as substrate use or product formation per unit time, with results normalized when organisms differ in mass or number.

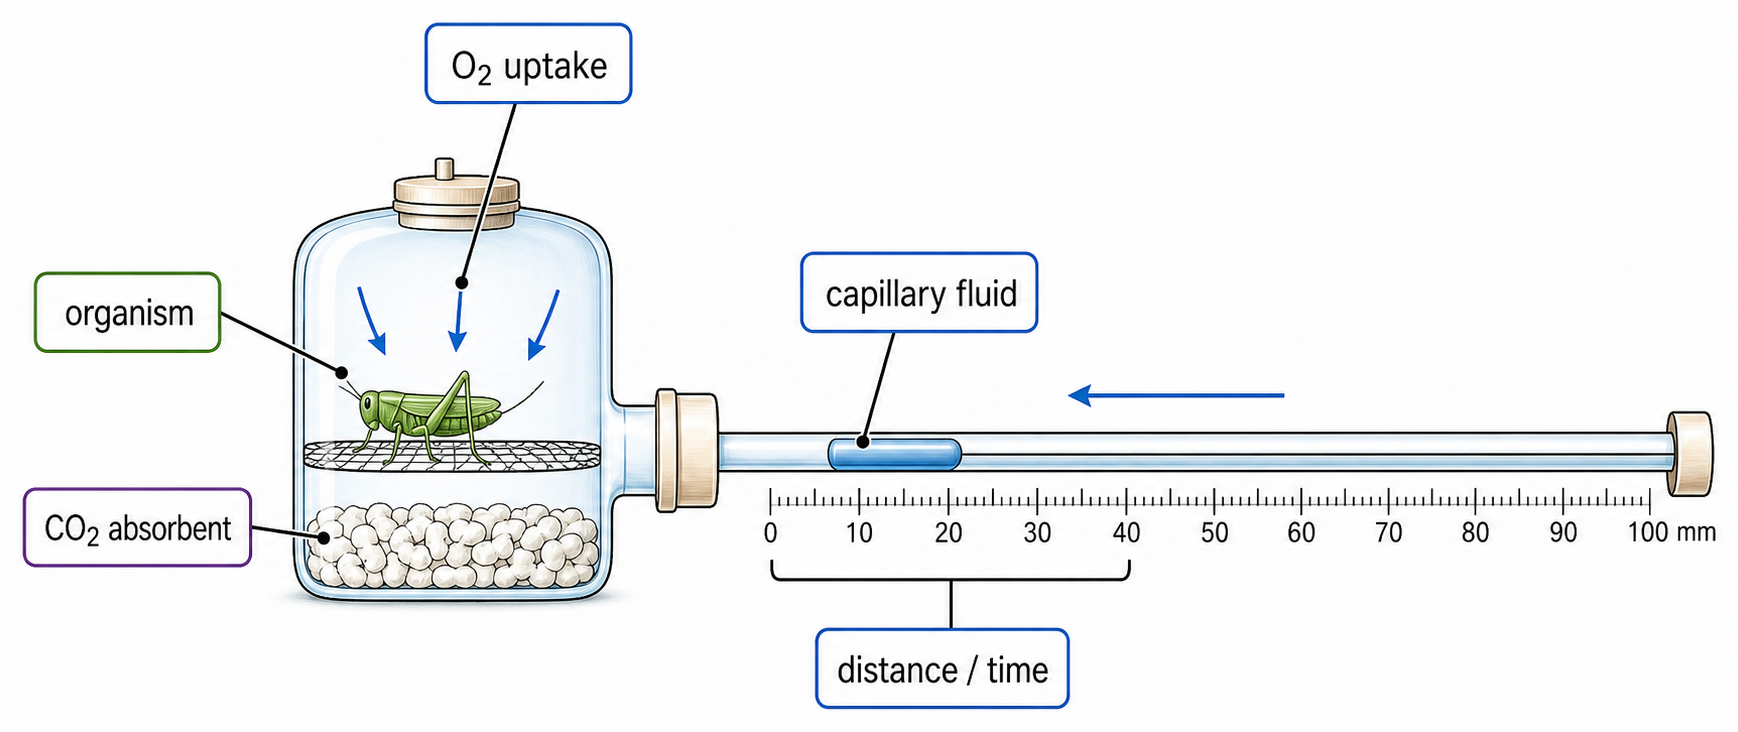
In a respirometer, soda lime absorbs carbon dioxide, so a pressure or gas-volume decrease reflects oxygen uptake. Keep temperature constant in a water bath and use a control without respiring material to correct for non-biological pressure changes.

Respirationrate=changeinoxygenvolume÷time.Massspecificrate=changeinoxygenvolume÷(time×organismmass),withunitssuchascm3O2g1min1.Respiration rate = change in oxygen volume ÷ time. Mass-specific rate = change in oxygen volume ÷ (time × organism mass), with units such as cm³ O₂ g⁻¹ min⁻¹.

Use the calibrated capillary displacement to find oxygen-volume change, subtract the control change, divide by elapsed time, then divide by sample mass if samples are being compared.

A respirometer measures oxygen uptake only when carbon dioxide is appropriately absorbed and the system is sealed. Temperature, pressure, mass, activity and acclimation time must be controlled.

Variables affecting rate

Assessment in practice

1 marks
How it is assessed

This objective is assessed through structured response, commonly using Suggest / Explain / State.

Command terms

Suggest / Explain / State / Describe / Identify / Outline / Calculate

What earns marks

Build the answer around this relationship: Respiration rate can be measured from oxygen uptake or carbon dioxide production over time.

Representative question

Question 1

[Maximum number: 3]

Describe how the apparatus measures the oxygen consumption of the mouse.

SL Transfer: Explain Core Respiration

ATP is the immediate energy carrier; hydrolysis powers cell work and phosphorylation reloads ATP. Cell respiration transfers energy from carbon compounds into ATP in controlled steps. Aerobic respiration in humans uses oxygen and mitochondria for high ATP yield, while anaerobic respiration in cytoplasm produces lactate and low ATP. Rate evidence comes from oxygen uptake or carbon dioxide production per unit time. Examples include membrane pumps, macromolecule synthesis, and chromosome movement. Rate depends on metabolic demand, organism size, oxygen, substrate, temperature, and pH.

  • Use ATP as the link between respiration and life processes such as active transport, biosynthesis, movement, and homeostasis.
  • Compare aerobic and anaerobic respiration by oxygen use, location, ATP yield, and product in humans.
  • For rate questions, name the variable, measurement per unit time, and controlled variables.

Topic C1.3

C1.3 Photosynthesis

Photosynthesis converts light energy into chemical energy by using pigments, thylakoid reactions and Calvin-cycle carbon fixation to build organic compounds from carbon dioxide.

51% of analysed papers 72 papers · 104 questions

Objectives in this topic

Photosynthesis Converts Light into Chemical Energy

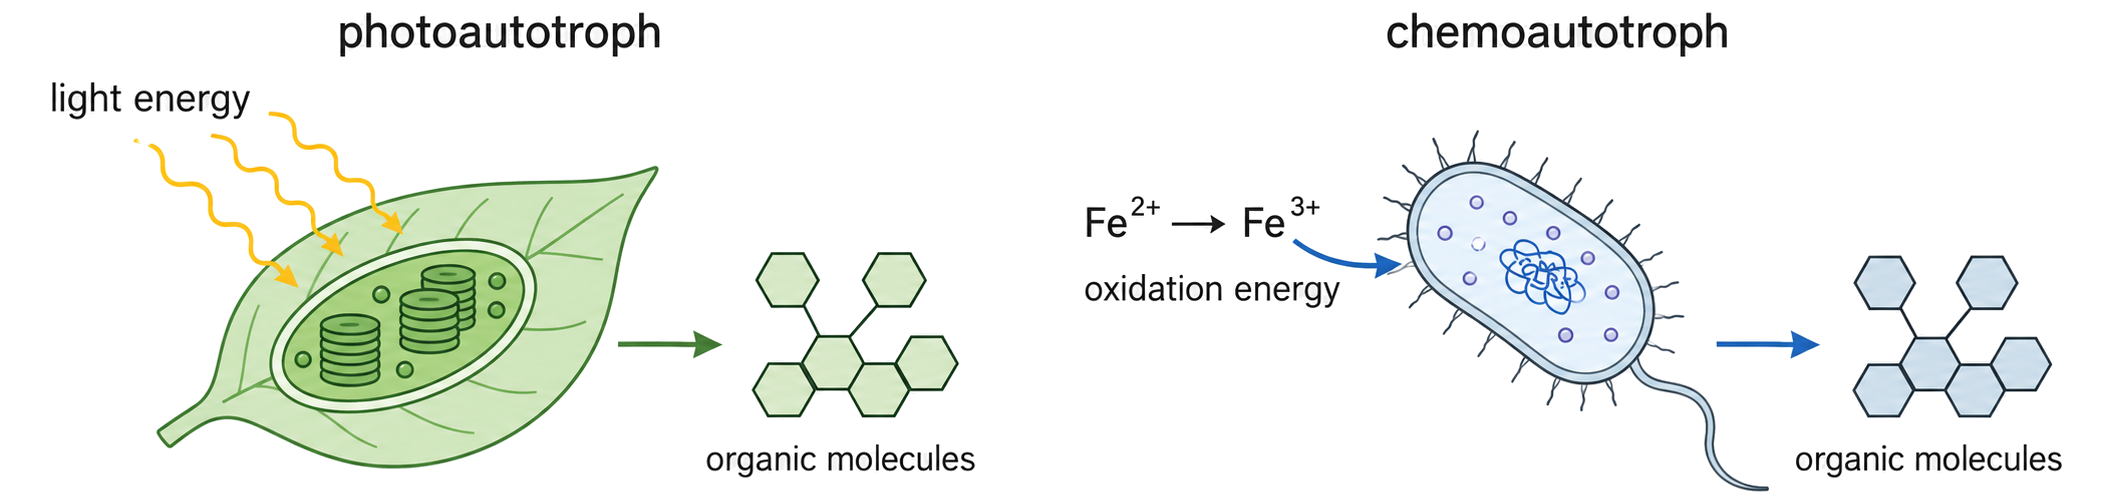
Photosynthesis captures light energy and stores it as chemical energy in organic molecules.

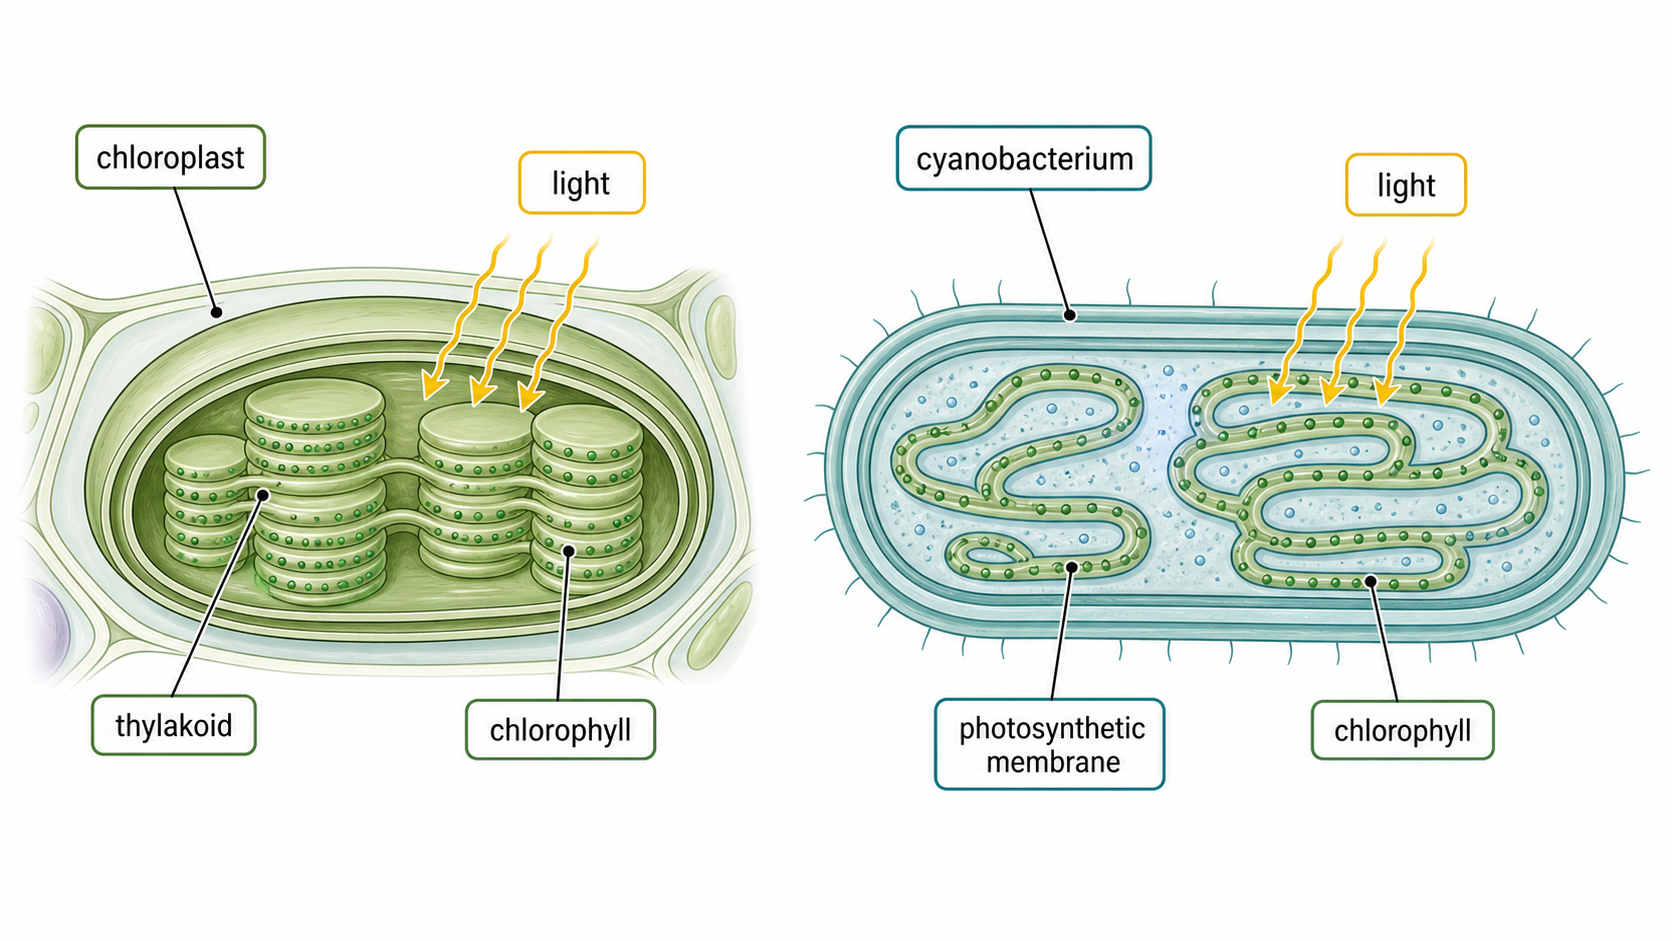
Pigments absorb photons and excite electrons; electron transfer creates ATP and reduced NADP, which then drive carbon fixation. The process depends on light, pigments, membranes, water, carbon dioxide and suitable conditions.

Trace the energy conversion:

  • photon absorbed by pigment
  • electron transfer and proton gradient
  • ATP and reduced NADP formed
  • carbon compounds synthesized

A leaf exposed to light can use ATP and reduced NADP from the thylakoid reactions to build carbohydrate in the stroma.

Light provides energy but is not itself converted directly into glucose molecules.

Light energy → chemical energy

Assessment in practice

1–7 marks
How it is assessed

This objective is assessed through structured response, commonly using Identify / State / Outline.

Command terms

Identify / State / Outline / Describe / Explain / Distinguish

What earns marks

Build the answer around this relationship: Chlorophyll and other pigments absorb light energy inside chloroplasts.

Representative question

Question 1

[Maximum number: 8]

Explain the processes by which light energy is converted into chemical energy.

Photosynthesis equation and oxygen

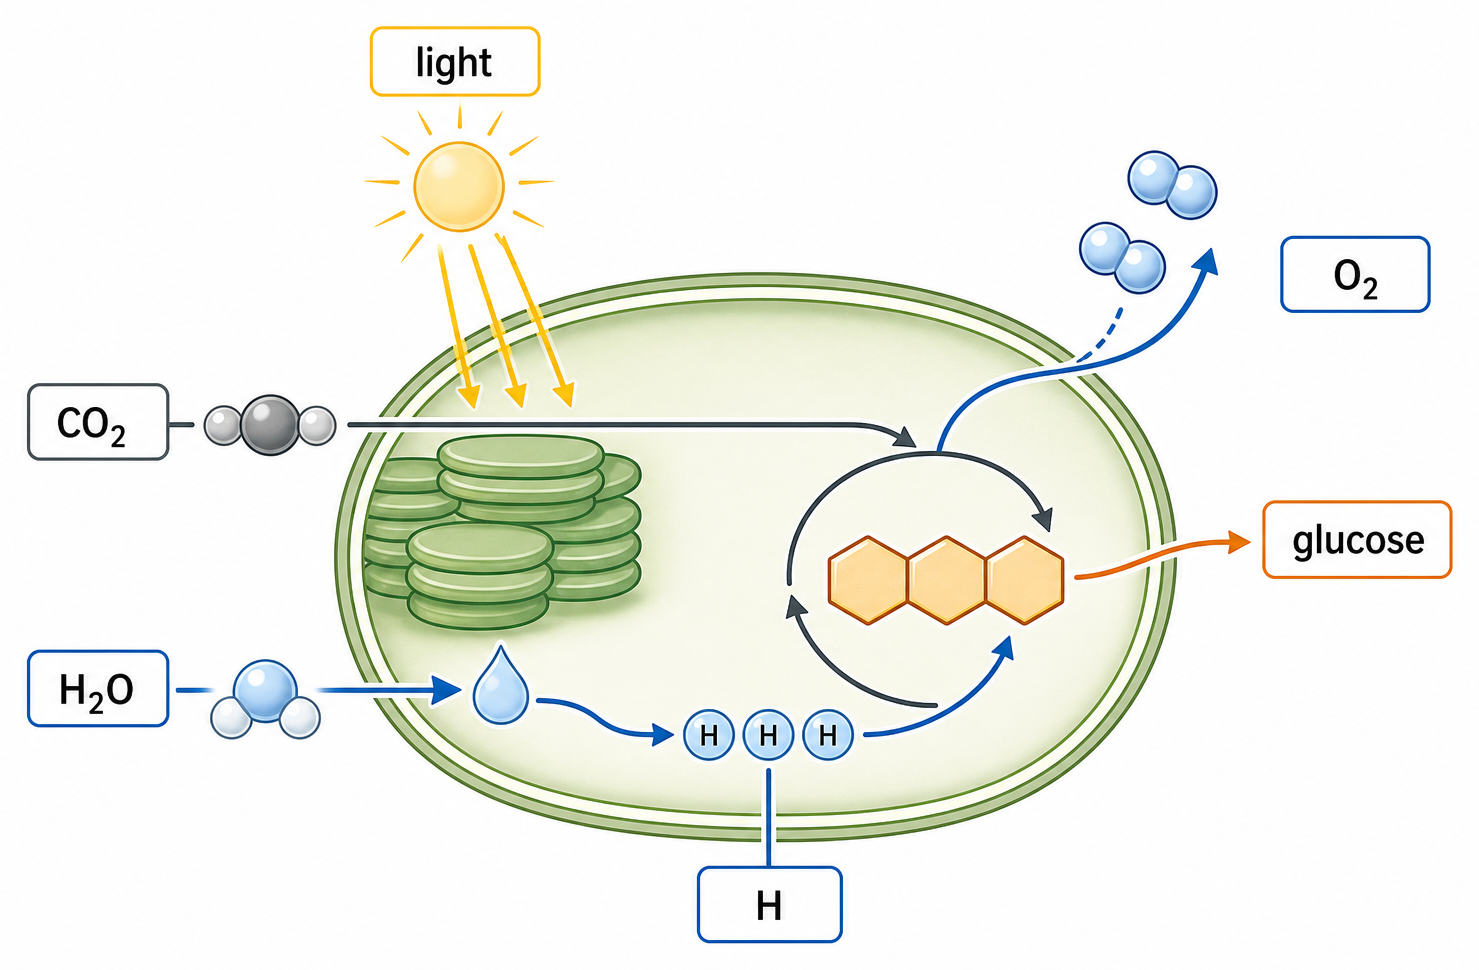
Simple source-flow diagram for the photosynthesis equation. Show CO2 flowing to the carbon skeleton of glucose/carbohydrate; H2O splitting into hydrogen used to reduce CO2 and oxygen released as O2; light energy shown as the input that drives the process.

The overall photosynthesis equation shows carbon dioxide and water converted to carbohydrate using light energy: 6CO₂ + 6H₂O → C₆H₁₂O₆ + 6O₂. Carbon dioxide supplies the carbon skeleton and is reduced using hydrogen derived from water. Oxygen is released when water is split by photolysis in the light-dependent reactions, not directly from CO₂. Glucose represents a carbohydrate product; the products can be used to make starch, sucrose and other organic compounds.

  • Word equation: carbon dioxide + water → glucose + oxygen, using light energy.
  • Symbol equation: 6CO₂ + 6H₂O → C₆H₁₂O₆ + 6O₂.
  • O₂ comes from photolysis of H₂O.
  • Plants, algae and cyanobacteria perform oxygenic photosynthesis.

CO₂ → glucose

Assessment in practice

1–4 marks
How it is assessed

This objective is assessed through structured response, commonly using State / Outline / Predict.

Command terms

State / Outline / Predict / Suggest

What earns marks

Build the answer around this relationship: Carbon dioxide is the source of carbon for photosynthetic carbohydrates.

Representative question

Question 1

[Maximum number: 4]

Outline how photosynthesis produces glucose.

Oxygen as by-product

Assessment in practice

1 marks
How it is assessed

This objective is assessed through multiple choice, commonly using State.

Command terms

State

What earns marks

Build the answer around this relationship: Photolysis splits water during the light-dependent reactions.

Representative question

Question 1

[Maximum number: 1]

Which group(s) produce(s) oxygen as a by-product of photosynthesis?

I. Algae
II. Cyanobacteria
III. Fungi

A

I only

B

I and II only

C

II and III only

D

I, II and III

Pigments Separate by Solubility and Polarity

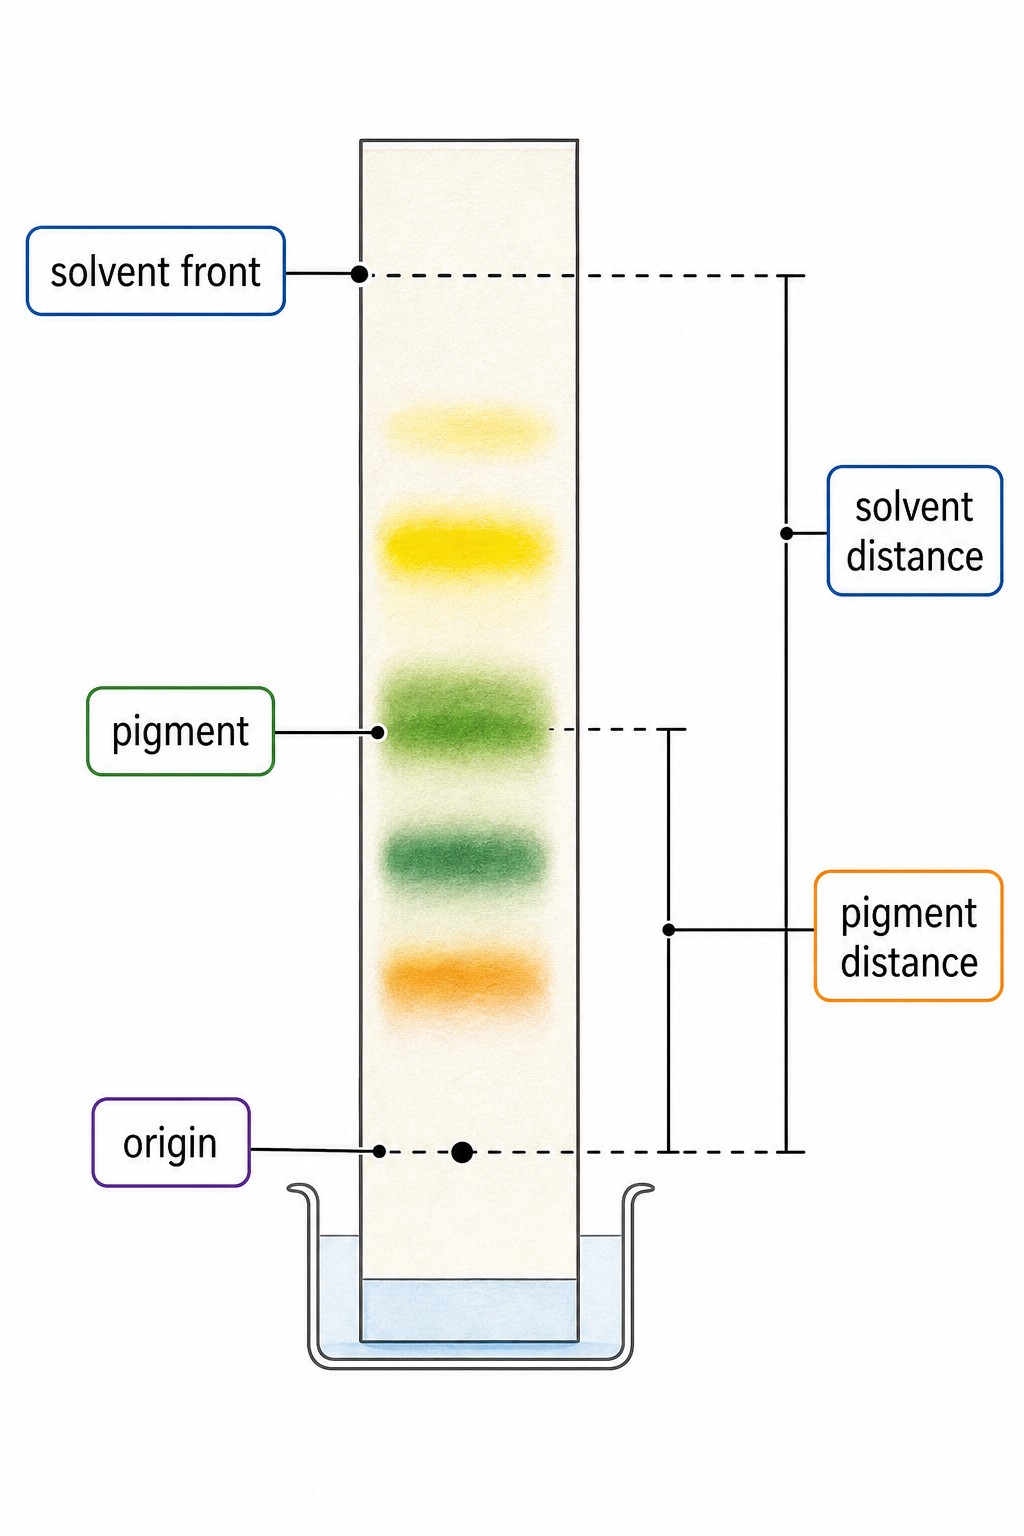
Photosynthetic pigments can be separated and identified because they differ in solubility in the mobile solvent and attraction to the stationary phase.

Extract pigments, place a small concentrated spot on paper or a thin-layer plate, keep the spot above the solvent, allow the solvent front to rise, then mark the solvent front immediately and observe the separated bands.

Rf=distancetravelledbypigment÷distancetravelledbysolventfrontRf = distance travelled by pigment ÷ distance travelled by solvent front

If a pigment travels 4.2 cm while the solvent front travels 6.0 cm, Rf = 4.2 ÷ 6.0 = 0.70. Identify a pigment using both its colour and an Rf reference obtained with the same solvent and stationary phase.

Rf has no unit and normally lies between 0 and 1. It depends on the solvent and stationary phase, so an Rf from different conditions is not a secure identification; band distance alone is not pigment abundance.

Photosynthetic pigment separation

Assessment in practice

1–2 marks
How it is assessed

This objective is assessed through structured response, commonly using Identify / State / Outline.

Command terms

Identify / State / Outline / Describe / Explain

What earns marks

Build the answer around this relationship: Chromatography separates pigments because they move different distances with the solvent.

Representative question

Question 1

[Maximum number: 3]

Describe the process used to obtain this chromatogram.

Absorption and action spectra

Absorption versus action spectra.

An absorption spectrum shows the proportion of each wavelength absorbed by a pigment; an action spectrum shows the measured rate or effectiveness of photosynthesis at each wavelength.

Only photons with suitable energies are absorbed and excite electrons in pigment molecules. Chlorophylls and accessory pigments absorb different wavelength ranges, so their combined absorption helps explain the action spectrum.

Plot wavelength in nanometres, with the corresponding light colours, on the horizontal axis. For an action spectrum, calculate photosynthesis rate from oxygen production or carbon-dioxide consumption at each wavelength and plot rate on the vertical axis.

If oxygen production is greatest in blue and red light and lowest in green light, the action spectrum has blue and red peaks that broadly match pigment absorption; accessory pigments can make the curves differ.

Absorption and photosynthesis rate are different dependent variables. Do not label an action-spectrum y-axis as absorbance, and compare rates only when intensity and other limiting factors are controlled.

Absorption of specific wavelengths

Assessment in practice

1–4 marks
How it is assessed

This objective is assessed through structured response, commonly using Describe / Distinguish / Outline.

Command terms

Describe / Distinguish / Outline / Predict / Explain

What earns marks

Build the answer around this relationship: Chlorophyll absorbs blue and red light more strongly than green light.

Representative question

Question 1

[Maximum number: 4]

Outline how plants make use of the different wavelengths of light.

Absorption vs. action spectra

Assessment in practice

1–2 marks
How it is assessed

This objective is assessed through experimental design, commonly using Sketch / Draw / Explain.

Command terms

Sketch / Draw / Explain / Compare / Contrast / Predict / Deduce / Identify

What earns marks

Build the answer around this relationship: Absorption spectra measure light absorbed by pigments at each wavelength.

Representative question

Question 1

[Maximum number: 3]

Draw a fully labelled graph of the action spectrum for photosynthesis.

Test Photosynthesis by Identifying the Limiting Factor

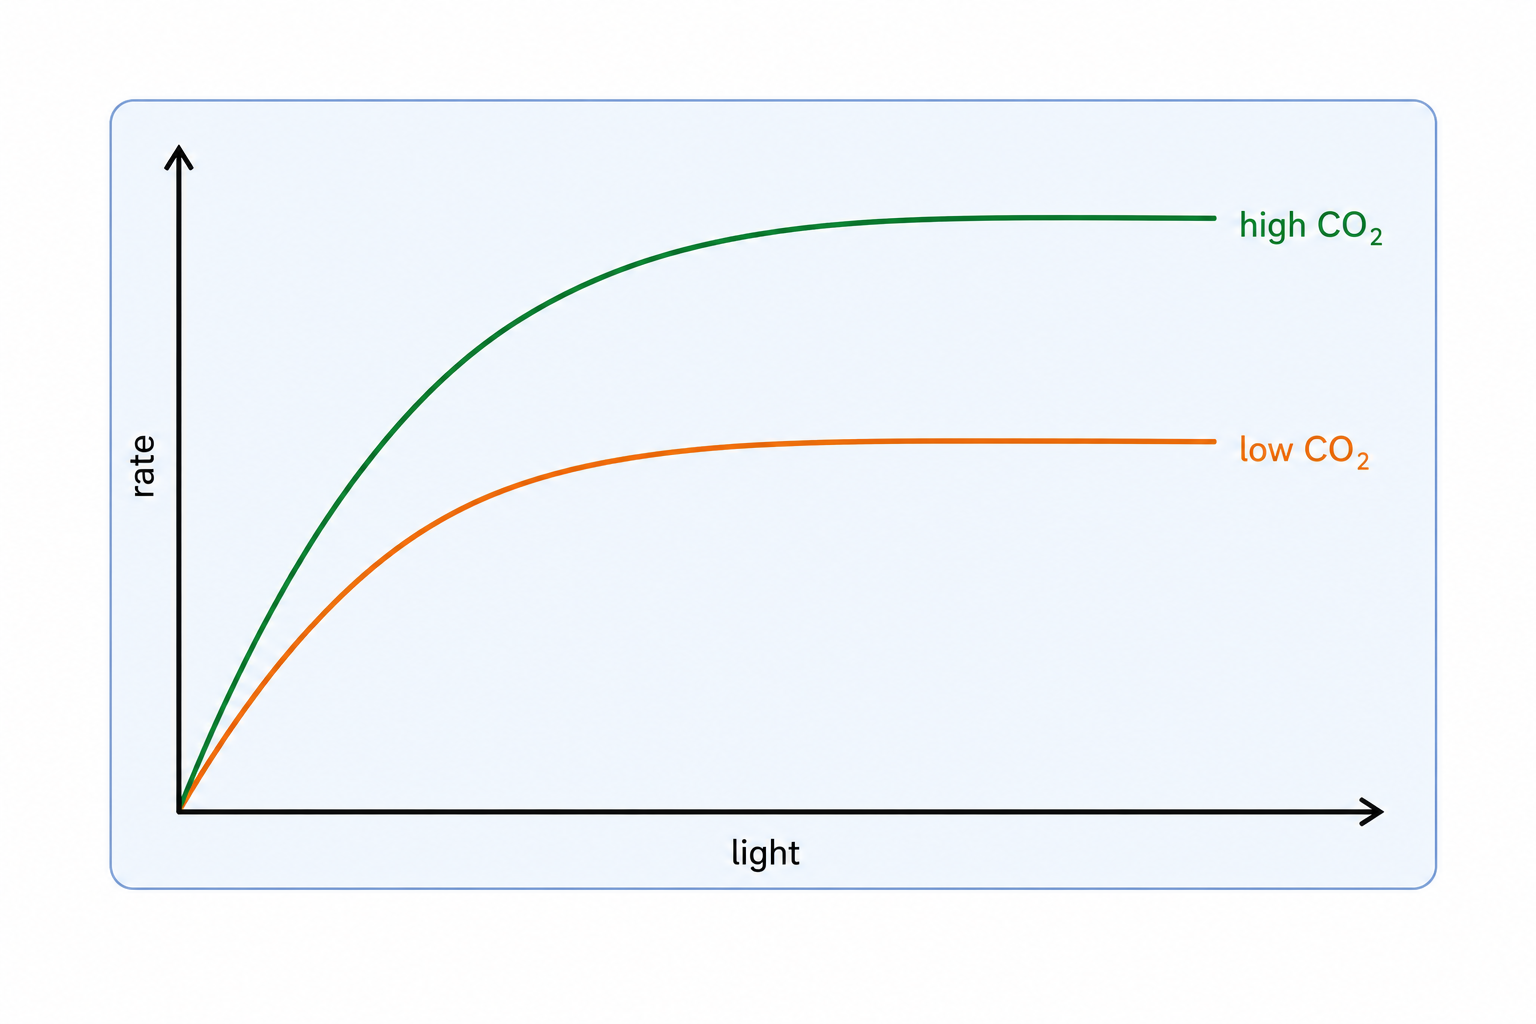
At any moment, the limiting factor is the condition in shortest effective supply relative to photosynthetic demand; increasing it raises rate until another factor becomes limiting.

State a testable hypothesis, vary one independent variable—carbon-dioxide concentration, light intensity or temperature—and measure photosynthesis rate as the dependent variable. Control the other two, plant material, time and measurement conditions; repeat measurements.

Vary light with lamp distance or a light meter, CO₂ with known hydrogencarbonate concentrations or gas control, and temperature with a thermostatically controlled water bath. Measure an initial oxygen-production or CO₂-consumption rate.

A rate rising with light intensity and then reaching a plateau supports the hypothesis that light was initially limiting; at the plateau, CO₂ concentration, temperature or biochemical capacity may limit instead.

A hypothesis is provisional and needs repeated testing. A plateau does not mean photosynthesis has stopped, and moving a lamp can also change temperature unless heat is controlled.

Limiting factors investigation

Assessment in practice

1–2 marks
How it is assessed

This objective is assessed through structured response, commonly using State / Identify / Determine.

Command terms

State / Identify / Determine / Calculate / Describe / Compare / Explain / Suggest / Draw / Sketch / Predict / Outline / Discuss

What earns marks

Build the answer around this relationship: Photosynthesis rises with a limiting factor only while that factor restricts the rate.

Representative question

Question 1

[Maximum number: 9]

Explain methods by which the rate of photosynthesis can be measured, including conditions that affect the rate.

CO₂ Enrichment Can Increase Photosynthesis

Carbon-dioxide enrichment experiments test how higher atmospheric CO₂ may alter photosynthesis and plant growth, but responses depend on other limiting factors.

Design Control strength Realism Typical limitation
Enclosed greenhouse/chamber CO₂ and other conditions can be controlled closely Artificial enclosure Chamber conditions can alter light, temperature or airflow
FACE field experiment CO₂ is raised around plants in an open ecosystem High field realism Weather and ecosystem variation are harder to control

Compare enriched and ambient-CO₂ treatments with replication. Record photosynthetic rate and longer-term growth or biomass while monitoring controlled variables such as light, temperature, water, nutrients and plant age.

A crop may show greater CO₂ uptake under enrichment when light and nutrients are sufficient, but little additional biomass under shade or nutrient limitation. This conditional response improves predictions of future growth.

Higher CO₂ does not guarantee a proportional or permanent rise in photosynthesis or yield. Greenhouse results cannot be transferred to natural ecosystems without considering enclosure effects and field interactions.

CO₂ enrichment experiments

Assessment in practice

1–2 marks
How it is assessed

This objective is assessed through structured response, commonly using Discuss.

Command terms

Discuss

What earns marks

Build the answer around this relationship: FACE experiments expose plants to elevated carbon dioxide under more realistic field conditions.

Representative question

Question 1

[Maximum number: 2]

Using the data in the graph, discuss whether rising carbon dioxide levels in the atmosphere will increase growth rates in maize.

SL Transfer: Explain Core Photosynthesis

Photosynthesis converts light energy into chemical energy in carbon compounds. Carbon dioxide is reduced to carbohydrate using hydrogen from water, glucose is the main stored product, and released oxygen comes from photolysis of water. Pigment evidence is tested with chromatography and Rf, spectra questions separate absorption from action, and rate/evidence questions use limiting factors, controls, and CO2 enrichment context.

  • Light becomes chemical energy in carbon compounds through chlorophyll-containing photoautotrophs.
  • Carbon in carbohydrate comes from CO2; released oxygen comes from photolysis of water.
  • Chromatography separates pigments using Rf; absorption spectra and action spectra measure different things.
  • Limiting-factor and CO2 enrichment questions require variables, controls, and realistic interpretation.

Topic C2.2

C2.2 Neural signalling

Neural signalling transmits information through neuron structure, ion gradients, action potentials, synapses and chemical modulation of postsynaptic responses, linking cellular mechanisms to rapid communication in nervous systems.

41% of analysed papers 58 papers · 79 questions

Objectives in this topic

Neurons Carry Information through Electrical and Chemical Signals

A neuron is a specialized cell of the nervous system that conducts electrical impulses along elongated nerve fibres.

The cell body contains cytoplasm and the nucleus. Multiple shorter dendrites usually conduct impulses toward the cell body, while one long axon conducts impulses away toward other neurons or effector cells.

Identify the nucleus and cytoplasm in the cell body, then distinguish the long single axon from the multiple shorter dendrites. Fibre length and branching vary with neuron function.

A motor neuron's long axon can carry an impulse from the central nervous system to a distant muscle, while its dendrites receive inputs from other neurons.

An axon and dendrites are cellular projections, not separate cells. Neuron shape varies, so use fibre number, length and direction of impulse rather than assuming every drawing has the same layout.

Neurons exam focus

Assessment in practice

1–2 marks
How it is assessed

This objective is assessed through experimental design, commonly using Label / Draw / State.

Command terms

Label / Draw / State / Distinguish / Identify

What earns marks

Build the answer around this relationship: Dendrites receive signals and conduct them toward the cell body.

Representative question

Question 1

[Maximum number: 5]

Draw a labelled diagram of a motor neuron.

Resting Potential Stores an Ion Gradient

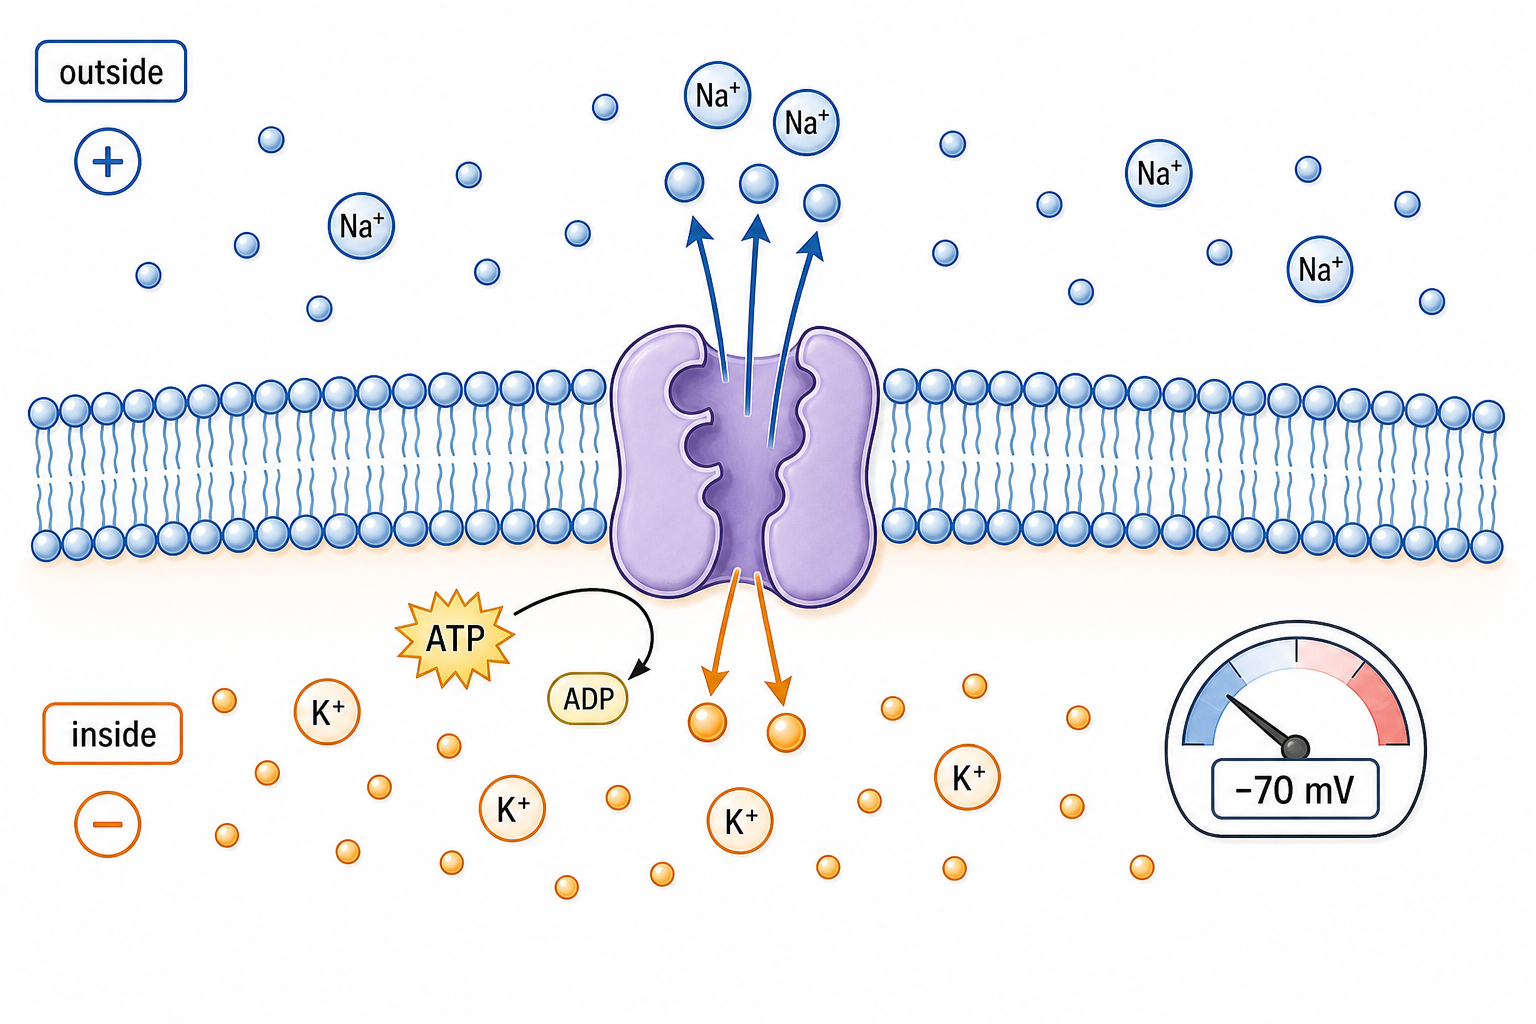
The resting potential is the negative voltage across a resting neuron's polarized plasma membrane, maintained by sodium and potassium ion gradients.

ATP supplies energy to the sodium–potassium pump, which moves Na⁺ out and K⁺ in opposite directions against their gradients. The membrane is more permeable to K⁺ at rest, so more positive charge diffuses out than enters and the inside remains negative relative to outside.

ATP-driven pumping establishes and maintains high Na⁺ outside and high K⁺ inside; selective leak channels create unequal ion movement; separated charge produces membrane polarization and a measurable membrane potential.

If ATP production stops, the pump can no longer maintain the gradients. Existing gradients may persist briefly, but continued leakage gradually erodes the negative resting potential.

The pump maintains the gradients over time; it does not directly create each action potential. A concentration gradient and a voltage gradient both influence ion movement.

Resting potential generation

Assessment in practice

1–2 marks
How it is assessed

This objective is assessed through structured response, commonly using Define / Outline / Explain.

Command terms

Define / Outline / Explain / State / Label

What earns marks

Build the answer around this relationship: The resting axon is negative inside relative to outside.

Representative question

Question 1

[Maximum number: 4]

Outline how neurons generate a resting potential.

An Action Potential Is an All-or-none Nerve Impulse

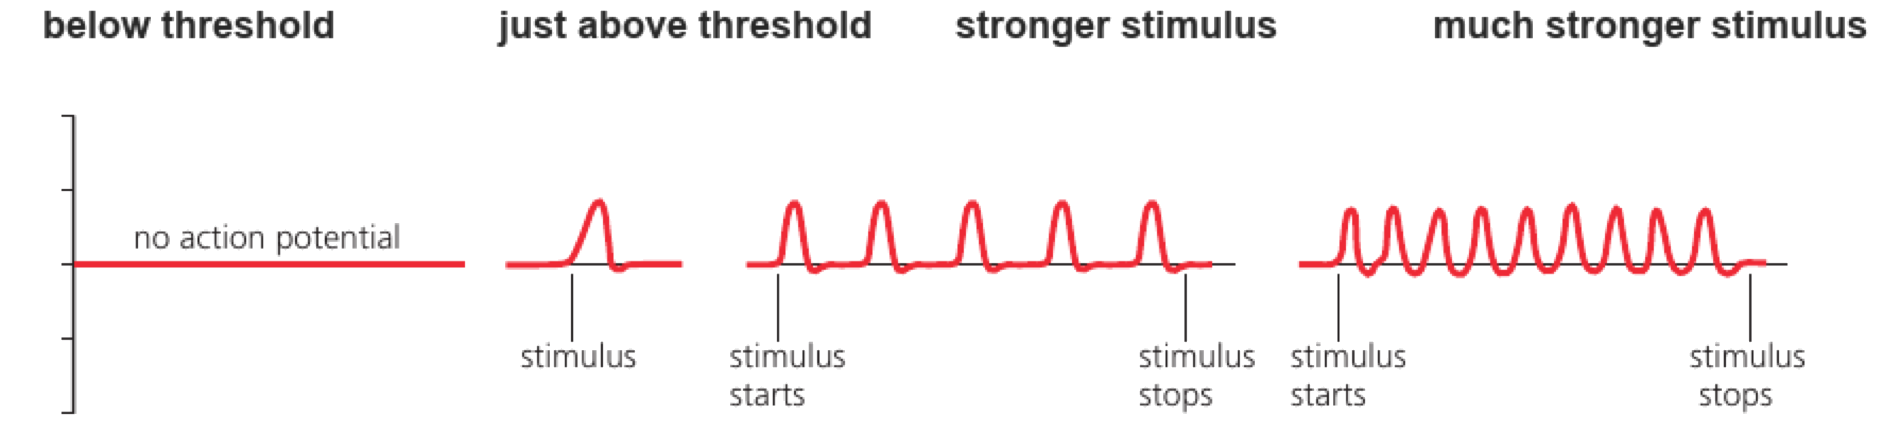
An action potential is a brief, threshold-triggered reversal of membrane potential that propagates along an axon.

Voltage-gated sodium channels open rapidly during depolarization, then inactivate while potassium channels open to repolarize the membrane. Refractory periods prevent immediate re-firing in the same segment. The threshold is a condition, not a fixed promise: if it is not reached, the full action potential does not start.

Trace the phases:

  • threshold
  • Na⁺ influx and depolarization
  • K⁺ efflux and repolarization
  • hyperpolarization and recovery

A stimulus below threshold produces no full impulse, while a threshold stimulus produces an impulse with a similar amplitude.

Stronger stimuli are coded mainly by impulse frequency, not by a larger action-potential amplitude.

Nerve impulses as action potentials

Assessment in practice

1–8 marks
How it is assessed

This objective is assessed through structured response, commonly using Explain / Outline.

Command terms

Explain / Outline

What earns marks

Build the answer around this relationship: Action potentials are regenerated along neuron membranes.

Representative question

Question 1

[Maximum number: 3]

Outline how nerve impulses are transmitted along a nerve fibre.

Impulse Speed Depends on Axon Design

Impulse conduction speed increases with axon diameter and myelination because both allow local currents to influence the next excitable membrane region more rapidly.

Comparison Faster case Mechanistic reason
Giant squid axon vs smaller unmyelinated fibre Giant squid axon Larger diameter lowers internal resistance
Myelinated vs unmyelinated fibre Myelinated fibre Insulation limits leakage and impulses regenerate mainly at nodes

Describe a positive correlation when conduction speed rises as axon diameter rises, and a negative correlation when one variable falls as the other rises. The correlation coefficient r gives direction and strength; R² estimates the proportion of variation in conduction speed explained by the fitted relationship.

If r = 0.90 for diameter and speed, the association is strong and positive; R² = 0.81 means about 81% of the observed variation in speed is explained by the fitted relationship, not that diameter is proven to be the sole cause.

Correlation does not by itself prove causation. Faster impulses do not have larger action-potential amplitudes; speed and signal strength are different properties.

Variation in impulse speed

Assessment in practice

1 marks
How it is assessed

This objective is assessed through multiple choice, commonly using Describe / Determine / Calculate.

Command terms

Describe / Determine / Calculate / Suggest / Outline

What earns marks

Build the answer around this relationship: Larger axon diameter is associated with faster impulse transmission.

Representative question

Question 1

[Maximum number: 1]

The diagrams represent sections through different axons. Which axon has the slowest speed of impulse?

A
B

A Synapse Connects One Cell to Another

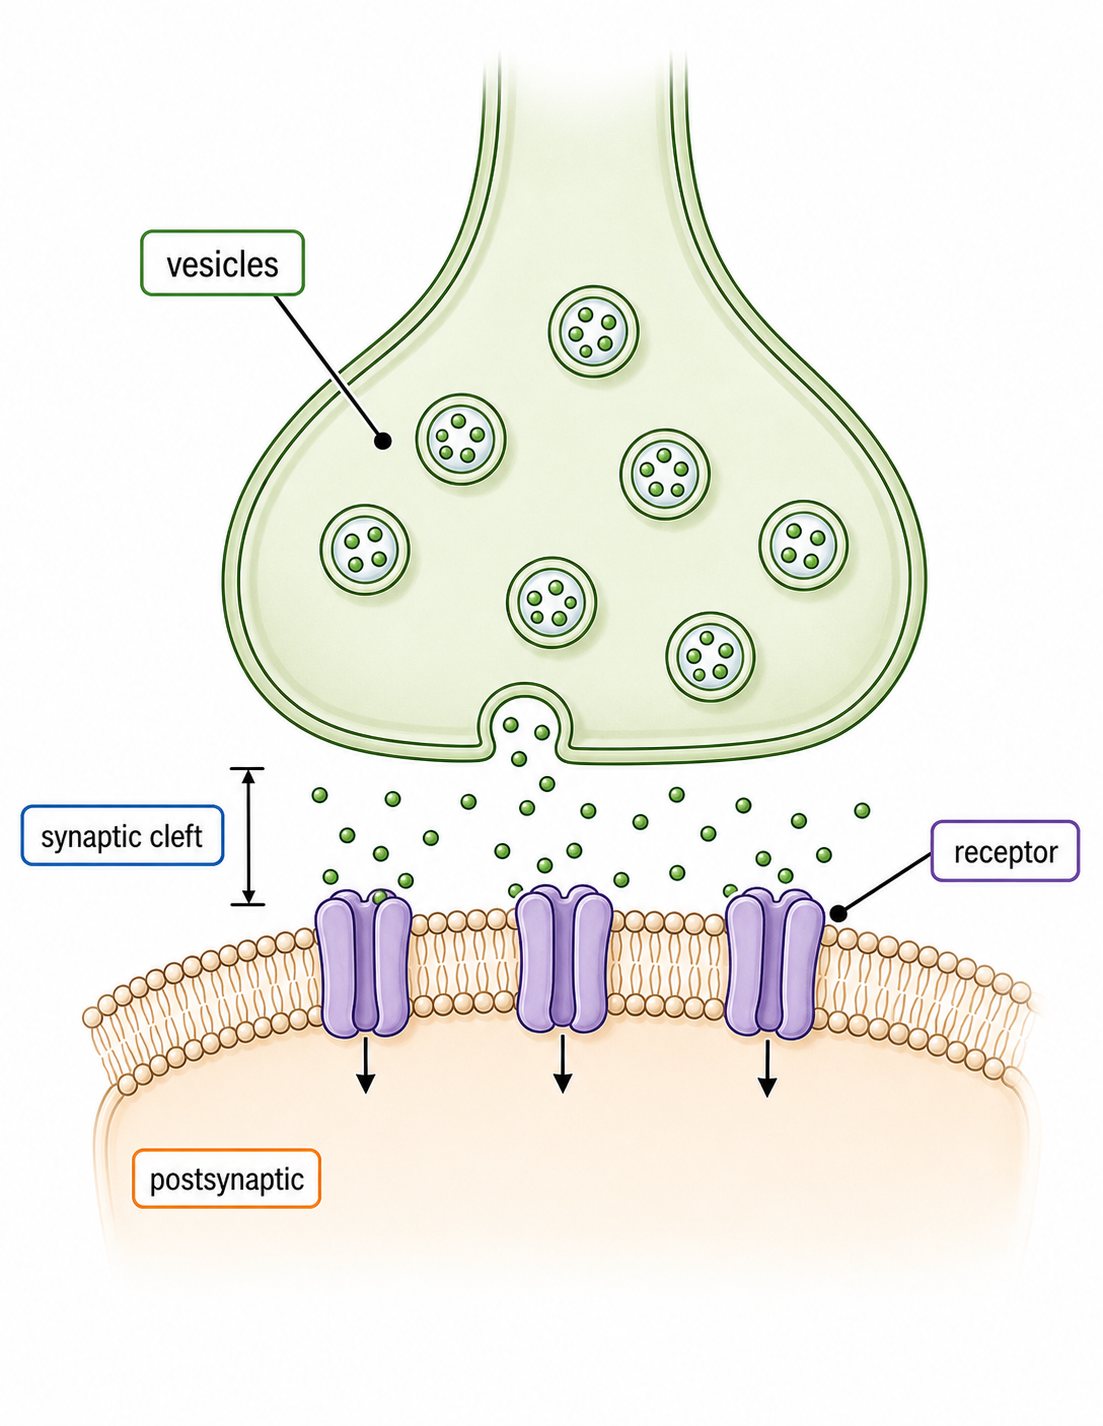
A synapse is a junction where a presynaptic cell communicates with a postsynaptic cell, usually through neurotransmitter release.

The synaptic cleft separates membranes, creating a one-way delay in chemical synapses. Receptors on the postsynaptic membrane convert transmitter binding into ion-flow or intracellular effects. The synapse is a junction, so the signal must be converted before it can cross to the next cell.

Describe a chemical synapse:

  • presynaptic terminal
  • vesicles and cleft
  • postsynaptic receptors
  • signal termination

An action potential at a motor neuron terminal releases transmitter that binds receptors on a muscle fibre.

A synapse is not simply a physical gap; receptor type and transmitter removal determine the response.

Synapses as junctions

Assessment in practice

1–6 marks
How it is assessed

This objective is assessed through structured response, commonly using Explain / Describe / State.

Command terms

Explain / Describe / State / Identify / Distinguish / Suggest

What earns marks

Build the answer around this relationship: Synapses transmit signals chemically between neurons.

Representative question

Question 1

[Maximum number: 2]

Distinguish between the presynaptic and postsynaptic membranes by giving two differences.

Calcium Triggers Neurotransmitter Release

Arrival of an action potential at a presynaptic terminal opens voltage-gated calcium channels and triggers vesicle fusion.

Ca²⁺ entry binds release machinery, causing exocytosis of neurotransmitter into the synaptic cleft. Enzymatic breakdown, reuptake or diffusion then terminates the signal. This one-way sequence explains why changing calcium entry can alter how strongly a synapse communicates.

Trace release:

  • action potential arrives
  • Ca²⁺ channels open
  • vesicles fuse
  • transmitter binds and is cleared

Blocking presynaptic calcium entry reduces transmitter release even if the action potential still reaches the terminal.

The electrical impulse triggers release; it does not cross the cleft as the same electrical current.

Neurotransmitter release

Assessment in practice

1–3 marks
How it is assessed

This objective is assessed through structured response, commonly using Describe / Explain / Outline.

Command terms

Describe / Explain / Outline / Deduce / Label / State

What earns marks

Build the answer around this relationship: An arriving action potential depolarizes the presynaptic terminal.

Representative question

Question 1

[Maximum number: 3]

Describe how neurotransmitters are released from a presynaptic neuron membrane.

Excitatory Postsynaptic Potentials Move a Neuron toward Threshold

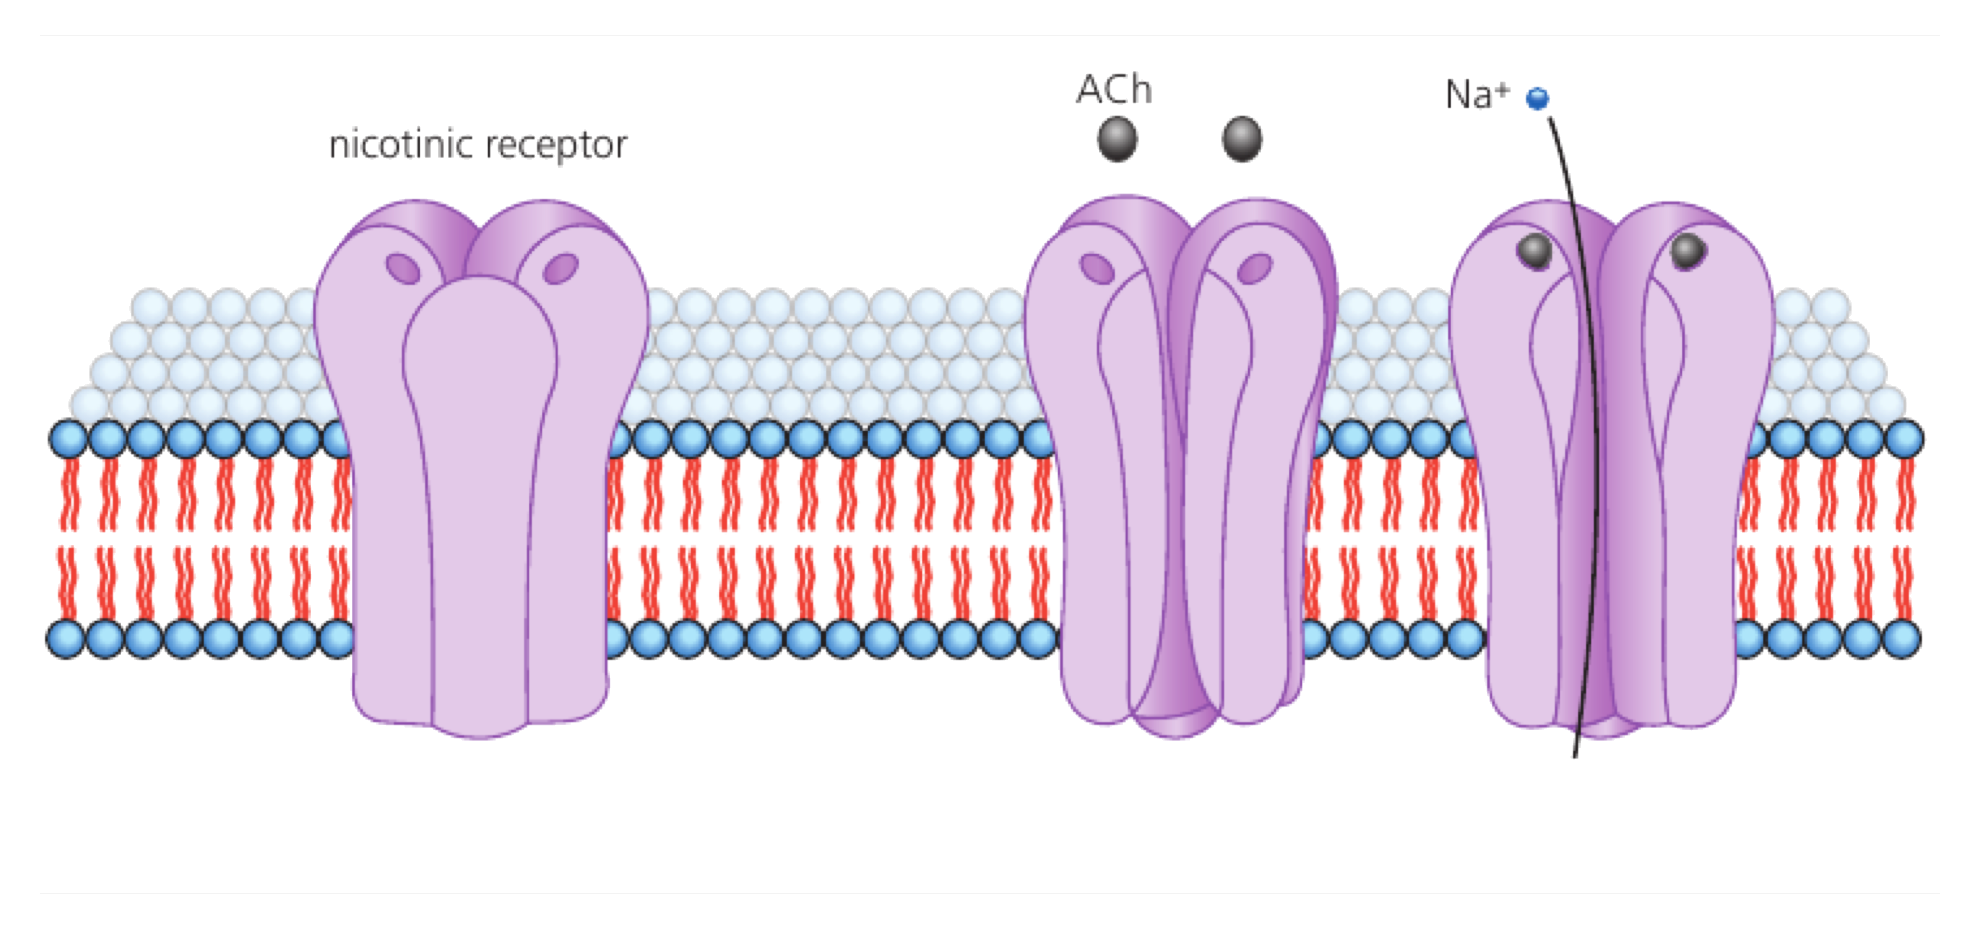
An excitatory postsynaptic potential (EPSP) is a graded depolarization that makes the postsynaptic neuron more likely to reach action-potential threshold.

Neurotransmitter released from the presynaptic terminal diffuses across the synaptic cleft and binds a transmembrane receptor. Acetylcholine can open ligand-gated channels, allowing net positive charge to enter and depolarize the postsynaptic membrane.

Sequence: transmitter release → diffusion across cleft → receptor binding → channel opening → local depolarization. Acetylcholine acts at many synapses, including neuromuscular junctions.

One acetylcholine input may produce a small EPSP below threshold; overlapping excitatory inputs can sum at the axon hillock until an action potential is triggered.

An EPSP is local and graded, not an all-or-none action potential. The neurotransmitter does not carry the electrical impulse across the cleft; receptor-controlled ion movement changes voltage.

Excitatory postsynaptic potential

Assessment in practice

1–2 marks
How it is assessed

This objective is assessed through structured response, commonly using Explain / Describe.

Command terms

Explain / Describe

What earns marks

Build the answer around this relationship: Excitatory neurotransmitters bind receptors on the postsynaptic membrane.

Representative question

Question 1

[Maximum number: 3]

Describe how an excitatory postsynaptic potential is generated.

Up to one additional mark is available for the construction of your answer.

SL Transfer: Explain Core Neural Signalling

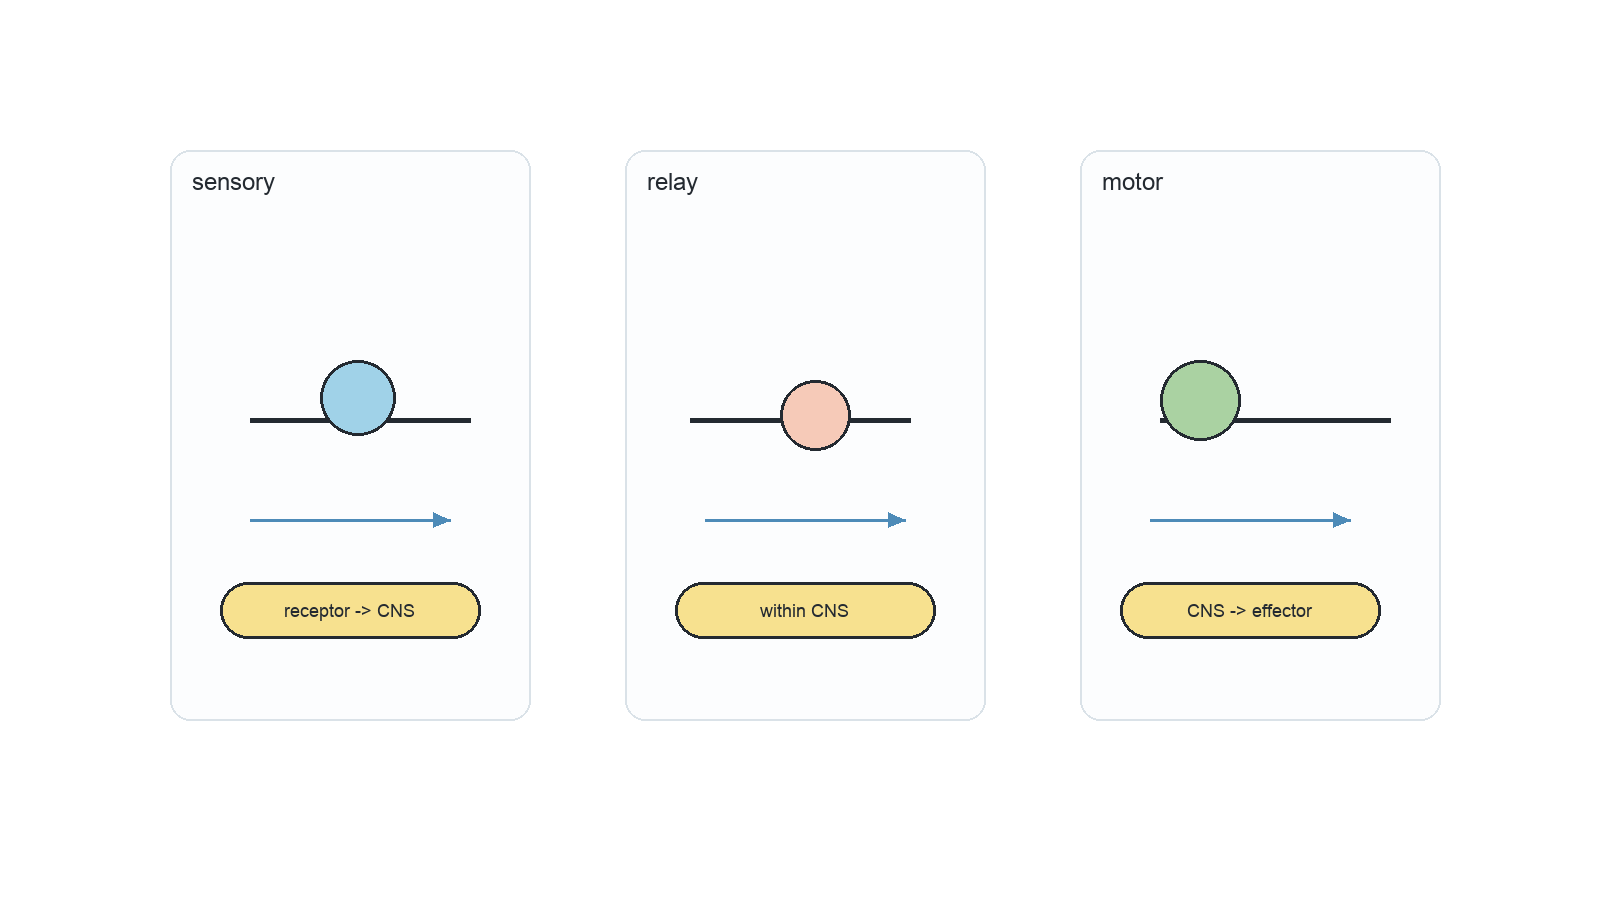
Neurons carry electrical impulses in the nervous system; motor, sensory, and relay neurons differ in axon, dendrite, and cell body arrangement. Sodium-potassium pumps use ATP to move 3 Na+ out and 2 K+ in; ion gradients make the resting axon polarized at about -70 mV. A nerve impulse is a propagated action potential along a nerve fibre; stimulus-triggered sodium influx reverses membrane polarity. Larger axon diameter lowers resistance and increases impulse speed; myelin sheaths and nodes of Ranvier enable faster saltatory conduction. Synapses connect neurons to neurons, muscles, or glands; chemical synapses transmit one way across a narrow synaptic cleft. Action potentials open voltage-gated Ca2+ channels in presynaptic terminals; Ca2+ causes vesicle fusion and neurotransmitter exocytosis into the cleft. Neurotransmitters diffuse and bind receptors on the postsynaptic membrane; EPSPs depolarize the membrane and make threshold more likely.

Topic C3.1

C3.1 Integration of body systems

Integrated body systems coordinate neural, hormonal and plant responses through receptors, control centres and effectors, maintaining function across organisms and changing environmental conditions.

39% of analysed papers 54 papers · 76 questions

Objectives in this topic

Integration joins specialised parts into a working whole

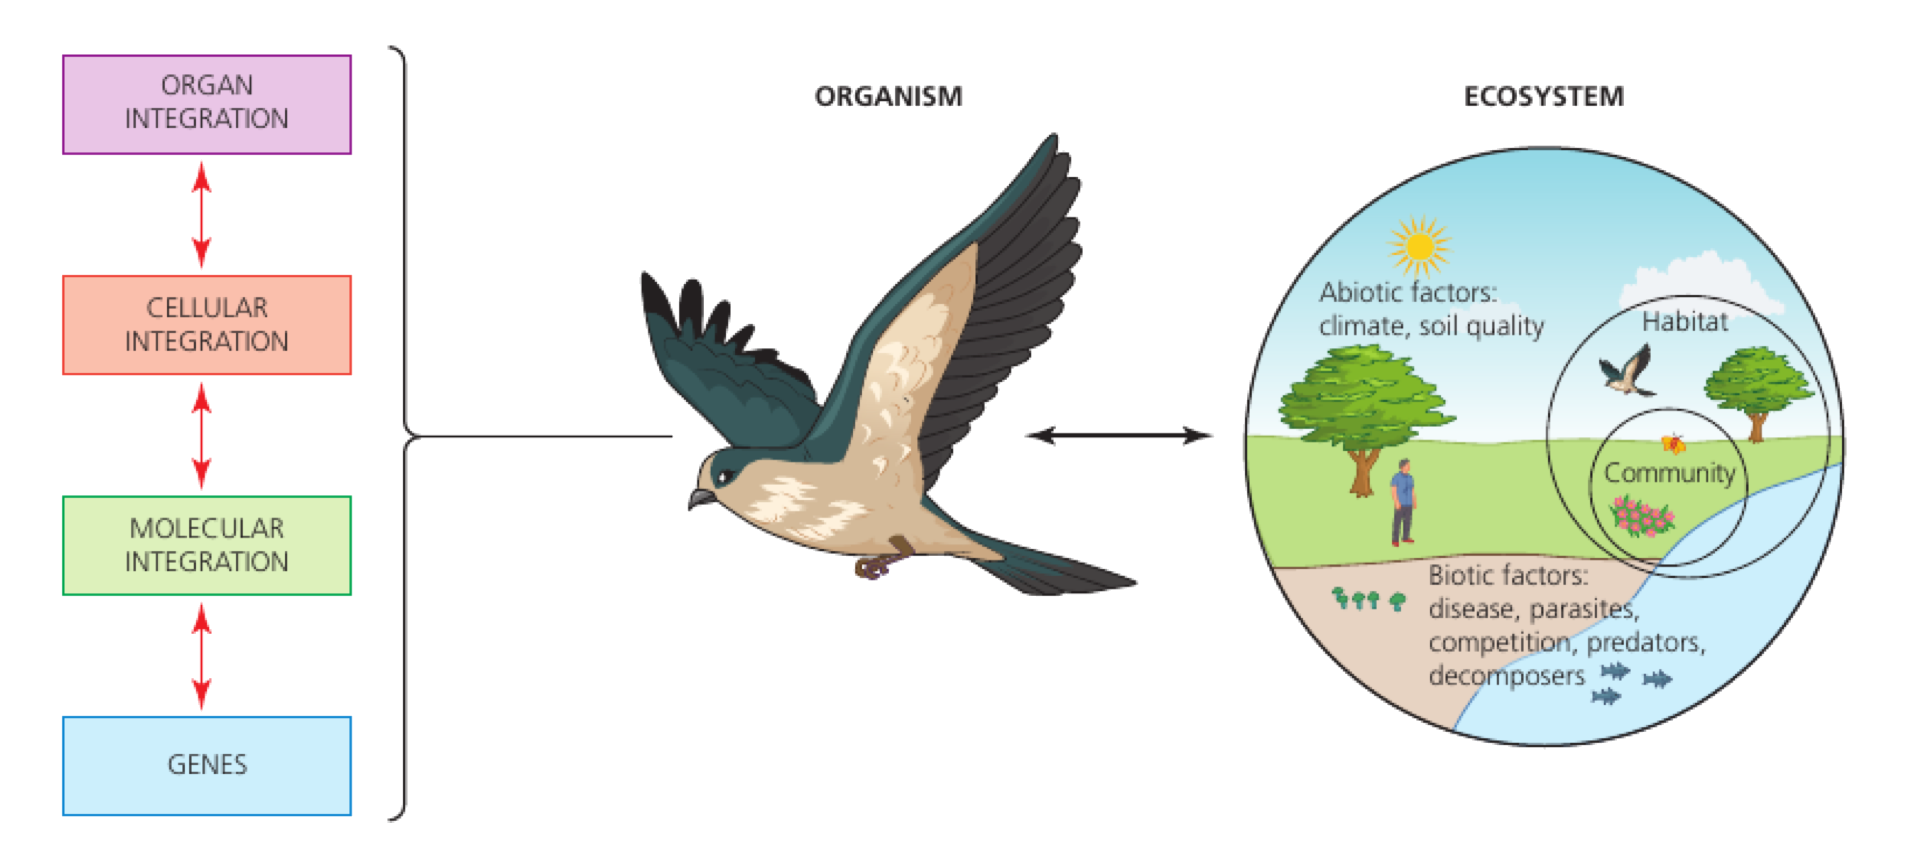
Integration joins specialised parts into a working whole.

In a multicellular organism, tissues, organs and organ systems exchange information and materials so the organism can coordinate one response. Nervous impulses are fast; hormones travel in blood and can act on distant targets.

Name the parts; identify the signal or material crossing between them; then state the coordinated outcome.

During exercise, receptors and the brain increase heart and ventilation activity while blood delivers oxygen to working muscle.

Integration is more than a list of organs: the explanation must include communication and a shared function.

System integration

Assessment in practice

1–3 marks
How it is assessed

This objective is assessed through structured response, commonly using Identify / Explain.

Command terms

Identify / Explain

What earns marks

Mark schemes reward named structures, correct direction of information flow and explanations that keep the sequence causal.

Watch for

Naming a brain region without linking it to information integration or coordination.

Representative question

Question 1

[Maximum number: 3]

Using the diagram, explain the concept of emergent properties of biofilms.

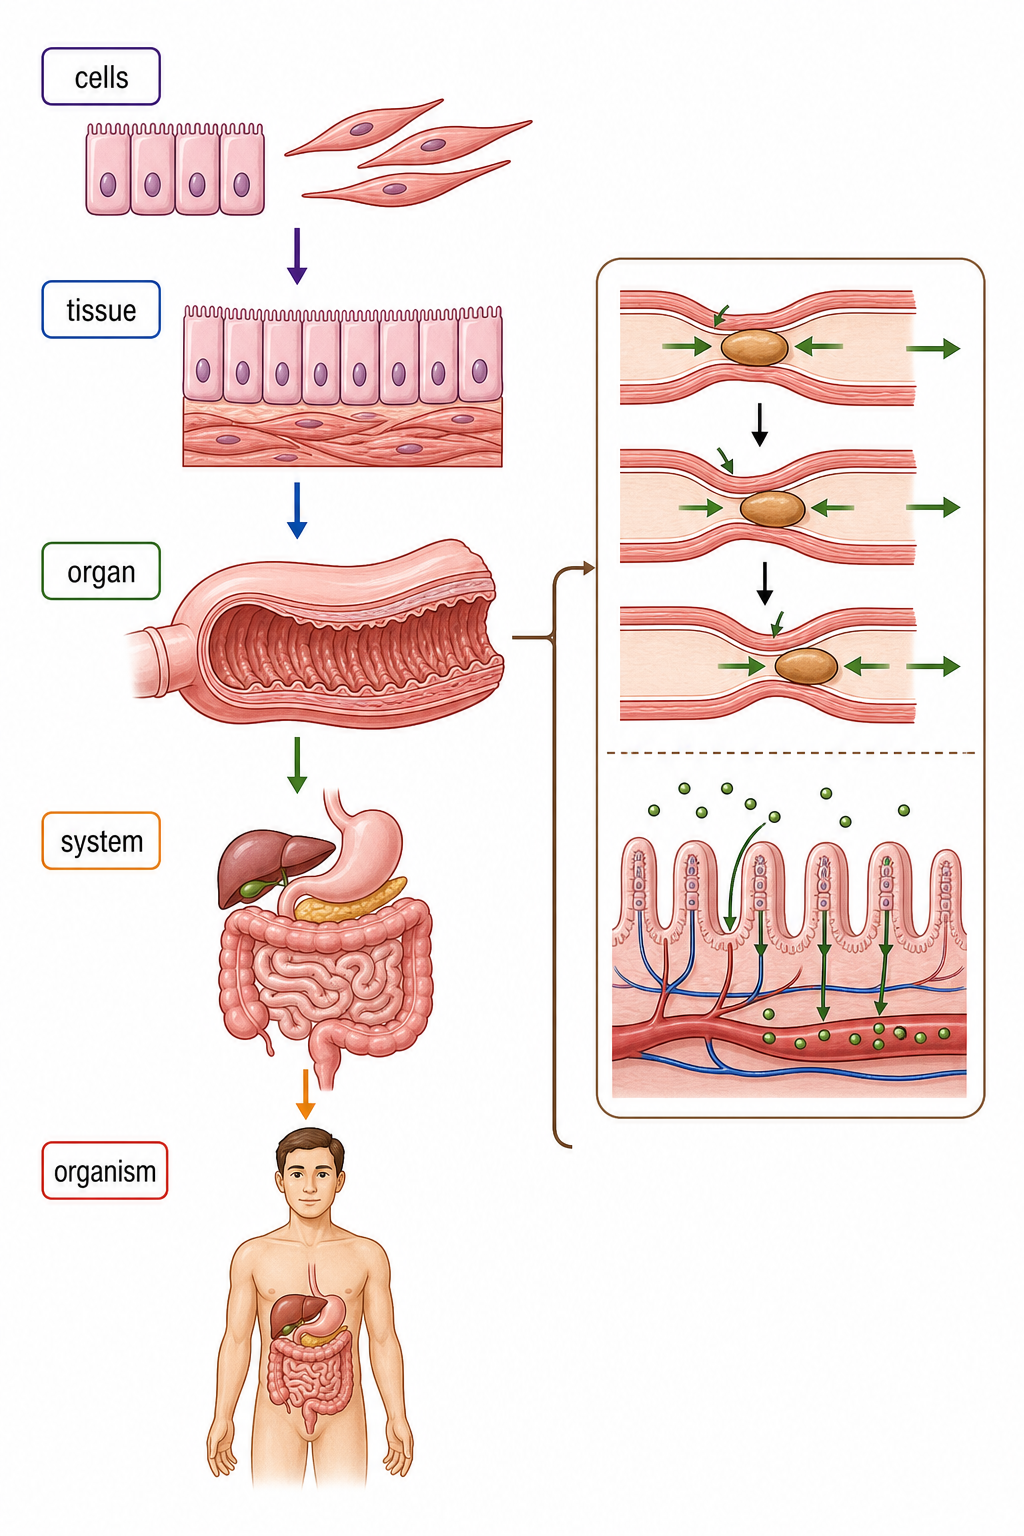
Organisation builds new properties at each level

Organisation builds new properties at each level.

Cells of one type form tissues, different tissues form organs, and organs form systems. Interactions between parts can produce an emergent capability that no isolated cell performs alone.

cell → tissue → organ → system → organism; at each step ask what cooperation adds.

Cardiac muscle, connective tissue and blood vessels combine in a heart that pumps blood; no one tissue performs the whole job.

Hierarchy is not just size ranking; it is a functional relationship between levels.
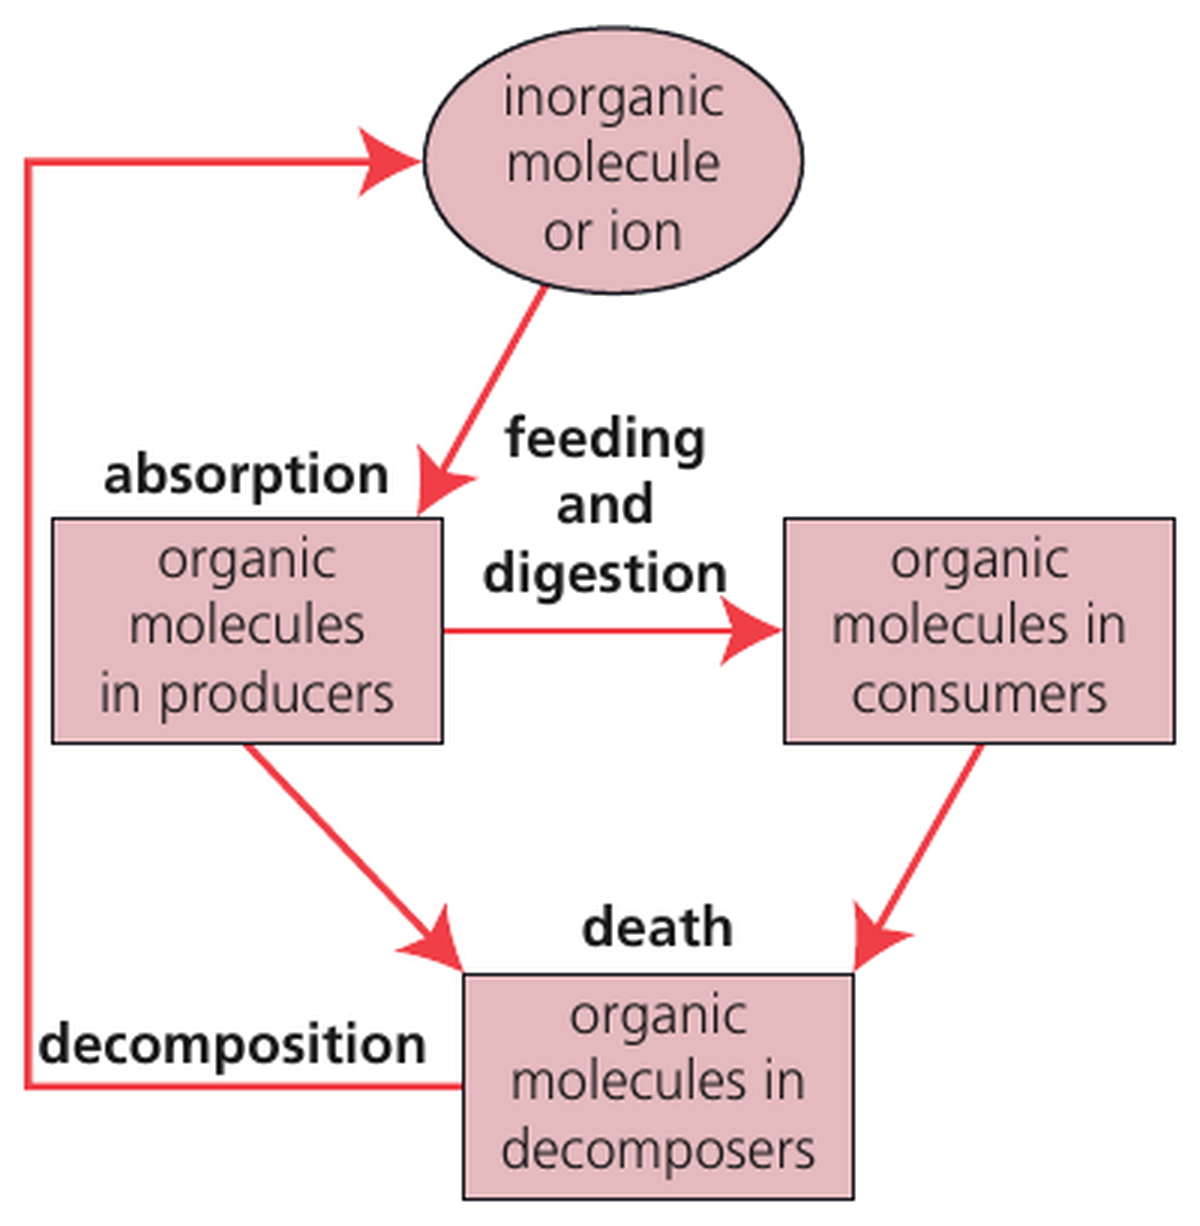
Hierarchy in multicellular organisms

Assessment in practice

1 marks
How it is assessed

This objective is assessed through multiple choice, commonly using Explain.

Command terms

Explain

What earns marks

Mark schemes reward named structures, correct direction of information flow and explanations that keep the sequence causal.

Representative question

Question 1

[Maximum number: 1]

Why do multicellular organisms have emergent properties?

A

They have more genes than unicellular organisms.

B

Properties of unicellular organisms are enhanced by having many cells.

C

All of their genes are expressed whereas unicellular organisms express only some.

D

They show properties that can only result from the interaction of many cells.

Organs integrate by sharing materials and control

Animal organs are integrated by nervous and hormonal messages and by blood transport of materials and energy between organs.

Integration route Message or material Typical pattern
Nervous signalling Electrical impulses and neurotransmitters Rapid, targeted, usually short-lived
Endocrine signalling Hormones carried in blood Slower, distributed to distant receptor-bearing cells, often longer-lived
Blood transport Oxygen, nutrients, heat and wastes Connects organ inputs and outputs continuously

During exercise, motor nerves stimulate skeletal muscles, epinephrine coordinates responses in several organs, and blood carries oxygen and glucose to muscle while transporting carbon dioxide away.

Blood is both a transport route for hormones and a carrier of non-message materials. Integration requires source, route, target and coordinated outcome—not just a list of organs.

Integration of organs

Assessment in practice

1–2 marks
How it is assessed

This objective is assessed through structured response, commonly using Identify / Explain / Draw.

Command terms

Identify / Explain / Draw / Deduce / Suggest / Outline / Describe

What earns marks

Mark schemes reward named structures, correct direction of information flow and explanations that keep the sequence causal.

Watch for

Giving a general body-system answer without the specific pathway step for integration of organs.

Representative question

Question 1

[Maximum number: 3]

Pancreatic secretions contain sodium hydrogen carbonate, making them basic.
Deduce the significance of the response by the pancreas to secretin.

The brain combines information before coordinating responses

The brain is a central integration organ that combines information from several inputs before coordinating responses.

Current sensory inputs can be compared with stored information. Changes in neural connections support learning, while stored and retrievable information supports memory; both influence how later inputs are interpreted and acted on.

Trace input from several receptors → combined processing in the brain → comparison with learned or remembered information → coordinated output. Detailed slow-acting neurotransmitter mechanisms are not required.

A learner sees a traffic signal, hears an approaching vehicle and recalls the crossing rule; the brain combines these inputs and memory before coordinating whether to step forward or wait.

Integration is not simple forwarding of one sensory message. The objective concerns combining inputs plus learning and memory, not memorizing detailed functions of many brain regions.

Brain as information integration organ

Assessment in practice

1–3 marks
How it is assessed

This objective is assessed through essay response, commonly using Explain / Outline / Identify.

Command terms

Explain / Outline / Identify / Label / State / Discuss / Determine / Compare / Contrast

What earns marks

Mark schemes reward named structures, correct direction of information flow and explanations that keep the sequence causal.

Watch for

Naming a brain region without linking it to information integration or coordination.

Representative question

Question 1

[Maximum number: 6]

Explain two methods that scientists have used to determine the different functions of the brain.

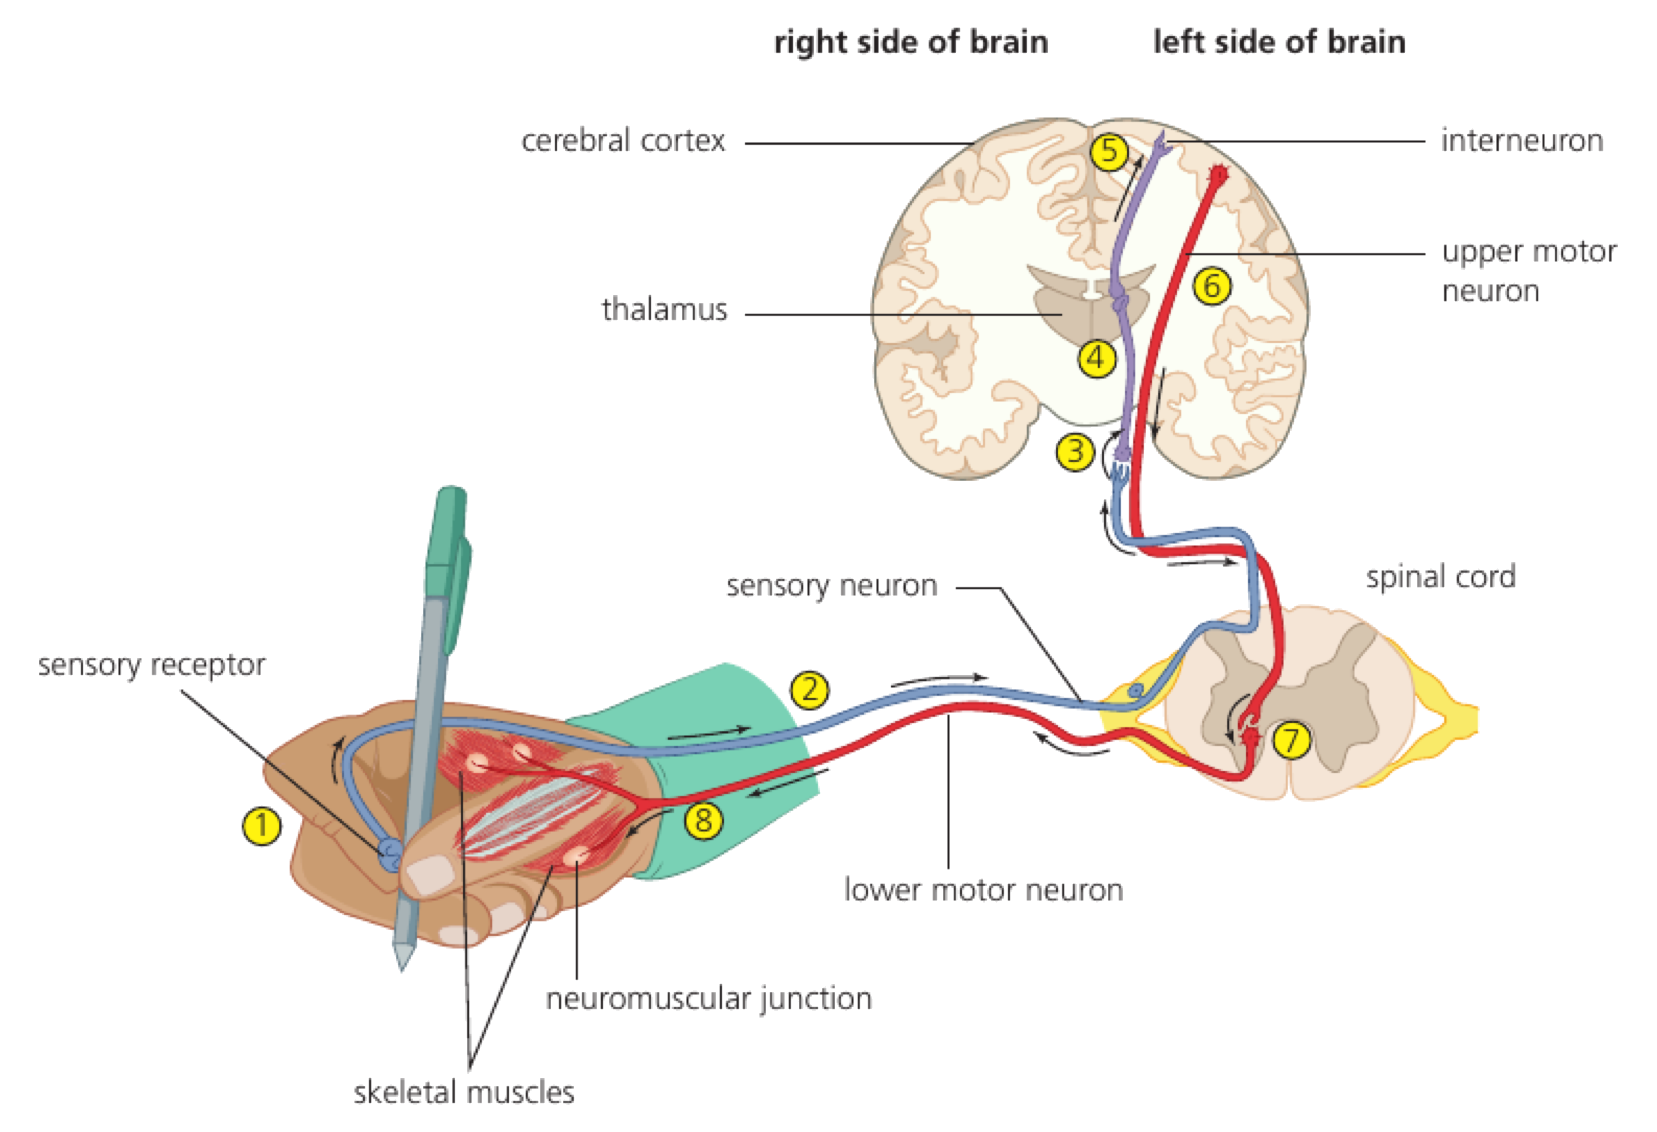
The spinal cord can integrate a rapid response

The spinal cord can integrate a rapid response.

The spinal cord links body and brain, but grey matter can connect sensory input to motor output without waiting for conscious brain processing. White matter carries impulses along longer pathways.

receptor → sensory neurone → spinal integration → motor neurone → effector.

Touching a hot surface triggers a withdrawal through a spinal reflex; the brain receives information as the movement is already beginning.

A reflex is not brain-free information: the spinal cord handles the immediate response, while the brain can receive the signal afterwards.

Spinal cord

Assessment in practice

1 marks
How it is assessed

This objective is assessed through structured response, commonly using State.

Command terms

State

What earns marks

Mark schemes reward named structures, correct direction of information flow and explanations that keep the sequence causal.

Representative question

Question 1

[Maximum number: 1]

The spinal cord is involved in the coordination of involuntary actions such as the pain reflex.

Where are synapses between sensory neurons and interneurons found?

Sensory neurones carry transduced information to the CNS

Sensory neurones carry transduced information to the CNS.

A receptor detects a stimulus and converts its energy into a change in membrane potential. If threshold is reached, an action potential travels along a sensory neurone to the CNS.

identify stimulus; receptor type; transduction; threshold; direction to CNS.

Salt ions entering taste-receptor channels depolarise the receptor cell, which then excites a sensory neurone carrying the signal to the brain.

A stronger stimulus is not encoded by a larger action potential; it can increase firing frequency or recruit receptors.

Input through sensory neurons

Assessment in practice

1–2 marks
How it is assessed

This objective is assessed through multiple choice, commonly using Identify / Outline.

Command terms

Identify / Outline

What earns marks

Mark schemes reward named structures, correct direction of information flow and explanations that keep the sequence causal.

Watch for

Giving a general body-system answer without the specific pathway step for sensory neuron input pathway.

Representative question

Question 1

[Maximum number: 1]

Between which structures do sensory neurons carry nerve impulses?

A

From receptors to muscles

B

From effectors to the central nervous system (CNS)

C

From the central nervous system (CNS) to receptors

D

From receptors to the central nervous system (CNS)

Motor neurones turn CNS decisions into muscle action

Motor neurones turn CNS decisions into muscle action.

Motor neurones carry action potentials from the CNS to an effector. At a neuromuscular junction, acetylcholine depolarises the muscle membrane and starts the calcium-controlled contraction sequence.

CNS signal → motor axon → acetylcholine release → muscle action potential → calcium release.

An impulse at a motor end plate opens ion channels; the resulting muscle action potential travels along the fibre and triggers calcium release from the sarcoplasmic reticulum.

The motor neurone does not contract the muscle directly; transmitter and membrane events link the two cells.

Output through motor neurons

Assessment in practice

1 marks
How it is assessed

This objective is assessed through multiple choice, commonly using Describe / Identify.

Command terms

Describe / Identify

What earns marks

Mark schemes reward named structures, correct direction of information flow and explanations that keep the sequence causal.

Watch for

Giving a general body-system answer without the specific pathway step for motor neuron output pathway.

Representative question

Question 1

[Maximum number: 1]

What is the main role of nerves in human movement?

A

To cause muscles to stretch

B

To move joints

C

To transport pain signals that indicate muscle injuries

D

To stimulate muscle contraction

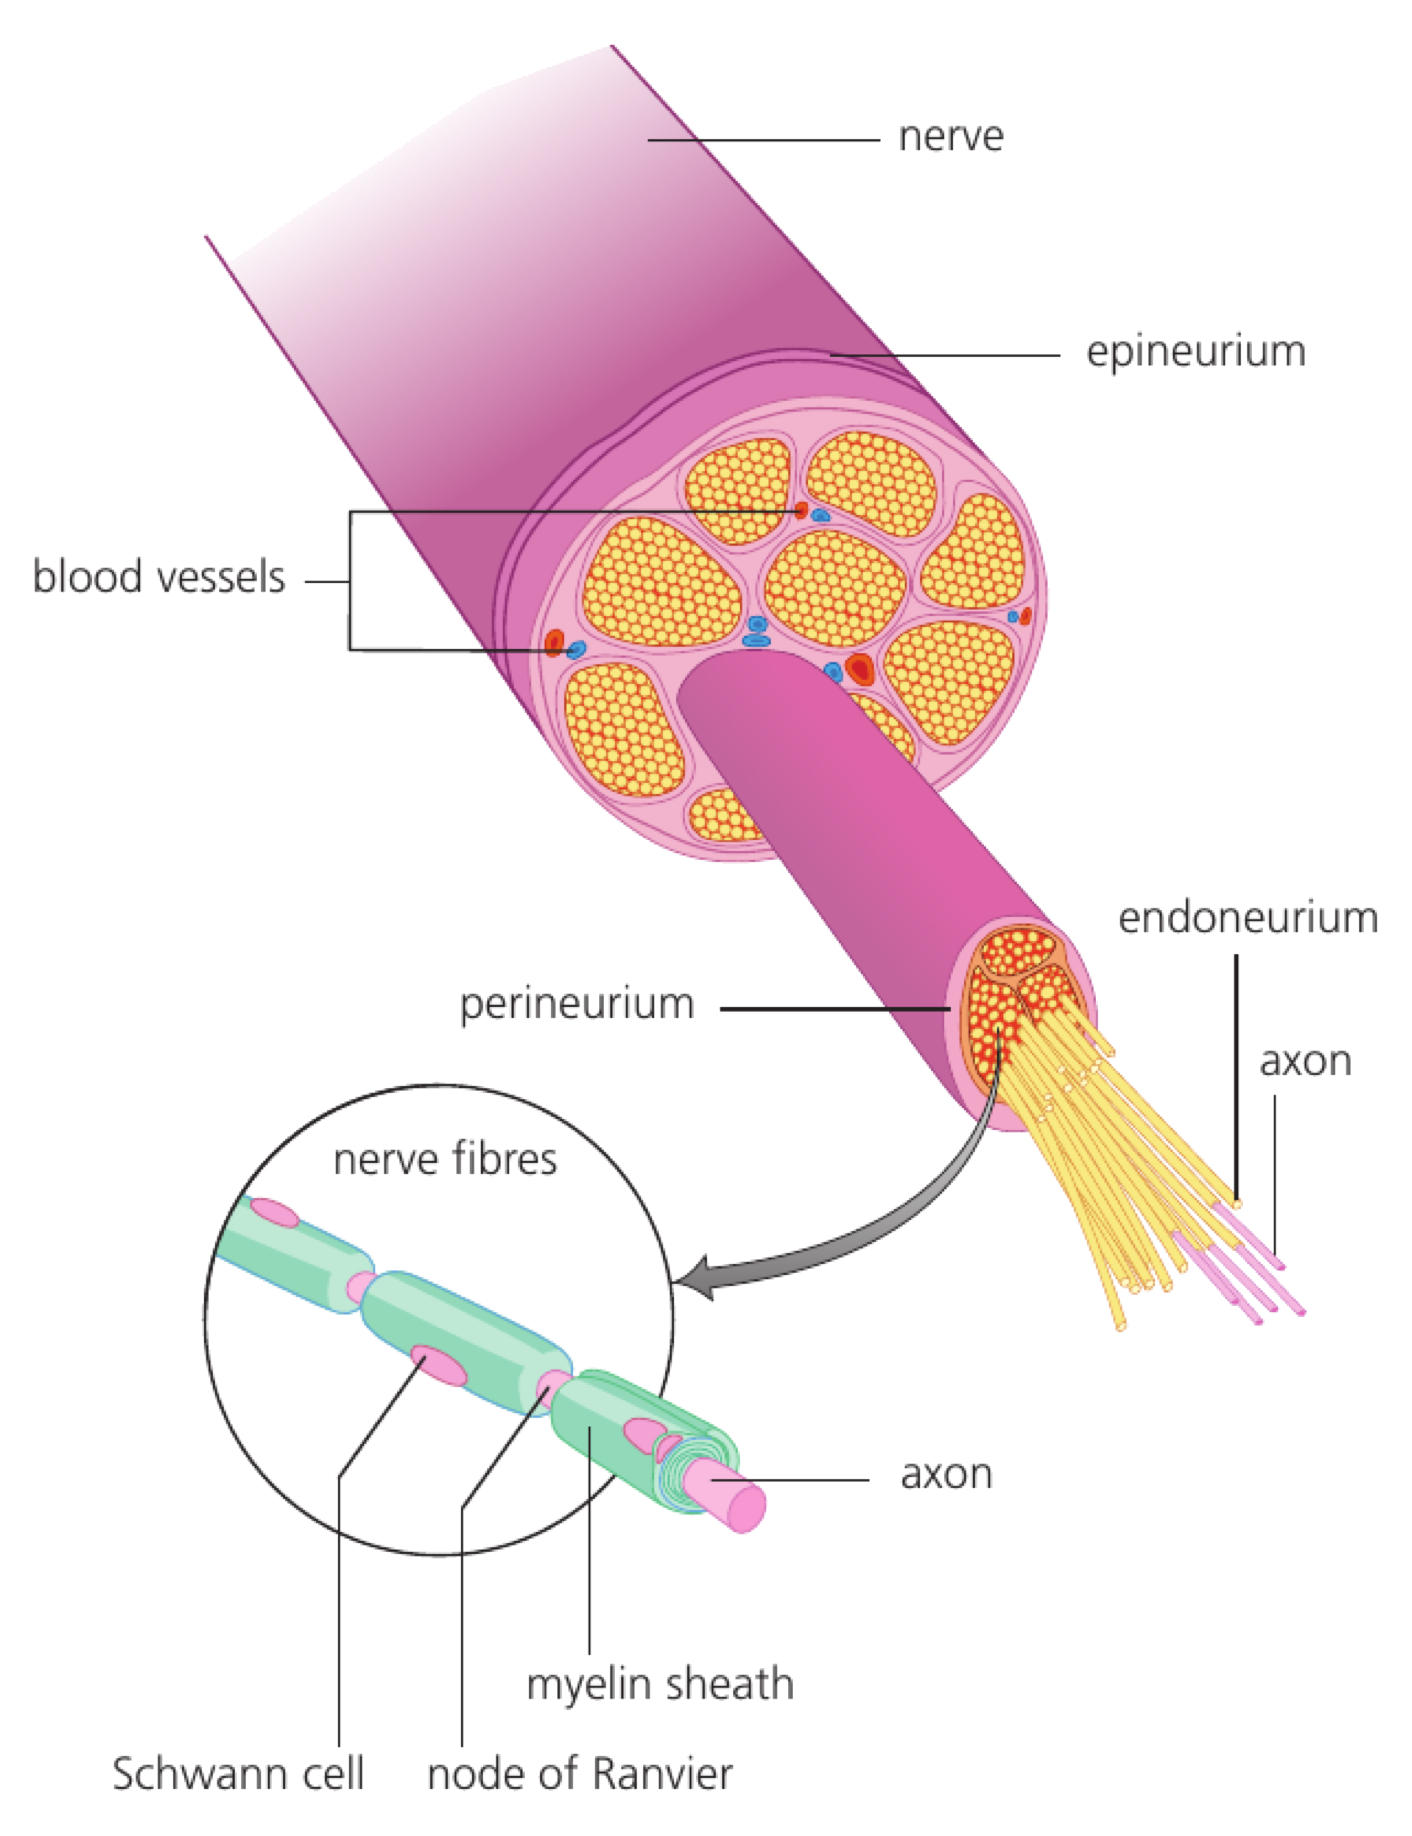
A nerve is a bundle of neurone axons

A peripheral nerve is a bundle of many nerve fibres—axons—from sensory and motor neurons, protected and organized by connective tissue sheaths.

In transverse section, each fibre appears cut across. Some have a visible myelin sheath around the axon and others are unmyelinated; groups of fibres are surrounded by protective connective tissue and supplied by blood vessels.

Identify outer protective sheath, bundles of fibres, myelinated fibres and unmyelinated fibres. Sensory axons carry input toward the CNS; motor axons carry output toward effectors.

A mixed nerve to a limb can contain sensory fibres carrying touch information toward the spinal cord and motor fibres carrying impulses back to skeletal muscle.

A nerve is not one giant neuron. Myelinated and unmyelinated fibres remain separate signal pathways inside the same protective bundle.

Nerves as bundles

Assessment in practice

1 marks
How it is assessed

This objective is assessed through structured response, commonly using State.

Command terms

State

What earns marks

Mark schemes reward named structures, correct direction of information flow and explanations that keep the sequence causal.

Representative question

Question 1

[Maximum number: 1]

State the role of the vagus nerve.

A reflex arc trades deliberation for speed

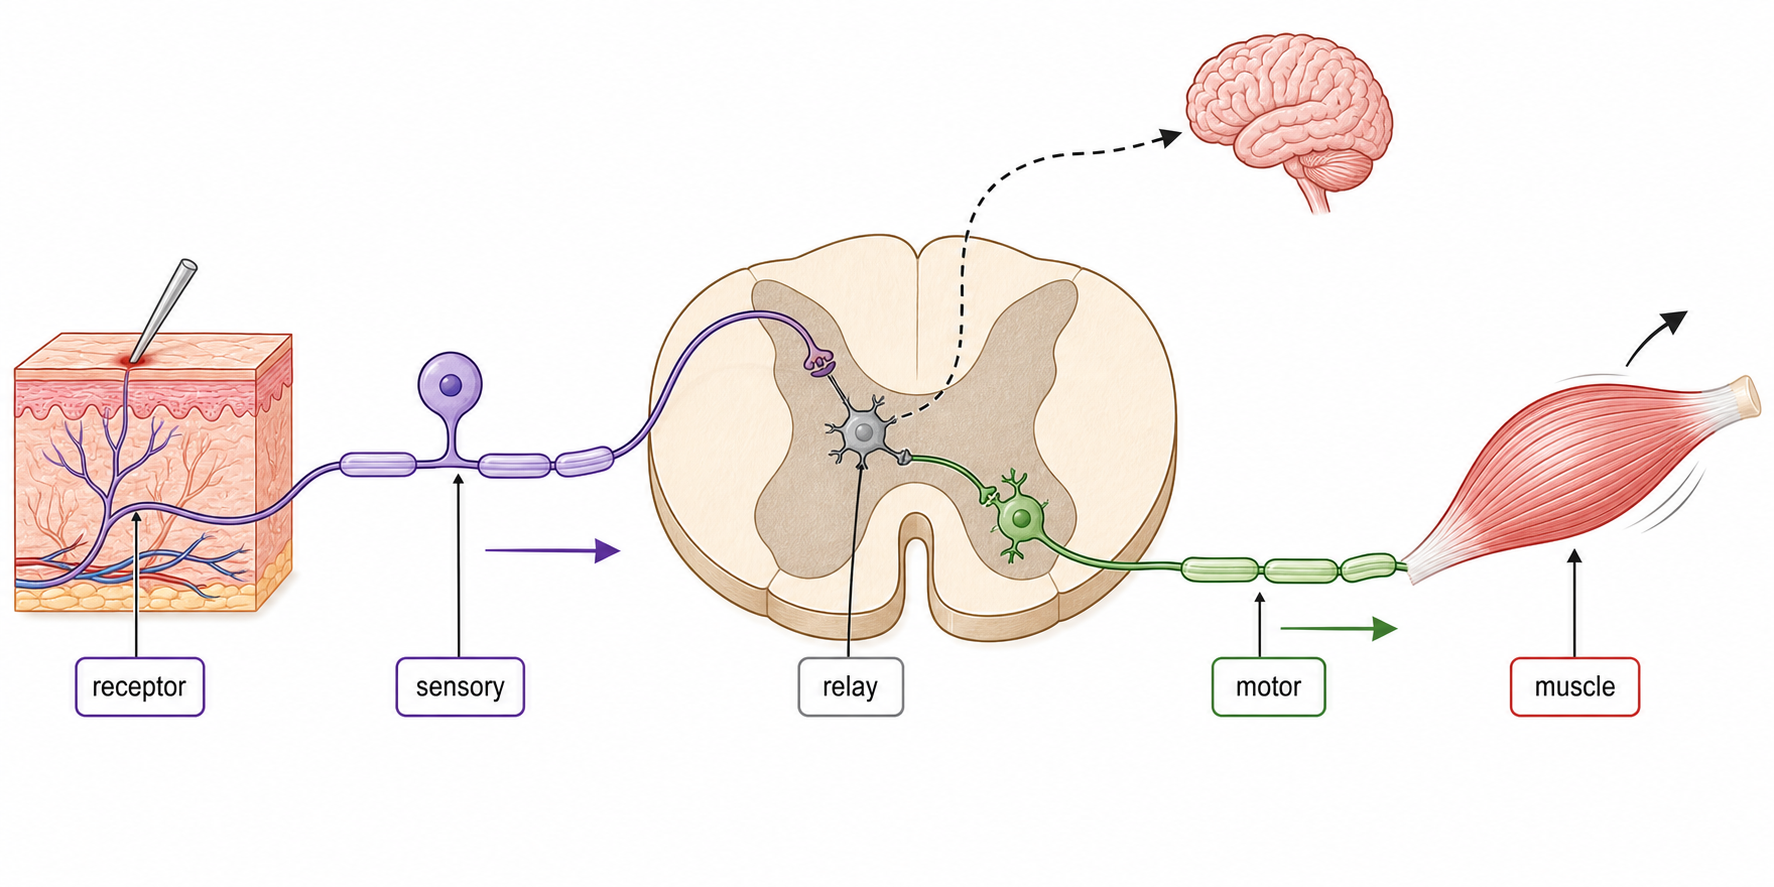
A pain withdrawal reflex is an involuntary response integrated in the spinal cord, with skeletal muscle as the effector.

A free sensory nerve ending in the hand detects a damaging stimulus. The sensory neuron enters the spinal cord and synapses with one interneuron in grey matter, which synapses with a motor neuron; the motor neuron stimulates a skeletal muscle to withdraw the hand.

Free nerve ending → sensory neuron → single interneuron in spinal grey matter → motor neuron → skeletal-muscle contraction. The short spinal route starts withdrawal before conscious pain processing is complete.

Touching a hot object activates the pain receptor; flexor muscle contraction withdraws the hand while impulses also travel to the brain and pain becomes conscious.

The reflex does not bypass the CNS—the spinal cord is part of the CNS. The brain can be informed in parallel but is not required to initiate this immediate response.

Pain reflex arcs

Assessment in practice

1–3 marks
How it is assessed

This objective is assessed through experimental design, commonly using Define / Label / Explain.

Command terms

Define / Label / Explain / Draw / Identify / Outline / Describe / Annotate

What earns marks

Mark schemes reward named structures, correct direction of information flow and explanations that keep the sequence causal.

Watch for

Putting the brain before the spinal relay in a rapid pain reflex.

Representative question

Question 1

[Maximum number: 4]

Draw a labelled diagram of a reflex arc for a pain withdrawal reflex.

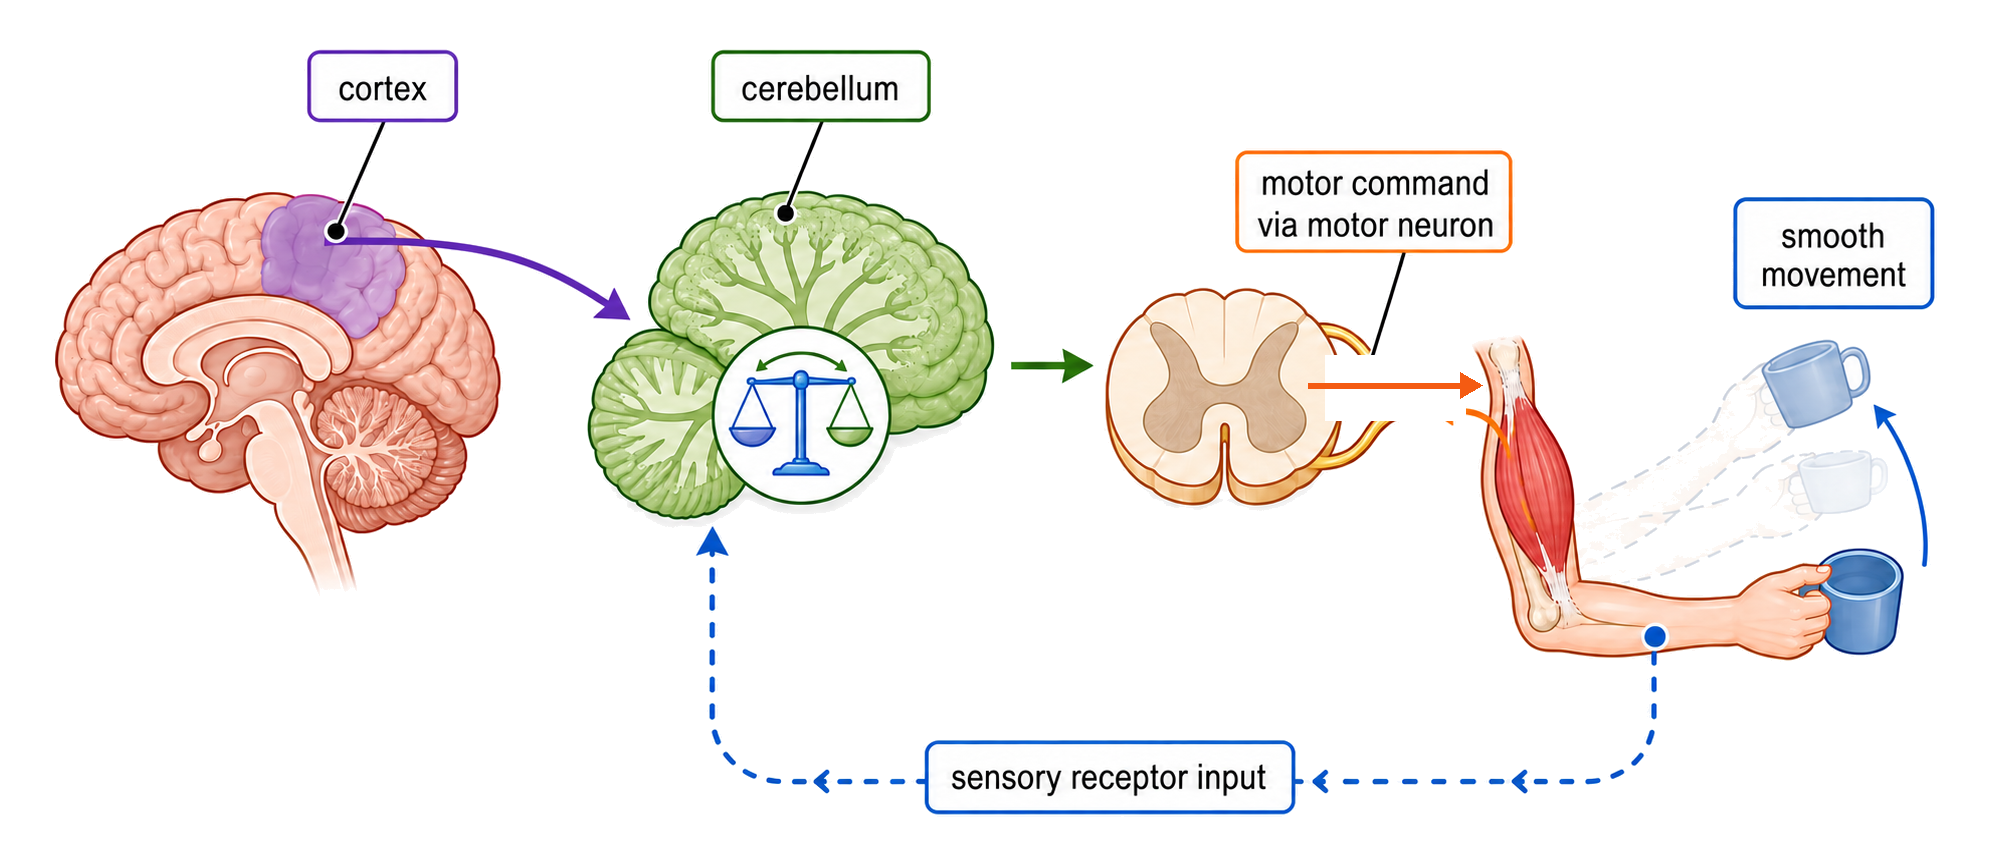
The cerebellum coordinates movement and balance

The cerebellum coordinates movement and balance.

The cerebellum compares intended movement with sensory feedback and adjusts motor output. It helps timing, posture, balance and smooth coordination rather than choosing the goal of a movement.

separate movement planning from coordination; link sensory feedback to corrective output.

If balance shifts while walking, cerebellar processing helps alter muscle activity before the person falls.

The cerebellum does not initiate every voluntary action; it refines the accuracy and timing of movement.

Cerebellum role

Assessment in practice

1 marks
How it is assessed

This objective is assessed through structured response, commonly using State / Identify / Describe.

Command terms

State / Identify / Describe

What earns marks

Mark schemes reward named structures, correct direction of information flow and explanations that keep the sequence causal.

Watch for

Naming a brain region without linking it to information integration or coordination.

Representative question

Question 1

[Maximum number: 2]

Describe the use of fMRI to identify the role of the cerebellum.

Melatonin links darkness to the body clock

Melatonin links darkness to the body clock.

Melatonin released by the pineal gland rises in darkness and helps synchronise circadian timing, including sleep propensity. Light reaching the retina can suppress its release.

light input → clock pathway → pineal melatonin → timing effect.

A bright screen late at night can delay the melatonin rise, shifting the timing signal even if the person feels tired.

Melatonin is a timing hormone, not an instant anaesthetic; sleep also depends on behaviour and other signals.

Melatonin and sleep

Assessment in practice

1 marks
How it is assessed

This objective is assessed through structured response, commonly using Explain / Identify / Describe.

Command terms

Explain / Identify / Describe / State / Deduce / Outline

What earns marks

Mark schemes reward named structures, correct direction of information flow and explanations that keep the sequence causal.

Watch for

Describing melatonin as a general energy hormone instead of a sleep-timing signal.

Representative question

Question 1

[Maximum number: 2]

Outline the role of melatonin in humans.

Epinephrine prepares several organs for immediate demand

Epinephrine prepares several organs for immediate demand.

Epinephrine from the adrenal medulla binds receptors in target tissues during acute stress. It raises cardiac output, widens airways and mobilises glucose so muscles can respond quickly.

hormone source; receptor-bearing target; response in heart, airways and liver; adaptive purpose.

A sudden threat increases epinephrine, accelerating heart rate and glycogen breakdown while reducing investment in digestion.

The hormone does not affect every cell equally: receptor type and tissue context determine the response.

Epinephrine (adrenaline)

Assessment in practice

1 marks
How it is assessed

This objective is assessed through structured response, commonly using State / Explain / Identify.

Command terms

State / Explain / Identify / Describe

What earns marks

Mark schemes reward named structures, correct direction of information flow and explanations that keep the sequence causal.

Watch for

Treating low oxygen as the only trigger and omitting carbon-dioxide-driven pH change.

Representative question

Question 1

[Maximum number: 2]

Describe two ways in which epinephrine in the body facilitates intense muscle contraction. [2]
1.
2.

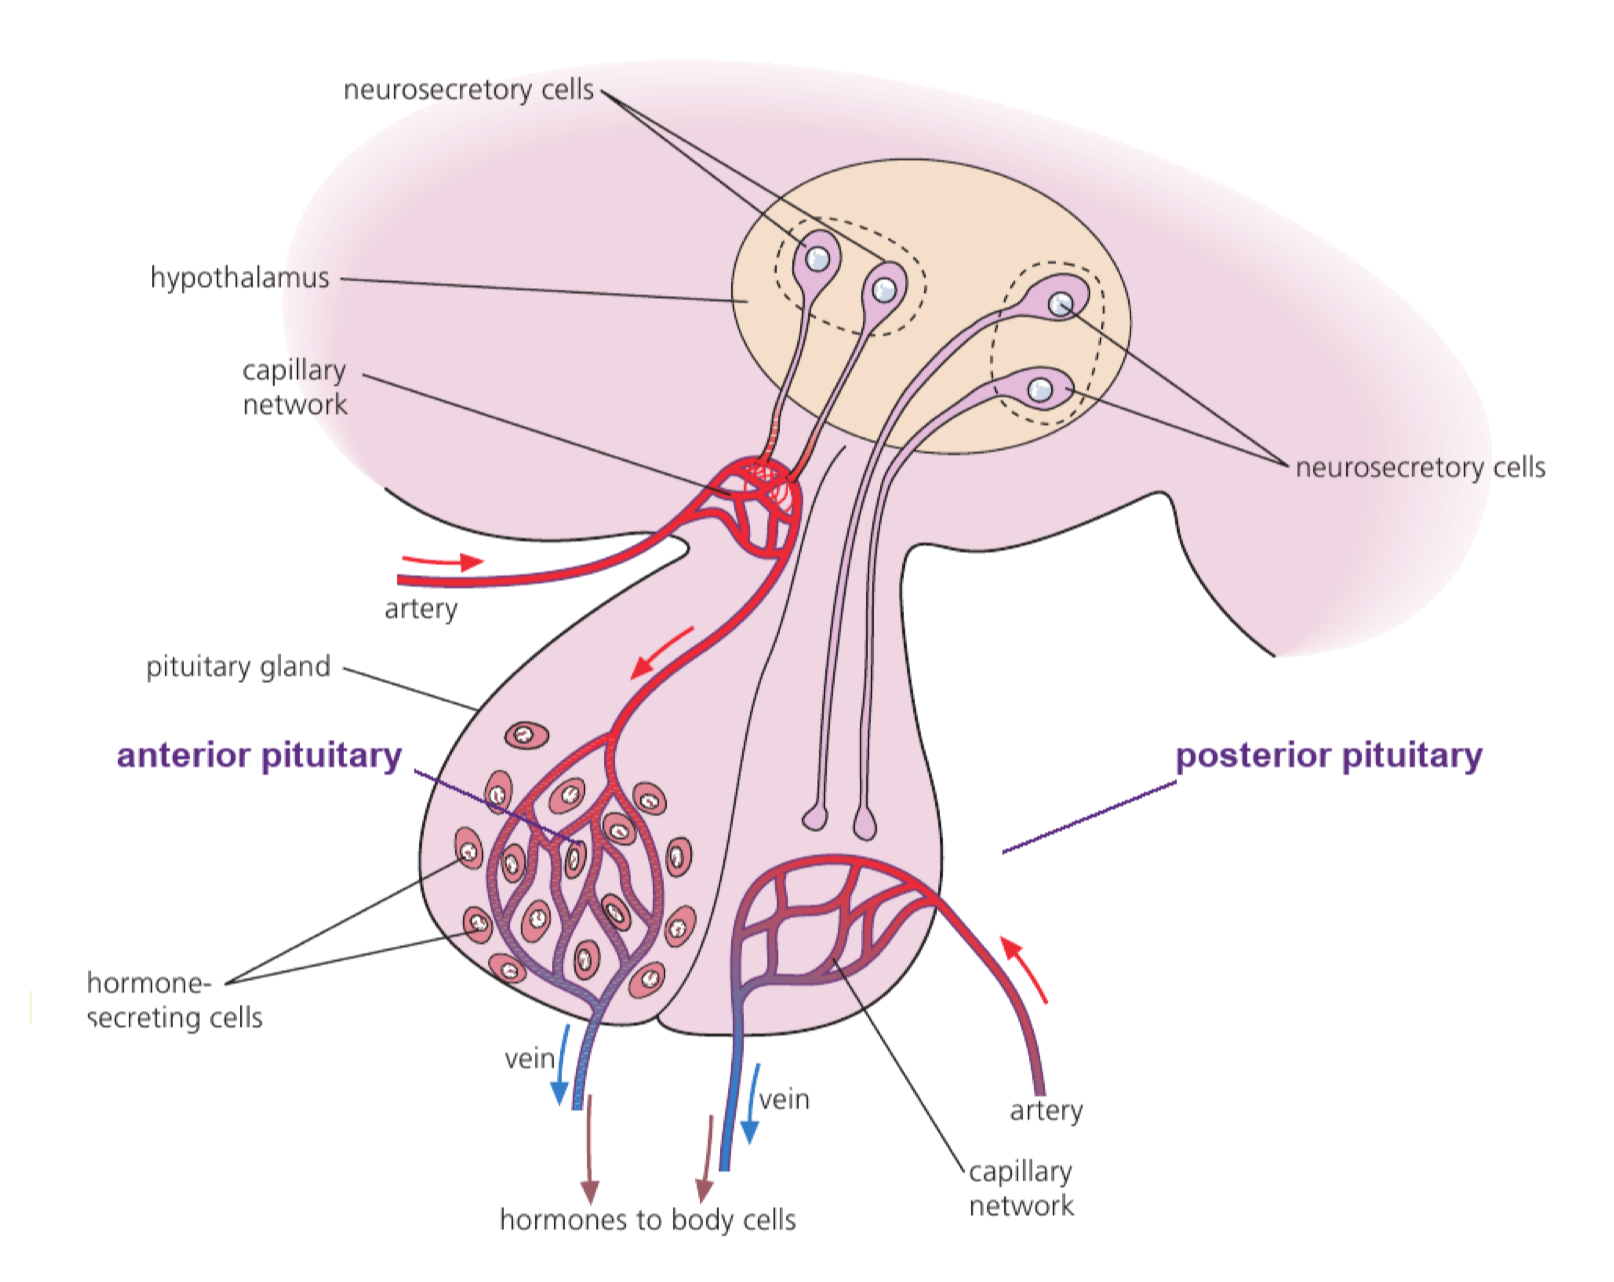
The hypothalamus coordinates endocrine control through the pituitary

The hypothalamus coordinates endocrine control through the pituitary.

The hypothalamus links neural information to hormone release and regulates the pituitary with releasing or inhibiting signals. Pituitary hormones then act on distant glands or tissues.

stimulus or brain signal → hypothalamus → pituitary → target gland/tissue → feedback.

A hypothalamic signal can control pituitary FSH release, which then influences reproductive tissues.

The hypothalamus and pituitary are control centres, not the final target for every hormone they regulate.

Hypothalamus and pituitary control

Assessment in practice

1–2 marks
How it is assessed

This objective is assessed through structured response, commonly using Suggest / Describe / State.

Command terms

Suggest / Describe / State / Identify / Label / Explain / Outline

What earns marks

Mark schemes reward named structures, correct direction of information flow and explanations that keep the sequence causal.

Watch for

Confusing releasing hormones from the hypothalamus with hormones secreted by the pituitary.

Representative question

Question 1

[Maximum number: 7]

Explain the roles of named hormones in the development and function of the sexual reproductive systems in males and females.

Heart rate is adjusted by feedback from the body

Heart rate is adjusted by negative feedback after baroreceptors and chemoreceptors send sensory information to the medulla.

Baroreceptors in the carotid sinus and aortic arch monitor arterial pressure. Chemoreceptors in carotid and aortic bodies and the brainstem monitor blood pH and oxygen/carbon-dioxide concentrations.

The medulla integrates this input and changes autonomic nerve impulses to the heart. This alters heart rate and the strength of contraction, changing stroke volume so circulation opposes the detected disturbance.

If arterial pressure falls, reduced baroreceptor firing causes medullary output that increases heart rate and contraction strength, helping restore cardiac output and pressure.

Heart rate is only one component of cardiac output: cardiac output = heart rate × stroke volume. Receptors detect changes; the medulla coordinates the response.

Heart rate feedback control

Assessment in practice

1–4 marks
How it is assessed

This objective is assessed through structured response, commonly using Outline / Identify / State.

Command terms

Outline / Identify / State / Compare / Describe / Explain

What earns marks

Mark schemes reward named structures, correct direction of information flow and explanations that keep the sequence causal.

Watch for

Treating low oxygen as the only trigger and omitting carbon-dioxide-driven pH change.

Representative question

Question 1

[Maximum number: 7]

Explain the control mechanism of the heart rate.

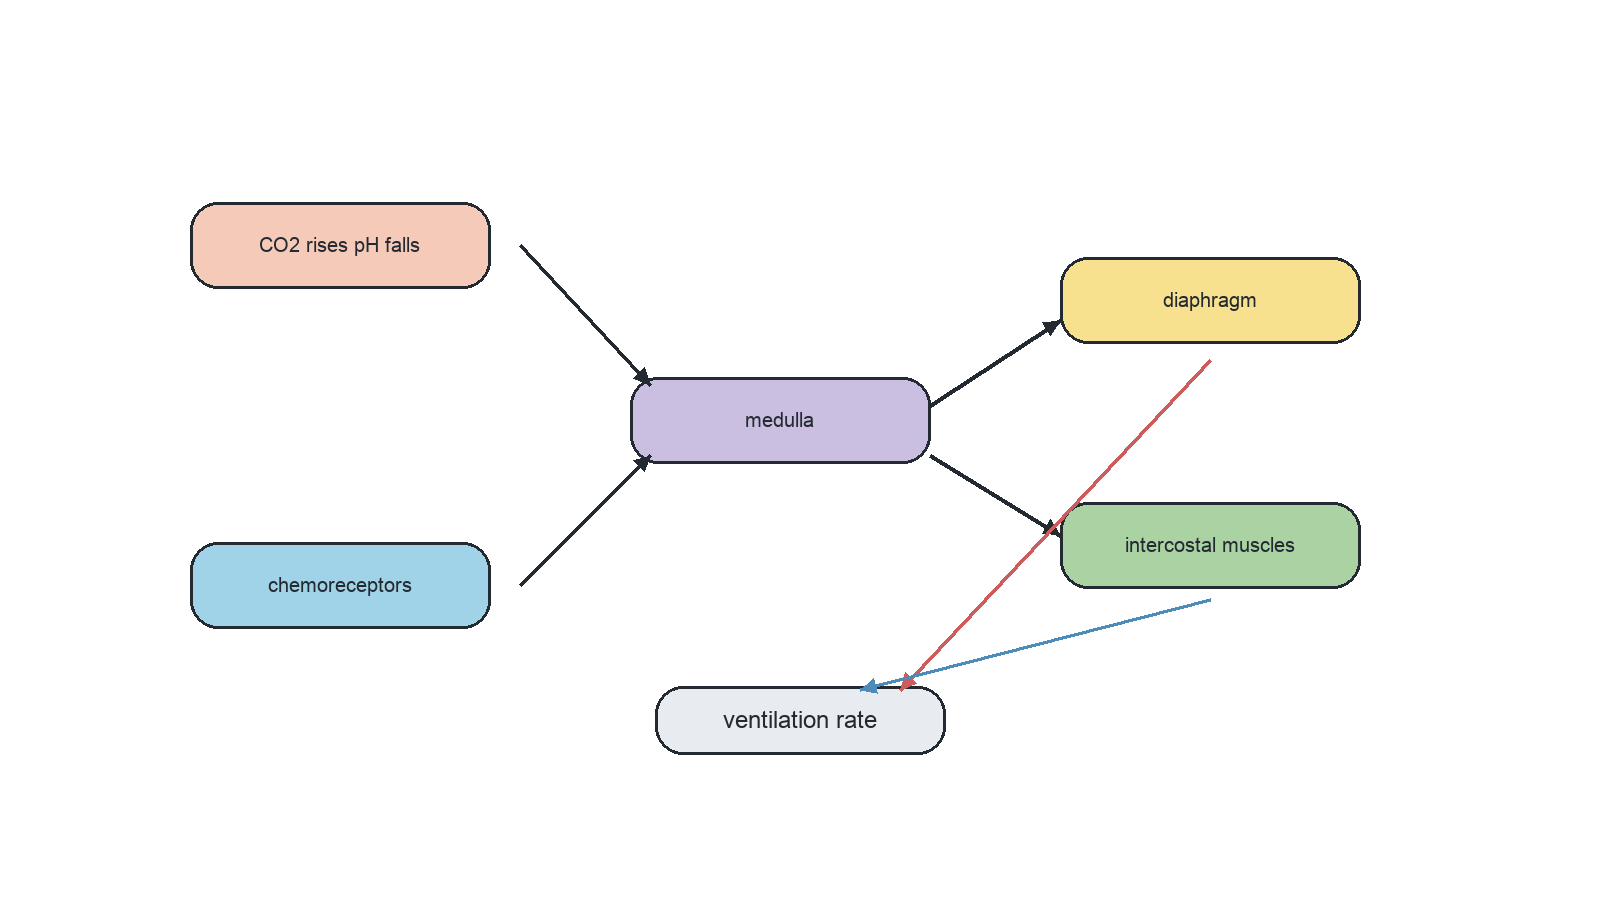
Ventilation feedback matches breathing to CO₂ demand

Ventilation rate is controlled by negative feedback from chemoreceptors that detect blood-pH changes linked mainly to carbon dioxide.

CO₂ dissolves and forms carbonic acid, increasing H⁺ and lowering pH. Chemoreceptors in the brainstem detect the change; the respiratory control centre sends nerve impulses to the diaphragm and intercostal muscles to alter breathing rate and depth.

Raised CO₂ → lower pH → brainstem chemoreceptor input → stronger or more frequent signals to diaphragm/intercostals → increased ventilation → more CO₂ removed → pH moves back toward normal.

During exercise, increased respiration produces extra CO₂. Ventilation rises, increasing gas exchange and limiting the fall in blood pH.

The lungs do not directly decide how to correct pH. Chemoreceptor detection and nervous output to breathing muscles coordinate the response.

Ventilation rate feedback control

Assessment in practice

1–3 marks
How it is assessed

This objective is assessed through structured response, commonly using Explain / State / Outline.

Command terms

Explain / State / Outline / Identify

What earns marks

Mark schemes reward named structures, correct direction of information flow and explanations that keep the sequence causal.

Watch for

Treating low oxygen as the only trigger and omitting carbon-dioxide-driven pH change.

Representative question

Question 1

[Maximum number: 8]

Explain the causes of a decreased blood pH and its effects on the ventilation rate in humans.

Peristalsis moves gut contents by coordinated smooth muscle

Control of movement through the digestive tract shifts between voluntary CNS actions at the endpoints and involuntary enteric control between them.

The central nervous system voluntarily initiates swallowing and participates in voluntary control of faecal egestion. Between these points, the enteric nervous system coordinates circular and longitudinal smooth-muscle contractions that move contents by peristalsis.

Voluntary initiation of swallowing → involuntary ENS-coordinated peristalsis through gut → voluntary component of egestion. Local stretch and chemical signals help the ENS coordinate contraction behind and relaxation ahead.

After a person chooses to swallow, an oesophageal peristaltic wave moves the bolus to the stomach without conscious control.

Peristalsis is not one simultaneous squeeze and is not consciously directed along the whole gut; the ENS coordinates the travelling pattern between voluntary endpoints.

Peristalsis control

Assessment in practice

1–3 marks
How it is assessed

This objective is assessed through structured response, commonly using Outline / Identify.

Command terms

Outline / Identify

What earns marks

Mark schemes reward named structures, correct direction of information flow and explanations that keep the sequence causal.

Watch for

Giving a general body-system answer without the specific pathway step for peristalsis control in the gut.

Representative question

Question 1

[Maximum number: 3]

Outline how food is moved from the stomach to the large intestine.

Body-System Integration

  • Nervous signals, hormones and blood transport integrate organs into coordinated systems; emergent functions arise from their interactions.
  • Sensory neurons carry receptor input to the CNS; motor neurons carry output to effectors. Mixed nerves contain both fibre types.
  • Reflex arcs provide rapid involuntary responses through sensory, relay and motor neurons. The spinal cord also links the brain and peripheral nerves.
  • Cerebral hemispheres support conscious processing; the cerebellum coordinates movement and balance; the medulla adjusts ventilation and heart activity.
  • The hypothalamus links nervous and endocrine control through the pituitary. Pineal melatonin helps time sleep; adrenal epinephrine supports acute stress responses.
  • Baroreceptors and chemoreceptors provide feedback about pressure, CO2, pH and O2.
  • The CNS controls voluntary swallowing and egestion, while the enteric nervous system coordinates gut peristalsis.

Topic C3.2

C3.2 Defence against disease

Defence against disease combines physical barriers, clotting, phagocytes, lymphocyte specificity, vaccination, antibiotics and evolutionary responses to pathogens across human populations.

44% of analysed papers 62 papers · 77 questions

Objectives in this topic

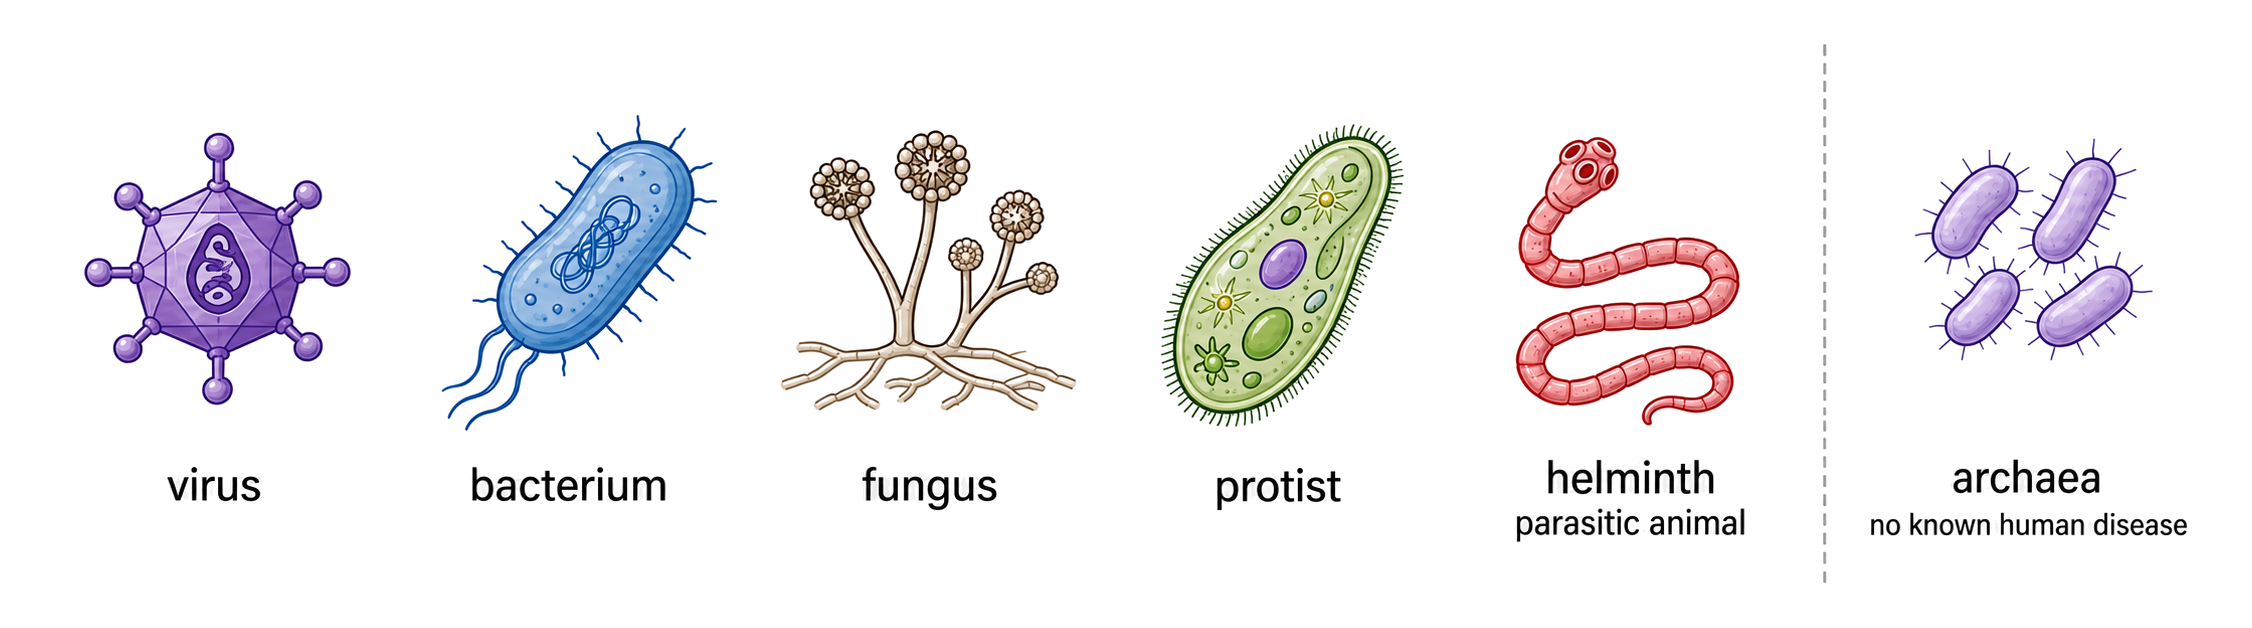
Pathogens cause disease by entering and damaging a host

Pathogens cause disease by entering and damaging a host.

A pathogen is a disease-causing organism or particle. Bacteria, viruses, fungi and protists reproduce or use host cells in ways that disrupt tissues, release toxins or trigger damaging inflammation.

classify the pathogen; route of entry/transmission; host process disrupted; resulting signs.

A respiratory virus enters droplets, infects airway cells and spreads before the immune response clears it.

Pathogen presence is not identical to symptoms: dose, host susceptibility and immune response also affect disease.

Pathogens cause infectious diseases

Assessment in practice

2–3 marks
How it is assessed

This objective is assessed through structured response, commonly using Describe / Distinguish / Outline.

Command terms

Describe / Distinguish / Outline / Define / State / Explain

What earns marks

Mark schemes repeatedly reward named details, correct sequence and clear distinctions between similar processes.

Watch for

Naming symptoms without linking them to the causative pathogen or transmission route.

Representative question

Question 1

[Maximum number: 6]

Describe the cause, transmission and effects of malaria.

Skin and mucous membranes block entry

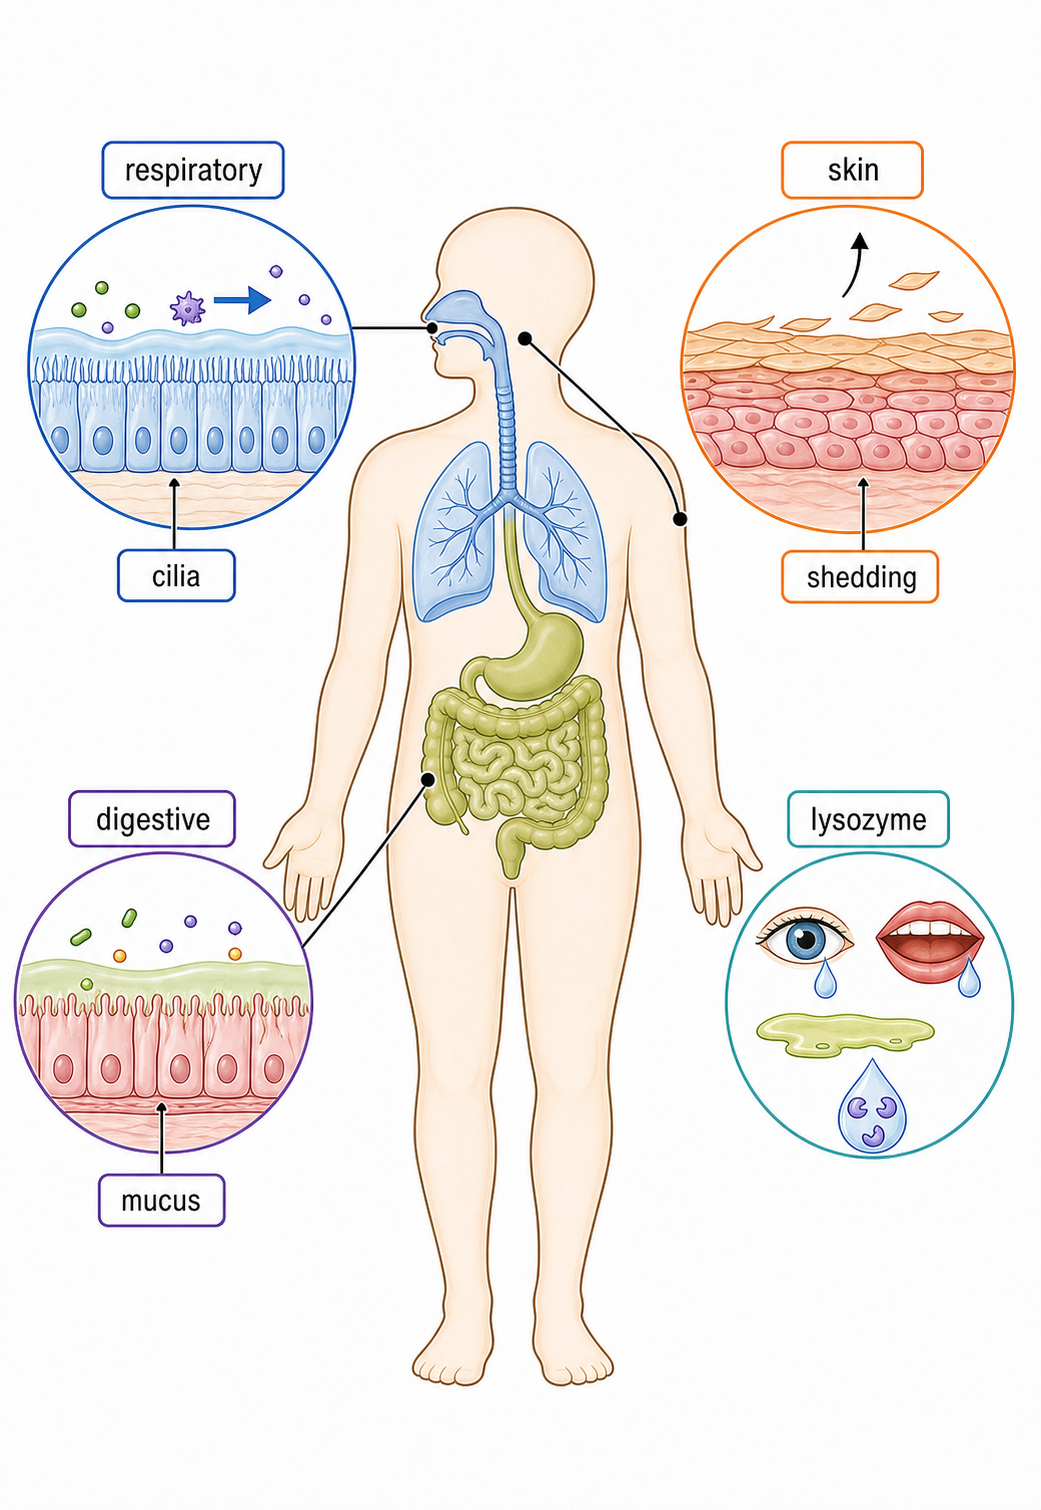
Skin and mucous membranes block entry.

Keratinised skin forms a physical barrier, while mucus traps particles and cilia move them away. Secretions such as lysozyme, tears and stomach acid add chemical protection.

barrier; trapped or killed agent; route out; limitation if the barrier is breached.

Mucus in an airway traps microbes and cilia move the mucus toward the throat, reducing access to lung tissue.

These are first-line defences, not antigen-specific memory responses.

Skin and mucous membranes

Assessment in practice

1–3 marks
How it is assessed

This objective is assessed through structured response, commonly using State / Describe.

Command terms

State / Describe

What earns marks

Mark schemes repeatedly reward named details, correct sequence and clear distinctions between similar processes.

Watch for

Naming symptoms without linking them to the causative pathogen or transmission route.

Representative question

Question 1

[Maximum number: 3]

Describe how disease-causing bacteria are prevented from entering the body.

Clotting seals a damaged blood vessel

Blood clotting rapidly seals a cut in the skin, limiting blood loss and pathogen entry.

Platelets at damaged tissue release clotting factors that start a cascade. The cascade produces thrombin, which rapidly converts soluble fibrinogen into insoluble fibrin strands.

Cut → platelet activation and clotting-factor release → cascade → thrombin → fibrinogen converted to fibrin → fibrin mesh traps erythrocytes → clot seals wound.

At a skin cut, the fibrin mesh stabilizes the platelet plug and traps red blood cells, forming a clot that can dry into a protective scab.

Thrombin converts fibrinogen to fibrin; it is not the mesh itself. Further clotting-factor details are outside this objective.

Blood clotting

Assessment in practice

1–2 marks
How it is assessed

This objective is assessed through structured response, commonly using Identify / Describe / State.

Command terms

Identify / Describe / State / Explain / Outline

What earns marks

Mark schemes repeatedly reward named details, correct sequence and clear distinctions between similar processes.

Watch for

Reversing fibrinogen and fibrin in the clotting sequence.

Representative question

Question 1

[Maximum number: 7]

Explain how blood clotting occurs and the consequence for a person who has hemophilia.

Innate and adaptive immunity solve different problems

Innate immunity responds to broad pathogen categories and remains essentially unchanged during life; adaptive immunity targets particular antigens and forms memory.

Feature Innate immune system Adaptive immune system
Recognition Broad pathogen categories Specific antigen
First response Rapid Slower while specific cells activate
Change during life No antigen-specific improvement Builds memory after exposure
Re-exposure Similar response Faster and more effective response
Required cell example Phagocyte Lymphocyte

Phagocytes can engulf unfamiliar bacteria immediately, while a later exposure to the same antigen triggers a faster antibody response from retained adaptive memory cells.

Innate does not mean weak, and adaptive does not mean immediate. For this objective, no innate component other than phagocytes needs to be named.

Innate vs. adaptive immune system

Assessment in practice

1 marks
How it is assessed

This objective is assessed through structured response, commonly using Identify / Distinguish.

Command terms

Identify / Distinguish

What earns marks

Mark schemes repeatedly reward named details, correct sequence and clear distinctions between similar processes.

Watch for

Calling phagocytosis specific immunity instead of a broad innate response.

Representative question

Question 1

[Maximum number: 1]

Distinguish between innate and adaptive immune response.

The graph shows the magnitude of the immune response after infection or after vaccination over time.

Phagocytes remove invaders by engulfing them

Phagocytes control infection by leaving the blood, moving amoeboidly to infected tissue, recognizing pathogens, engulfing them and digesting them.

Chemical signals guide phagocytes to an infection site. The flexible cell membrane changes shape during amoeboid movement and encloses a recognized pathogen by endocytosis in a vesicle.

Blood → amoeboid movement into infected tissue → pathogen recognition → endocytosis/phagosome → lysosome fusion → lysosomal enzymes digest pathogen.

A neutrophil leaves a capillary, crawls through tissue, encloses a bacterium and digests it after lysosomes fuse with the phagosome.

Phagocytosis is an innate cellular response, not antibody production. Engulfment contains the pathogen; lysosomal enzymes perform digestion.

Phagocytes exam focus

Assessment in practice

1–4 marks
How it is assessed

This objective is assessed through structured response, commonly using Describe / Outline / Identify.

Command terms

Describe / Outline / Identify

What earns marks

Mark schemes repeatedly reward named details, correct sequence and clear distinctions between similar processes.

Watch for

Naming symptoms without linking them to the causative pathogen or transmission route.

Representative question

Question 1

[Maximum number: 4]

Describe how phagocytic leucocytes may act as a defence against disease.

Lymphocytes provide specific immune recognition

Lymphocytes are adaptive immune cells that circulate in blood and are also concentrated in lymph nodes, where antigen-specific cells cooperate to produce antibodies.

An individual has a very large number of B lymphocytes with different receptors. Each B-cell clone is capable of making one specific type of antibody, so the population collectively recognizes many antigens.

Location: blood and lymph nodes. Diversity: many B-cell specificities. Cooperation: antigen-specific helper T cells help activate matching B cells, which can form antibody-secreting cells.

Only the small B-cell population with receptors complementary to a viral surface antigen is selected to produce antibodies against that antigen.

One B cell does not make every antibody. Large population diversity plus cooperation between lymphocytes creates the adaptive repertoire.

Lymphocytes exam focus

Assessment in practice

1–7 marks
How it is assessed

This objective is assessed through structured response, commonly using Explain / Outline / Identify.

Command terms

Explain / Outline / Identify

What earns marks

Mark schemes repeatedly reward named details, correct sequence and clear distinctions between similar processes.

Watch for

Confusing plasma cells, memory cells and helper T-cells in the activation sequence.

Representative question

Question 1

[Maximum number: 7]

Explain how cells in the bloodstream cause a specific immune response.

An antigen is the feature an immune receptor recognises

An antigen is a recognition molecule that can bind a specific antibody or lymphocyte receptor and trigger antibody production.

Most antigens are glycoproteins or other proteins and are located on the outer surface of a pathogen, where immune receptors can encounter them.

Antigen = molecular target, not the whole pathogen. Complementary receptor binding selects an antigen-specific response; different surface antigens select different lymphocyte clones.

Erythrocyte surface antigens from an incompatible blood group can stimulate antibody binding and production after transfusion, causing dangerous cell agglutination or destruction.

An antigen is not automatically an entire foreign organism. It is a recognizable molecule or molecular region, commonly a surface protein or glycoprotein.

Antigens exam focus

Assessment in practice

1 marks
How it is assessed

This objective is assessed through multiple choice, commonly using Identify.

Command terms

Identify

What earns marks

Mark schemes repeatedly reward named details, correct sequence and clear distinctions between similar processes.

Watch for

Naming symptoms without linking them to the causative pathogen or transmission route.

Representative question

Question 1

[Maximum number: 1]

What is a characteristic of antigens?

A

They recognize foreign substances

B

They are produced in bone marrow

C

They cause disease in humans

D

They stimulate the production of antibodies

B cells activate only after antigen-specific signals

An antigen-specific B lymphocyte is activated only after it interacts directly with its matching antigen and receives contact-dependent help from an activated helper T lymphocyte specific to the same antigen.

The two matching signals confirm antigen identity before the B cell divides. After activation, the B cell can produce antibody-secreting plasma cells and retained memory cells.

Specific antigen binds B-cell receptor → helper T cell activated by the same antigen contacts B cell → B cell activates → clonal expansion → plasma and memory cells.

A B cell recognizing one viral protein receives help only from a helper T cell activated by that same antigen type, preventing an unrelated B-cell clone from expanding.

Direct antigen binding alone is not sufficient in this model, and helper T-cell contact must be antigen-matched. Unactivated B cells do not yet secrete large antibody quantities.

B-lymphocyte activation

Assessment in practice

1–7 marks
How it is assessed

This objective is assessed through structured response, commonly using Identify / Describe / Explain.

Command terms

Identify / Describe / Explain / Outline

What earns marks

Mark schemes repeatedly reward named details, correct sequence and clear distinctions between similar processes.

Watch for

Confusing plasma cells, memory cells and helper T-cells in the activation sequence.

Representative question

Question 1

[Maximum number: 7]

Explain the production of antibodies when a patient is infected with the TB bacterium.

Plasma cells are antibody factories made by clonal selection

Because only a small number of B cells recognize a given antigen, an activated B cell divides repeatedly by mitosis to form a large clone.

Clonal expansion supplies enough plasma cells to secrete an effective quantity of one antibody type. Every plasma cell in the clone inherits the selected antibody specificity.

Rare matching B cell → activation → repeated mitosis → clone of genetically matching cells → many plasma cells secrete the same specific antibody; some cells can become memory cells.

A selected B cell responding to a bacterial surface antigen produces thousands of plasma-cell descendants, all releasing antibodies complementary to that antigen.

Antibodies are secreted in quantity by differentiated plasma cells, not by every inactive B cell. Mitosis increases cell number without changing specificity.

Clones of plasma cells

Assessment in practice

1 marks
How it is assessed

This objective is assessed through multiple choice, commonly using Identify / State.

Command terms

Identify / State

What earns marks

Mark schemes repeatedly reward named details, correct sequence and clear distinctions between similar processes.

Watch for

Confusing plasma cells, memory cells and helper T-cells in the activation sequence.

Representative question

Question 1

[Maximum number: 1]

What is a role of activated B cells?

A

Secrete antibiotics in response to specific antigens

B

Activate T cells in the immune response

C

Release histamine in response to allergens

D

Multiply to form clones of plasma cells

Memory cells accelerate a second response

Memory cells accelerate a second response.

Some activated B and T cells persist as memory cells. On re-exposure they respond more rapidly and strongly, often preventing noticeable disease.

primary exposure; memory formation; secondary exposure; faster/larger response.

A booster vaccine re-stimulates memory cells, producing protective antibody levels sooner than the first dose.

Memory is antigen-specific and can weaken; it does not make a person immune to every pathogen.

Immunity from memory cells

Assessment in practice

1–3 marks
How it is assessed

This objective is assessed through structured response, commonly using State / Suggest / Identify.

Command terms

State / Suggest / Identify / Explain

What earns marks

Mark schemes repeatedly reward named details, correct sequence and clear distinctions between similar processes.

Watch for

Confusing plasma cells, memory cells and helper T-cells in the activation sequence.

Representative question

Question 1

[Maximum number: 3]

Suggest possible reasons for the observed pattern of presence of antibodies in vaccinated mice.

The summer after vaccination, the prevalence of B. burgdorferi infection in tick nymphs collected on mice from the two sites was measured.

\cline { 2 - 5 } \multicolumn{1}{c|}{}State of infection of tick nymphs with B. burgdorferi
\cline { 2 - 5 } \multicolumn{1}{c|}{}Site 1Site 2
Host miceInfectedNot infectedInfectedNot infected
Control mice903155789
Vaccinated mice8728849121

HIV spreads through particular body-fluid routes

HIV spreads through particular body-fluid routes.

HIV transmission requires infected blood, semen, vaginal fluids or breast milk to reach susceptible tissue. It is not spread by casual contact, food sharing or intact skin.

source fluid; route of exposure; susceptible tissue; prevention barrier.

Sharing a contaminated needle can transfer infected blood directly into circulation, whereas a handshake cannot.

Transmission risk depends on exposure and viral load; a positive test does not identify the route by itself.

HIV transmission

Assessment in practice

1 marks
How it is assessed

This objective is assessed through multiple choice, commonly using Explain.

Command terms

Explain

What earns marks

Mark schemes repeatedly reward named details, correct sequence and clear distinctions between similar processes.

Representative question

Question 1

[Maximum number: 1]

How has the transmission of HIV been reduced?

A

Delaying the progression of HIV to AIDS

B

Single use of disposable needles

C

Treatment with antibiotics

D

Vaccination

HIV can cause AIDS by reducing CD4 T cells

HIV can cause AIDS by reducing CD4 T cells.

HIV infects and progressively destroys CD4 helper T cells. As immune coordination falls, opportunistic infections and cancers become more likely; this clinical state is AIDS.

HIV entry/replication; CD4 decline; loss of coordination; opportunistic disease.

A person with low CD4 counts may develop an infection that a healthy immune system would normally control.

HIV infection and AIDS are not synonyms: treatment can delay or prevent progression to AIDS.

HIV infection and AIDS

Assessment in practice

1 marks
How it is assessed

This objective is assessed through structured response, commonly using Identify / Explain / Discuss.

Command terms

Identify / Explain / Discuss

What earns marks

Mark schemes repeatedly reward named details, correct sequence and clear distinctions between similar processes.

Watch for

Confusing plasma cells, memory cells and helper T-cells in the activation sequence.

Representative question

Question 1

[Maximum number: 4]

Discuss the consequences of infection with HIV.

Antibiotics target bacterial processes

Antibiotics are chemicals that block processes in bacteria while having little or no effect on corresponding processes in eukaryotic host cells.

Selective targets include bacterial cell-wall synthesis or bacterial ribosomes. Human cells lack bacterial walls and their cytoplasmic ribosomes differ, allowing a susceptible bacterial infection to be treated without the same target effect on human cells.

Identify bacterial target → explain disrupted bacterial process → explain why eukaryotic cells lack or differ in that target → predict treatment only for susceptible bacteria.

An antibiotic that blocks bacterial peptidoglycan-wall synthesis can stop dividing bacteria, while human cells have no peptidoglycan wall to block.

Viruses have no bacterial cell wall, ribosome or independent bacterial metabolism; they replicate using host-cell machinery. Antibiotics therefore do not control viral infections.

Antibiotics exam focus

Assessment in practice

1–2 marks
How it is assessed

This objective is assessed through structured response, commonly using Explain / Outline / Identify.

Command terms

Explain / Outline / Identify / Distinguish / Suggest

What earns marks

Mark schemes repeatedly reward named details, correct sequence and clear distinctions between similar processes.

Watch for

Explaining antibiotic action as antibody stimulation instead of inhibition of bacterial processes.

Representative question

Question 1

[Maximum number: 3]

(i) Estimate the diameter of the zone of inhibition of chloramphenicol.
(ii) Distinguish between the action of tetracycline and penicillin on B. subtilis.
(iii) Suggest a reason for the result with disc X .

Resistance spreads when antibiotics select variants

Antibiotic exposure selects resistant bacterial variants, allowing strains resistant to several antibiotics to evolve and spread.

Resistance genes arise through mutation or are acquired from other bacteria. An antibiotic kills susceptible cells, while resistant survivors reproduce and pass resistance vertically or transfer genes horizontally.

Existing genetic variation → antibiotic selection → resistant survival → reproduction/gene transfer → resistance frequency rises → different resistance genes can accumulate in one multiresistant strain.

Repeated exposure to different antibiotics can successively select a pathogenic strain carrying resistance to several drug classes, leaving fewer effective treatments.

Antibiotics do not direct bacteria to mutate. Careful use—only when appropriate, with the prescribed agent and regimen—reduces unnecessary selection pressure but cannot make evolution impossible.

Antibiotic resistance evolution

Assessment in practice

1–4 marks
How it is assessed

This objective is assessed through structured response, commonly using Explain / Compare / Discuss.

Command terms

Explain / Compare / Discuss / Suggest / Identify / Describe / State / Outline

What earns marks

Mark schemes repeatedly reward named details, correct sequence and clear distinctions between similar processes.

Watch for

Saying antibiotics cause directed mutations instead of selecting pre-existing or transferred resistance.

Representative question

Question 1

[Maximum number: 9]

Explain how natural selection can lead to evolution using antibiotic resistance in bacteria as an example.

Zoonoses cross from animal reservoirs into people

A zoonosis is an infectious disease that can transfer from another animal species to humans, through several different transmission routes.

Zoonosis Animal link and route to humans
Tuberculosis Some strains can pass from infected cattle or other animals through close exposure or contaminated animal products
Rabies Virus in saliva is commonly transferred by the bite of an infected mammal
Japanese encephalitis Mosquito vectors transfer virus maintained among animal hosts such as pigs and birds
COVID-19 A recently emerged infection that transferred from another species, followed by extensive human-to-human respiratory transmission

Zoonoses are prevalent among human infectious diseases because humans interact with livestock, wildlife, food systems and vectors. Ecology and behaviour change the opportunities for cross-species exposure.

Animal origin does not guarantee efficient human-to-human spread. Identify the reservoir or animal link, the transfer route and whether onward human transmission occurs.

Zoonoses exam focus

Assessment in practice

1 marks
How it is assessed

This objective is assessed through structured response, commonly using State / Identify / Explain.

Command terms

State / Identify / Explain

What earns marks

Mark schemes repeatedly reward named details, correct sequence and clear distinctions between similar processes.

Watch for

Defining zoonoses as diseases from zoos rather than transfer from other animal species.

Representative question

Question 1

[Maximum number: 1]

State the term used for an infectious disease that can transfer from other species to humans.

Vaccines create immune memory without the full disease

Vaccination stimulates immunity to a specific pathogen without causing the disease itself.

A vaccine supplies pathogen antigens directly, or supplies DNA or RNA sequences that host cells use to make the antigen. Adaptive immune activation produces specific effector cells and retained memory cells.

Antigen vaccine: antigen is delivered. Nucleic-acid vaccine: DNA/RNA code for antigen is delivered. Both expose the immune system to the target antigen and develop memory without the full infection.

After immunization, later exposure to the pathogen reactivates antigen-specific memory cells, producing a faster response that can prevent disease.

A vaccine does not need to contain a live pathogen. Protection is antigen-specific and may require multiple doses or boosters.

Vaccines and immunization

Assessment in practice

1–2 marks
How it is assessed

This objective is assessed through structured response, commonly using Identify / Explain / Calculate.

Command terms

Identify / Explain / Calculate / Outline / Suggest / Sketch

What earns marks

Mark schemes repeatedly reward named details, correct sequence and clear distinctions between similar processes.

Watch for

Confusing plasma cells, memory cells and helper T-cells in the activation sequence.

Representative question

Question 1

[Maximum number: 8]

Some prokaryotes cause infectious disease in humans. Explain the principles of vaccination.

Herd immunity protects some people indirectly

Herd immunity protects some people indirectly.

When enough people are immune, an infectious case has fewer susceptible contacts and transmission chains are interrupted. The required coverage depends on pathogen transmissibility and mixing.

immune fraction; contact network; effective reproduction; vulnerable people left unprotected.

High measles vaccination coverage can prevent an imported case from reaching many susceptible people.

A simple percentage threshold is not universal; immunity may wane and coverage can be clustered unevenly.

Pandemic data need denominators and context

COVID-19 data must be compared using consistent definitions, time windows and denominators, with percentage change and percentage difference chosen for different questions.

Percentagechange=((newvalueoriginalvalue)÷originalvalue)×100%.Percentagedifference=(valueAvalueB÷((valueA+valueB)÷2))×100%.Percentage change = ((new value − original value) ÷ original value) × 100\%. Percentage difference = (|value A − value B| ÷ ((value A + value B) ÷ 2)) × 100\%.

Use percentage change for movement from an earlier baseline to a later value. Use percentage difference to compare two values when neither is designated as the original baseline. Check whether counts, rates or proportions are being compared.

Cases rising from 100 to 130 gives percentage change = (30 ÷ 100) × 100 = 30%. Comparing rates 40 and 50 gives percentage difference = (10 ÷ 45) × 100 = 22.2% (3 s.f.).

A percentage is only interpretable with its denominator and context. Testing effort, case definitions, reporting delays, population size and time window can change apparent trends; association alone does not establish cause.

Defence Against Disease

  • Skin, mucus, cilia, lysozyme and clotting form primary barriers against pathogens.
  • Innate immunity is rapid and broad: phagocytes recognize, engulf and digest pathogens. Adaptive immunity is antigen-specific and forms memory.
  • Helper T-cells coordinate responses; activated B-cells undergo clonal selection, producing antibody-secreting plasma cells and memory cells. A second exposure therefore triggers a faster, stronger response.
  • HIV infects CD4 helper T-cells; their loss weakens immune coordination and can lead to AIDS.
  • Antibiotics target bacterial processes, not viruses. Antibiotic exposure selects resistant variants, which can spread by reproduction or plasmid transfer.
  • Vaccination creates active artificial immunity; high population immunity can indirectly protect susceptible people.
  • Evaluate disease and vaccine claims using reliable sources, trends, controlled comparisons, incidence and efficacy—not raw totals alone.

Topic C4.1

C4.1 Populations and communities

Populations and communities describe abundance, sampling, growth limits, species interactions and trophic controls that shape ecological patterns across habitats and ecosystems.

47% of analysed papers 66 papers · 102 questions

Objectives in this topic

A population is one species in one area

A population is an interacting group of organisms of the same species living in a defined area at the same time.

Members normally have opportunities to breed with one another. Reproductive isolation—little or no gene flow through breeding—can distinguish one population of a species from another.

State the species, spatial boundary and time; show interaction or breeding opportunity; use reproductive isolation to separate neighbouring populations when relevant.

Frogs of one species breeding in a connected pond system can form one population, while a geographically isolated group with no interbreeding is treated as a separate population.

A population is not every organism in a habitat—that is closer to a community. Sharing a species name alone is insufficient if groups are reproductively isolated.

Populations exam focus

Assessment in practice

1 marks
How it is assessed

This objective is assessed through structured response, commonly using Identify / Explain / State.

Command terms

Identify / Explain / State

What earns marks

Build the answer around this relationship: Populations must be linked to the correct ecological unit, method or species interaction.

Watch for

Confusing a population with a community or with all organisms in an ecosystem.

Representative question

Question 1

[Maximum number: 1]

State the biological term for a group of organisms of the same species living in an area.

Estimate population size with a defined method

Population size is estimated by random sampling when counting every individual is impractical, disruptive or impossible.

Random selection gives locations or individuals an unbiased chance of inclusion, making a sample more representative before its mean or marked fraction is extrapolated to the whole area.

Define target population and area → select positions or individuals randomly → standardize sampling effort → repeat → calculate estimate and uncertainty.

Random quadrat coordinates across a large meadow give an average plant density that can be multiplied by meadow area, avoiding convenient locations near a path.

Sampling error is the difference between the sample-based estimate and the true population size. Randomness reduces placement bias but cannot remove sampling error.

Population size estimation

Assessment in practice

1–3 marks
How it is assessed

This objective is assessed through structured response, commonly using Describe / Outline / Evaluate.

Command terms

Describe / Outline / Evaluate / Explain / State / Discuss / Suggest

What earns marks

Population size estimation is assessed through capture-mark-release-recapture population estimates, chi-squared testing of species association, transect and quadrat field sampling, quadrat sampling for population estimates.

Watch for

Confusing a population with a community or with all organisms in an ecosystem.

Representative question

Question 1

[Maximum number: 6]

Discuss how wild fish populations are assessed to ensure sustainable fishing practices.

Random quadrats reduce placement bias

Random quadrat sampling estimates abundance of sessile plants or animals whose individuals can be counted within a known area.

Map the study area, generate random coordinates, place equal-area quadrats at those positions, count individuals using a consistent boundary rule, repeat many times, and scale the mean count per quadrat to the total habitat area.

Use a calculator to obtain the standard deviation of quadrat counts. A small standard deviation suggests counts are similar and distribution is relatively even; a large standard deviation suggests strong spatial variation or clumping.

If 1 m² quadrats average 4 plants and the habitat is 250 m², the estimated population is 4 × 250 = 1,000 plants; the standard deviation shows how variable the counts were around that mean.

Quadrats suit sessile organisms, not freely moving animals. Random placement does not guarantee representation if too few or poorly sized quadrats are used; the standard-deviation formula need not be memorized.

Random quadrat sampling

Assessment in practice

2 marks
How it is assessed

This objective is assessed through structured response, commonly using Outline / Distinguish / Determine.

Command terms

Outline / Distinguish / Determine / Describe

What earns marks

Build the answer around this relationship: Random quadrat sampling must be linked to the correct ecological unit, method or species interaction.

Watch for

Confusing a population with a community or with all organisms in an ecosystem.

Representative question

Question 1

[Maximum number: 3]

Describe a method that can be used to measure the diversity of herbaceous plants in one of the green areas at different distances from the main road.

Capture–mark–recapture estimates mobile populations

Capture–mark–recapture estimates mobile populations.

A first sample is captured, marked harmlessly and released. After mixing, a second sample is taken; the marked fraction helps estimate the total population.

N≈(first caught × second caught)/marked recaptured; check mixing, mark retention and equal catchability.

If 40 fish are marked, 50 are caught later and 10 are marked, the estimate is about 200 fish.

The calculation fails if marks are lost, animals learn the trap or the population changes between samples.

Capture-mark-release-recapture exam focus

Assessment in practice

2–6 marks
How it is assessed

This objective is assessed through structured response, commonly using Describe / Outline / Explain.

Command terms

Describe / Outline / Explain / Identify

What earns marks

Key ideas include Capture Mark Release Recapture, Estimates, Motile, Animal, each tied to evidence about abundance, distribution, survival or species effects.

Watch for

Confusing a population with a community or with all organisms in an ecosystem.

Representative question

Question 1

[Maximum number: 6]

Explain the technique used to estimate the population size of a named species of organism that is able to move.

Carrying capacity is a resource-limited population size

Carrying capacity is a resource-limited population size.

Carrying capacity is the population size an environment can support over time under specified conditions. Resource limits and feedback make growth slow as the population approaches it.

identify limiting resource; link density to birth/death rate; state that capacity can change.

A drought lowers available food, so the carrying capacity for grazing animals falls even if the species is unchanged.

Carrying capacity is not a fixed species constant; it depends on environment and timescale.

Carrying capacity

Assessment in practice

1–6 marks
How it is assessed

This objective is assessed through structured response, commonly using Identify / Describe / Explain.

Command terms

Identify / Describe / Explain / Outline / State

What earns marks

Build the answer around this relationship: Carrying capacity must be linked to the correct ecological unit, method or species interaction.

Watch for

Confusing a population with a community or with all organisms in an ecosystem.

Representative question

Question 1

[Maximum number: 7]

Explain why populations that have grown exponentially reach a maximum size, rather than continue to grow.

Negative feedback restrains population growth

Negative feedback restrains population growth.

As density rises, competition, disease or predation can reduce births or increase deaths. The response opposes the change and tends to return population size toward a range.

disturbance → density-dependent response → birth/death change → correction.

Crowding increases disease transmission, lowering survival and slowing further population growth.

Not every population change is negative feedback; density-independent storms can reduce numbers without crowding.

Negative feedback control

Assessment in practice

1–2 marks
How it is assessed

This objective is assessed through structured response, commonly using Identify / Explain.

Command terms

Identify / Explain

What earns marks

Build the answer around this relationship: Negative feedback control must be linked to the correct ecological unit, method or species interaction.

Watch for

Confusing a population with a community or with all organisms in an ecosystem.

Representative question

Question 1

[Maximum number: 2]

Explain the change in numbers of the cactus moth throughout the study period.

Growth curves show changing net population rate

Population growth is exponential while resources are abundant and limiting factors are weak, but becomes sigmoid as density-dependent limits slow growth near carrying capacity.

During exponential growth, a roughly constant per-capita growth rate produces an increasingly steep rise. In a sigmoid model, competition and other density-dependent factors reduce net growth until births plus immigration balance deaths plus emigration near carrying capacity.

Test exponential growth by plotting population size on a logarithmic vertical axis against time on a linear horizontal axis: exponential data form an approximately straight line. For the IB sigmoid model, a separate lag phase is not expected.

An introduced population with abundant food may initially show a straight line on the semi-log graph; later points fall below that line as resource limitation increases and the population approaches a plateau.

A population curve is an idealized model, not a guaranteed trajectory. A steep slope means rapid change, not the greatest population size; migration, seasons and disturbances can alter the pattern.

Population growth curves

Assessment in practice

1–3 marks
How it is assessed

This objective is assessed through essay response, commonly using Draw / Identify / Label.

Command terms

Draw / Identify / Label / Outline / State / Explain / Discuss / Suggest / Compare

What earns marks

Build the answer around this relationship: Population growth curves must be linked to the correct ecological unit, method or species interaction.

Watch for

Confusing a population with a community or with all organisms in an ecosystem.

Representative question

Question 1

[Maximum number: 6]

Discuss the factors affecting population growth that can result in an exponential growth curve.

The sigmoid model links growth to carrying capacity

A sigmoid growth model can be tested by repeatedly measuring a population grown under controlled conditions, such as yeast or duckweed.

Start replicate cultures with comparable initial populations, keep temperature, nutrients, volume and light conditions controlled, measure population size at regular intervals, calculate means, and plot population size against time.

Look for an initially increasing growth rate, a transition as limiting factors intensify, and a plateau near carrying capacity. Compare replicate data with the ideal S-shaped curve and identify deviations.

Duckweed frond number can be counted daily in replicate containers; nutrient depletion, shading and crowding eventually reduce net growth and produce a plateau.

The sigmoid is a model. A plateau may shift if conditions change, and deviations must not be hidden by forcing a fitted curve through poor data.

Competition occurs when organisms share a limited resource

Intraspecific relationships occur within one population: individuals compete when they require the same limited resource, but may cooperate when joint action raises survival or reproduction.

Relationship within one species Why it occurs Real example
Competition Food, mates, territory, nesting sites or light are limited Male deer compete for access to mates
Cooperation Coordinated action gives a shared fitness benefit Wolves hunt in packs to capture prey that one wolf may not subdue
Cooperation Care increases offspring survival Adult birds feed and defend their chicks

As a plant population becomes denser, individuals of the same species shade one another and compete for light; cooperative animal hunting can instead increase each participant's food access.

Competition need not involve aggression, and cooperation can have costs. An interaction between two different plant species is interspecific and does not demonstrate this objective.

Competition vs. cooperation

Assessment in practice

1–2 marks
How it is assessed

This objective is assessed through structured response, commonly using Discuss / State / Describe.

Command terms

Discuss / State / Describe / Outline / Suggest / Compare / Contrast

What earns marks

Build the answer around this relationship: Competition versus cooperation must be linked to the correct ecological unit, method or species interaction.

Watch for

Describing overlapping niches without explaining that one competitor is displaced or restricted.

Representative question

Question 1

[Maximum number: 2]

Compare and contrast the frequency of monopoly and fighting when there is a change from two trays to one tray of food.

A community contains interacting populations

A community contains interacting populations.

A community is the populations of different species living and interacting in one area. Its composition and structure depend on abiotic conditions and biotic relationships.

list populations; define boundary; identify interaction and environmental filter.

A pond community includes algae, plants, fish, bacteria and invertebrates interacting under the pond’s chemistry and light.

A community is not the same as an ecosystem: an ecosystem also includes abiotic stores and flows.

Community exam focus

Assessment in practice

1 marks
How it is assessed

This objective is assessed through structured response, commonly using Identify / State / Suggest.

Command terms

Identify / State / Suggest / Evaluate / Compare / Contrast / Describe / Explain

What earns marks

Build the answer around this relationship: Community must be linked to the correct ecological unit, method or species interaction.

Watch for

Including abiotic factors in the definition of community instead of reserving them for ecosystem.

Representative question

Question 1

[Maximum number: 3]

Compare and contrast the community structure within and outside the marine protected area.

Interspecific relationships change population outcomes

Interspecific relationships are interactions between different species that change survival, growth or reproduction within a community.

Category Effect Example
Herbivory Herbivore benefits; plant is harmed Caterpillar eats leaf tissue
Predation Predator benefits; prey is killed Owl captures a mouse
Interspecific competition Both lose access to a limited resource Two plant species compete for light
Mutualism Both species benefit Bee gains nectar while pollinating a flower
Parasitism Parasite benefits; host is harmed Tick feeds on a mammal
Pathogenicity Pathogen benefits/reproduces; host is harmed Rust fungus infects a wheat plant

Classify from the mechanism and effects, not from proximity alone. Commensalism is a valid ecological term but is not one of the six categories required for this objective.

Interspecific relationships

Assessment in practice

1–2 marks
How it is assessed

This objective is assessed through essay response, commonly using Identify / Discuss / Describe.

Command terms

Identify / Discuss / Describe / State / Suggest / Predict / Deduce / Evaluate

What earns marks

Interspecific relationships is assessed through predator-prey effects and population regulation, interspecific relationships in communities, capture-mark-release-recapture population estimates, chi-squared testing of species association.

Watch for

Confusing a population with a community or with all organisms in an ecosystem.

Representative question

Question 1

[Maximum number: 3]

Evaluate whether crop yield may be improved through enhancement of pollinator richness.

Mutualism gives both partners a context-dependent benefit

Mutualism is an interspecific relationship in which both species receive a net benefit.

Required mutualism Benefit to first partner Benefit to second partner
Fabaceae root nodules + nitrogen-fixing bacteria Legume receives usable nitrogen compounds Bacteria receive sugars and a protected nodule habitat
Orchidaceae + mycorrhizal fungus Orchid gains mineral nutrients/water and support during germination Fungus receives carbon compounds from the plant in the mutualistic association
Hard coral + zooxanthellae Coral receives photosynthetic carbon compounds and oxygen Algae receive shelter, CO₂ and mineral nutrients

Name the benefit to each organism. Merely living together is not enough to establish mutualism, and the balance of benefit can change with environmental conditions.

Mutualism as interspecific relationship

Assessment in practice

1–2 marks
How it is assessed

This objective is assessed through structured response, commonly using Outline / Suggest / Deduce.

Command terms

Outline / Suggest / Deduce / Distinguish / State / Describe / Identify / Analyse

What earns marks

Build the answer around this relationship: Mutualism as interspecific relationship must be linked to the correct ecological unit, method or species interaction.

Watch for

Confusing a population with a community or with all organisms in an ecosystem.

Representative question

Question 1

[Maximum number: 3]

Analyse the relationship between plants and their pollinators.

Endemic and invasive describe distribution histories

An introduced species can become invasive when it acquires limiting resources more effectively than local endemic or native species and spreads at their expense.

In southern China, the introduced vine Mikania micrantha grows rapidly over local vegetation. Its canopy captures light and space, shading slower-growing native plants and reducing their access to photosynthetic resources.

For a local case, identify introduced species → named resource → acquisition advantage → reduced resource availability or performance of local endemic/native species → spread and community impact.

Compare light interception, cover or growth of local plants in plots with and without dense Mikania; greater vine resource capture provides evidence for its competitive advantage.

Non-native does not automatically mean invasive. Spread and harm must be demonstrated, and resource competition must be separated from other mechanisms such as predation or disease.

Endemic vs. invasive species

Assessment in practice

2–3 marks
How it is assessed

This objective is assessed through essay response, commonly using State / Discuss / Suggest.

Command terms

State / Discuss / Suggest / Identify / Outline / Describe / Explain / Evaluate / Define / Analyse

What earns marks

Build the answer around this relationship: Endemic versus invasive species must be linked to the correct ecological unit, method or species interaction.

Watch for

Naming an alien species without explaining competition, predation, disease or biodiversity impact.

Representative question

Question 1

[Maximum number: 6]

Discuss, giving an example, the possible effects of the introduction of an alien species into an ecosystem.

Competition tests need a manipulated comparison

Interspecific competition is indicated—but not proved—when one species performs better in the absence of another.

Approach What is compared Strength/limit
Laboratory experiment Species alone versus together under controlled conditions Strong control but artificial setting
Field observation with random sampling Abundance or performance where species co-occur versus do not Realistic but confounding variables remain
Field removal manipulation Remove one species from random plots and compare with control plots Stronger causal evidence but disturbance may have side effects

In a barnacle removal study, greater occupation of lower shore by one species after its competitor is removed supports competition as the restriction on its realized distribution.

Experiments manipulate a variable; observations do not. Better performance without a second species is evidence for competition, but alternative environmental differences must still be excluded.

Tests for interspecific competition

Assessment in practice

1–3 marks
How it is assessed

This objective is assessed through structured response, commonly using Outline / Suggest / Explain.

Command terms

Outline / Suggest / Explain / State / Predict

What earns marks

Build the answer around this relationship: Tests for interspecific competition must be linked to the correct ecological unit, method or species interaction.

Watch for

Describing overlapping niches without explaining that one competitor is displaced or restricted.

Representative question

Question 1

[Maximum number: 3]

Explain the results shown in this experiment.

Chi-squared tests compare observed and expected counts

A chi-squared test can test whether presence or absence of species A is associated with presence or absence of species B across several sampling sites.

Build a 2 × 2 table: both present, A only, B only, neither. Null hypothesis: the species' distributions are independent. Calculate each expected count as (row total × column total) ÷ grand total.

χ2=Σ((observedexpected)2÷expected);degreesoffreedom=(rows1)(columns1)=1fora2×2table.χ² = Σ((observed − expected)² ÷ expected); degrees of freedom = (rows − 1)(columns − 1) = 1 for a 2 × 2 table.

Compare calculated χ² with the chosen critical value or p-value. A significant result rejects independence and supports an association between distributions.

Association does not prove interspecific competition: both species may respond to the same abiotic factor, or association may reflect another interaction. Sampling sites must be independent and expected counts suitable for the test.

Chi-squared test

Assessment in practice

1 marks
How it is assessed

This objective is assessed through structured response, commonly using Identify / Outline / Determine.

Command terms

Identify / Outline / Determine / Explain / Calculate / State

What earns marks

Build the answer around this relationship: Chi-squared test must be linked to the correct ecological unit, method or species interaction.

Watch for

Using non-random sampling when the estimate requires representative quadrat positions.

Representative question

Question 1

[Maximum number: 3]

Outline how chi-squared can be used to test for an association between the distributions of the two species.

Predator and prey numbers can oscillate

Predator–prey interactions can regulate both animal populations through density-dependent feedback, often producing time-lagged cycles.

More prey support predator survival and reproduction, so predator numbers rise later. Increased predation then lowers prey numbers; food shortage subsequently lowers predator numbers, allowing prey recovery.

Long-term snowshoe hare and Canada lynx records show repeated abundance cycles in which lynx peaks generally follow hare peaks, consistent with the delayed predator response.

Trace hare increase → more food for lynx → delayed lynx increase → higher hare mortality → hare decline → lynx decline from reduced food.

A lagged correlation supports but does not alone prove a predator-driven cycle. Food supply, disease, climate and sampling methods can also influence both populations.

Predator-prey relationships

Assessment in practice

2 marks
How it is assessed

This objective is assessed through structured response, commonly using Identify / Compare / Describe.

Command terms

Identify / Compare / Describe / Predict / Explain / Contrast / Suggest / Determine

What earns marks

Build the answer around this relationship: Predator-prey relationships must be linked to the correct ecological unit, method or species interaction.

Watch for

Confusing a population with a community or with all organisms in an ecosystem.

Representative question

Question 1

[Maximum number: 3]

Describe the effect of removing trout on frog density in Upper and Lower LeConte Lakes.

Top-down and bottom-up control start at different levels

Top-down control begins with consumers at higher trophic levels; bottom-up control begins with resource supply or primary producers at lower levels.
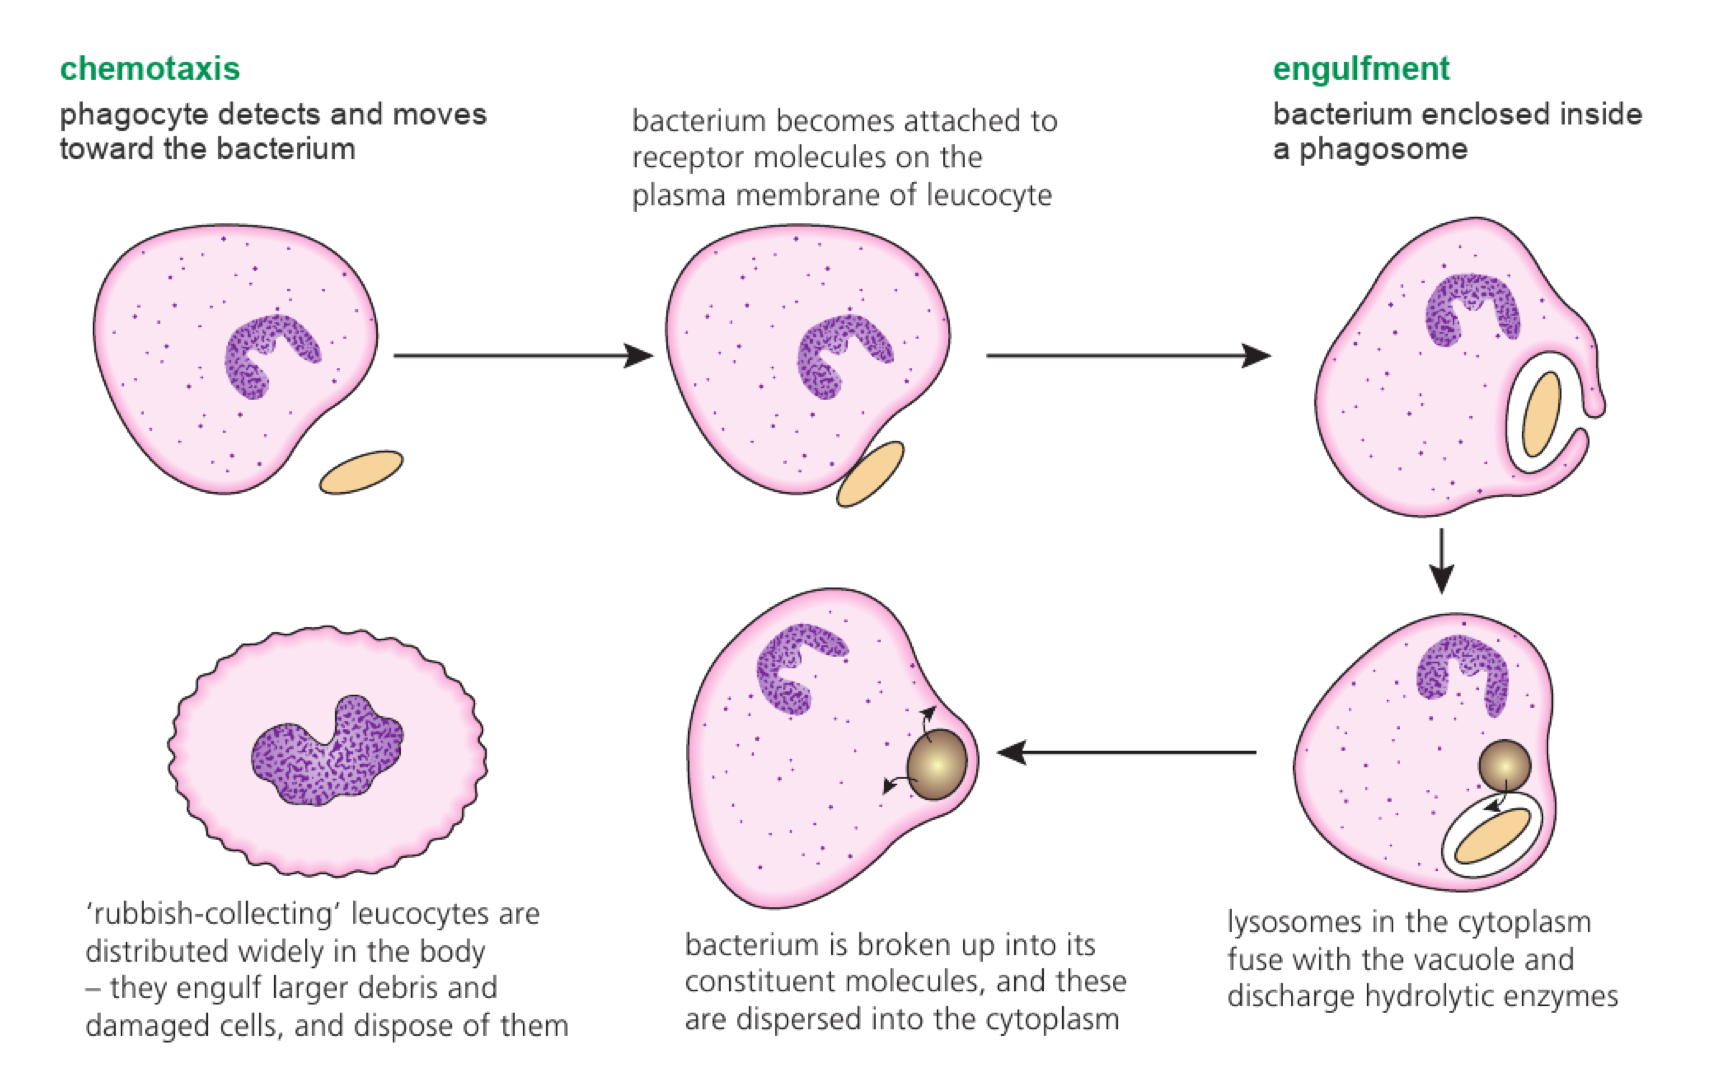
Top-down effects cascade downward when predators alter herbivores and therefore plants. Bottom-up effects propagate upward when nutrients or primary production limit herbivores and predators.

Removing a top predator can release herbivores and reduce plant biomass; low nitrogen can independently limit plant production and therefore all higher levels.
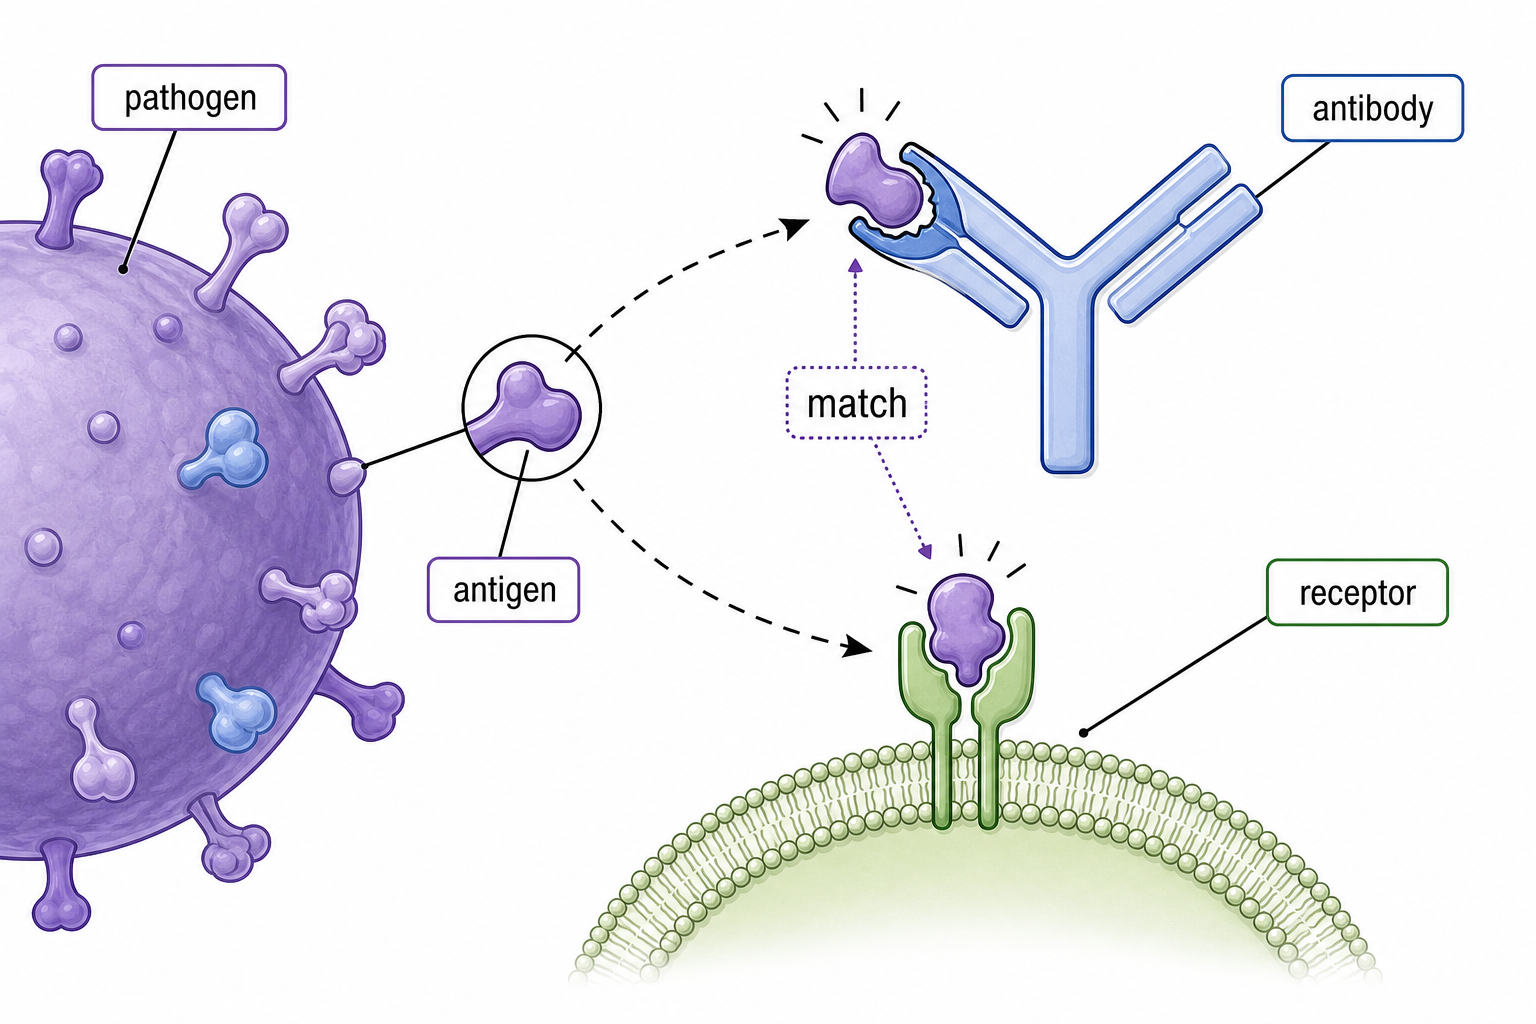
Both pathways can operate in one community, but evidence often shows one is dominant in a particular place and time. Identify the direction and trace effects through trophic levels rather than assuming universal control.

Top-down vs. bottom-up control

Assessment in practice

1–3 marks
How it is assessed

This objective is assessed through structured response, commonly using Explain / Describe / Identify.

Command terms

Explain / Describe / Identify / Outline

What earns marks

Build the answer around this relationship: Top-down versus bottom-up control must be linked to the correct ecological unit, method or species interaction.

Watch for

Confusing a population with a community or with all organisms in an ecosystem.

Representative question

Question 1

[Maximum number: 3]

Explain how nutrients can have a positive or negative bottom-up effect on seagrass.

Allelopathy and antibiotics are chemical interference

Allelopathy and antibiotic secretion both release chemicals into the environment that deter potential competitors.

Process Specific example Producer and target effect
Allelopathy Juglone released by black walnut Inhibits germination or growth of susceptible neighbouring plants
Antibiotic secretion Penicillin from Penicillium fungus Inhibits susceptible bacteria competing in the same environment

The ecological outcome depends on chemical concentration, transport, breakdown and target susceptibility; secretion can improve the producer's access to space or resources.

A laboratory inhibition zone shows chemical activity but does not by itself prove an ecologically important field concentration. Antibiotic secretion here is competition between organisms, not clinical prescribing.

Allelopathy and antibiotics

Assessment in practice

1–3 marks
How it is assessed

This objective is assessed through structured response, commonly using Explain / Identify.

Command terms

Explain / Identify

What earns marks

Build the answer around this relationship: Allelopathy and antibiotics must be linked to the correct ecological unit, method or species interaction.

Watch for

Including abiotic factors in the definition of community instead of reserving them for ecosystem.

Representative question

Question 1

[Maximum number: 3]

Explain how a named plant can reduce competition by allelopathy.

Populations and Communities

  • A population is one species in an area; a community is all interacting populations there.
  • Estimate abundance with unbiased sampling: quadrats for sessile organisms and capture–mark–release–recapture for mobile animals, checking each method’s assumptions.
  • Density-dependent competition, predation, disease and waste create negative feedback around carrying capacity; exponential growth slows into a sigmoid curve as limits strengthen.
  • Classify interspecific relationships by costs and benefits: predation, herbivory, competition, mutualism, parasitism and pathogenicity.
  • Invasive species may escape controls and displace endemic species. Removal experiments can reveal competition and fundamental versus realized niches.
  • Chi-squared tests assess species association from observed and expected quadrat counts.
  • Predator peaks usually lag prey peaks; top-down control begins with consumers, while bottom-up control begins with resources or producers.

Topic C4.2

C4.2 Transfers of energy and matter

Transfers of energy and matter connect sunlight, feeding, trophic levels, decomposers, heat loss and carbon cycling to ecosystem structure, function and sustainability.

76% of analysed papers 106 papers · 154 questions

Objectives in this topic

An ecosystem is open to matter and energy

An ecosystem is an open system because both energy and matter can cross its boundary.

System Energy across boundary Matter across boundary
Open ecosystem Enters, often as light; exits, largely as heat Enters and exits, while also cycling internally
Closed system Can enter and leave Does not enter or leave

A forest receives sunlight, rainfall and atmospheric gases, exports heat and dissolved materials, and cycles carbon and nutrients among organisms, soil and air.

Matter can be recycled because atoms remain available in different compounds; useful energy is not recycled in the same way and ultimately dissipates as heat.

Ecosystems as open systems

Assessment in practice

1–3 marks
How it is assessed

This objective is assessed through structured response, commonly using Describe / Identify / Distinguish.

Command terms

Describe / Identify / Distinguish / Outline / Compare / Contrast / State / Explain

What earns marks

Build the answer around this relationship: Ecosystems as open systems must be linked to the correct source, store, transfer or loss process.

Watch for

Saying energy is recycled instead of flowing through and leaving ecosystems as heat.

Representative question

Question 1

[Maximum number: 6]

Describe the movement of energy and nutrients in an ecosystem.

Sunlight supplies most ecosystem energy

Sunlight is the principal energy source sustaining most ecosystems because photoautotrophs convert light into chemical energy stored in biomass.

Chemical energy then reaches consumers through feeding. This is a useful generalization: it describes a widespread pattern and supports predictions, but it is not an explanation of every ecosystem and must allow known exceptions.

Cave ecosystems can depend on organic matter imported from sunlit areas, while communities below ocean light penetration can depend on sinking detritus or chemoautotrophic production powered by oxidation reactions.

In a grassland, sunlight → producer biomass → herbivore → predator. In a deep-sea vent community, chemical oxidation can supply the primary energy input instead.

Sunlight supplies energy, not carbon atoms. ‘Principal source’ means the dominant global pattern, not a universal rule without exceptions.

Sunlight as principal energy source

Assessment in practice

1–8 marks
How it is assessed

This objective is assessed through structured response, commonly using State / Explain.

Command terms

State / Explain

What earns marks

Build the answer around this relationship: Sunlight as principal energy source must be linked to the correct source, store, transfer or loss process.

Watch for

Skipping the conversion of light energy into chemical energy by producers.

Representative question

Question 1

[Maximum number: 7]

Explain how the energy supply in an ecosystem is dependent on sunlight.

Chemical energy moves through feeding

Chemical energy moves through feeding.

Organic molecules contain chemical potential energy. Feeding transfers that energy between organisms, while respiration releases some for work and dissipates much as heat.

source molecule; consumer; respiration; useful work versus heat.

Carbon compounds pass from plant to caterpillar to bird; at every step some energy supports metabolism and some leaves as heat.

Energy flow is not identical to carbon flow: carbon atoms may remain while usable energy declines.

Chemical energy flow

Assessment in practice

2–4 marks
How it is assessed

This objective is assessed through structured response, commonly using Outline / Explain / Describe.

Command terms

Outline / Explain / Describe / Identify / Distinguish

What earns marks

Build the answer around this relationship: Chemical energy flow must be linked to the correct source, store, transfer or loss process.

Watch for

Skipping the conversion of light energy into chemical energy by producers.

Representative question

Question 1

[Maximum number: 7]

Describe how populations in communities rely on each other for supplies of energy.

Food webs connect many feeding pathways

Food webs connect many feeding pathways.

A food chain shows one route of feeding; a food web joins overlapping routes. The web reveals alternative prey, predators and indirect effects when one population changes.

trace arrow direction; identify trophic position; follow direct and indirect paths.

Removing a predator can increase one prey species and indirectly reduce the plants eaten by that prey.

Arrows show transfer of food/energy from resource to consumer, not who is ‘stronger’.

Food chains and food webs

Assessment in practice

1–4 marks
How it is assessed

This objective is assessed through structured response, commonly using Describe / Identify / Label.

Command terms

Describe / Identify / Label / Draw / Explain / Compare / Contrast / Outline / Evaluate

What earns marks

Build the answer around this relationship: Food chains and food webs must be linked to the correct source, store, transfer or loss process.

Watch for

Saying energy is recycled instead of flowing through and leaving ecosystems as heat.

Representative question

Question 1

[Maximum number: 6]

Describe what is meant by a food chain and a food web.

Decomposers return matter from dead material

Decomposers obtain energy from carbon compounds in organic matter derived from faeces, dead parts and whole dead organisms.

Fungi and bacteria secrete enzymes onto detritus, absorb soluble digestion products and oxidize some carbon compounds in respiration. This transfers chemical energy to decomposer metabolism.

Faeces/dead tissue/dead organism → extracellular digestion → soluble carbon compounds absorbed → decomposer respiration and biomass → inorganic nutrients released.

A fungus digests dead leaf tissue externally, absorbs sugars and other products, uses some for respiration and growth, and releases mineral nutrients into soil.

Decomposers transform both matter and energy, but matter can return to nutrient cycles while respiratory energy ultimately leaves as heat.

Supply to decomposers

Assessment in practice

1–2 marks
How it is assessed

This objective is assessed through structured response, commonly using State / Explain / Describe.

Command terms

State / Explain / Describe / Outline / Suggest

What earns marks

Build the answer around this relationship: Supply to decomposers must be linked to the correct source, store, transfer or loss process.

Watch for

Reversing food-web arrows instead of showing energy transfer direction.

Representative question

Question 1

[Maximum number: 2]

Detritus accumulates on coral reefs damaged by ocean acidification.
Suggest two possible impacts of an increase in detritus on the organisms in this food web.

Autotrophs build organic matter from inorganic carbon

Autotrophs use an external energy source to synthesize carbon compounds from simple inorganic substances.

External energy is required both to fix inorganic carbon such as CO₂ into organic intermediates and to drive anabolic reactions that assemble carbohydrates, lipids, proteins and nucleic acids.

External light or chemical energy → carbon fixation → small organic compounds → energy-requiring anabolic synthesis → autotroph biomass.

A plant uses light energy to fix CO₂ into carbon compounds and then combines carbon skeletons with mineral nutrients to build macromolecules for new tissue.

Autotroph refers to carbon-compound synthesis, not independence from external energy, water or mineral elements.

Autotrophs as self-feeders

Assessment in practice

1–2 marks
How it is assessed

This objective is assessed through structured response, commonly using Identify / Distinguish / State.

Command terms

Identify / Distinguish / State / Define

What earns marks

Build the answer around this relationship: Autotrophs as self-feeders must be linked to the correct source, store, transfer or loss process.

Watch for

Confusing detritivores that ingest material with saprotrophs that digest externally.

Representative question

Question 1

[Maximum number: 1]

Define the term autotroph.

Ecosystems can use light or chemical energy

Photoautotrophs use light as their external energy source; chemoautotrophs use energy released by oxidation reactions.

Type Energy source Required example Carbon source
Photoautotroph Absorbed light Green plant or alga Inorganic carbon such as CO₂
Chemoautotroph Oxidation of inorganic substances Iron-oxidizing bacterium Inorganic carbon such as CO₂

Oxidation transfers electrons and releases energy that chemoautotrophs can couple to ATP production and carbon fixation even where light is unavailable.

Chemosynthesis is not photosynthesis without light: the external energy source is an oxidation reaction. Both groups are autotrophs because they synthesize carbon compounds from inorganic carbon.

Energy sources

Assessment in practice

1 marks
How it is assessed

This objective is assessed through multiple choice, commonly using Identify.

Command terms

Identify

What earns marks

Build the answer around this relationship: Energy sources must be linked to the correct source, store, transfer or loss process.

Watch for

Reversing food-web arrows instead of showing energy transfer direction.

Representative question

Question 1

[Maximum number: 1]

Which organisms use oxidation of simple inorganic substances as an energy source?

A

Photoautotrophs

B

Heterotrophs

C

Chemoautotrophs

D

Saprotrophs

Heterotrophs obtain organic carbon from other organisms

Heterotrophs obtain carbon compounds from other organisms and use them to synthesize the carbon compounds they require.

Complex molecules such as proteins and nucleic acids are too large to assimilate directly. They are digested internally in animals or externally by organisms such as fungi, producing smaller molecules that can be absorbed.

Other organism/detritus → internal or external digestion → small molecules absorbed → assimilation into new, organism-specific proteins, nucleic acids and other carbon compounds.

An animal digests dietary protein to amino acids and then assembles those amino acids into its own enzymes; a fungus performs digestion outside its body before absorption.

Assimilation is not simply absorption: it is incorporation and reconstruction into the organism's own compounds. Heterotrophs still respire and recycle nutrients.

Heterotrophs exam focus

Assessment in practice

1 marks
How it is assessed

This objective is assessed through essay response, commonly using Identify / Describe / State.

Command terms

Identify / Describe / State / Compare / Contrast

What earns marks

Build the answer around this relationship: Heterotrophs must be linked to the correct source, store, transfer or loss process.

Watch for

Reversing food-web arrows instead of showing energy transfer direction.

Representative question

Question 1

[Maximum number: 5]

Compare and contrast how different types of heterotrophs obtain the energy that they need to produce ATP.

Respiration releases usable energy from organic molecules

Both autotrophs and heterotrophs release energy by oxidizing carbon compounds in cell respiration.

Electrons and hydrogen are transferred from respiratory substrates through enzyme-controlled pathways; part of the released chemical energy is captured in ATP and the rest becomes heat.

Autotroph: makes carbon compounds, then can respire them. Heterotroph: obtains carbon compounds from other organisms, then can respire them. Both use ATP for cellular work.

A plant leaf respires glucose that the plant synthesized, while an animal respires carbon compounds derived from food; in each, oxidation supports ATP production.

Autotrophs do not only photosynthesize—they also respire. Respiration is cellular oxidation, not gas movement in breathing; photoheterotroph details are not required.

Energy release

Assessment in practice

1 marks
How it is assessed

This objective is assessed through structured response, commonly using Describe / Identify / State.

Command terms

Describe / Identify / State

What earns marks

Build the answer around this relationship: Energy release must be linked to the correct source, store, transfer or loss process.

Watch for

Giving a generic ecosystem answer without the specific transfer or process for energy release.

Representative question

Question 1

[Maximum number: 1]

State one process that results in the loss of carbon dioxide from a marine organism such as a crustacean or a jellyfish.

Trophic levels describe feeding position

A trophic level classifies an organism by its feeding position in a particular food chain.

Trophic level Role Example in grass → grasshopper → frog → snake
Producer Synthesizes organic carbon from inorganic sources Grass
Primary consumer Feeds on producer Grasshopper
Secondary consumer Feeds on primary consumer Frog
Tertiary consumer Feeds on secondary consumer Snake

An omnivorous bird may be a primary consumer when eating seeds and a secondary consumer when eating herbivorous insects, so trophic level depends on the food chain.

Trophic level is not body size, intelligence or a permanent label for a species with a varied diet.

Trophic levels

Assessment in practice

1 marks
How it is assessed

This objective is assessed through structured response, commonly using Identify / Explain / Discuss.

Command terms

Identify / Explain / Discuss / Deduce / Describe / State / Distinguish / Suggest

What earns marks

Build the answer around this relationship: Trophic levels must be linked to the correct source, store, transfer or loss process.

Watch for

Reversing food-web arrows instead of showing energy transfer direction.

Representative question

Question 1

[Maximum number: 4]

Explain, using an example of a food chain, how trophic levels can be deduced.

Energy pyramids show usable energy decreases upward

An energy pyramid uses measured research data to show energy available at successive trophic levels per unit area per unit time.

Choose one specific ecosystem dataset; verify that all values use compatible energy, area and time units; order producer to higher consumers; draw bars with widths proportional to the reported values; label every value and unit.

For each transfer, calculate loss as energy at lower level minus energy at next level, and transfer efficiency as (next-level energy ÷ lower-level energy) × 100%. Use the dataset's real values rather than assuming a fixed percentage.

A correctly constructed pyramid lets the reader compare the measured producer energy with each consumer level and see both absolute loss and proportional transfer between adjacent levels.
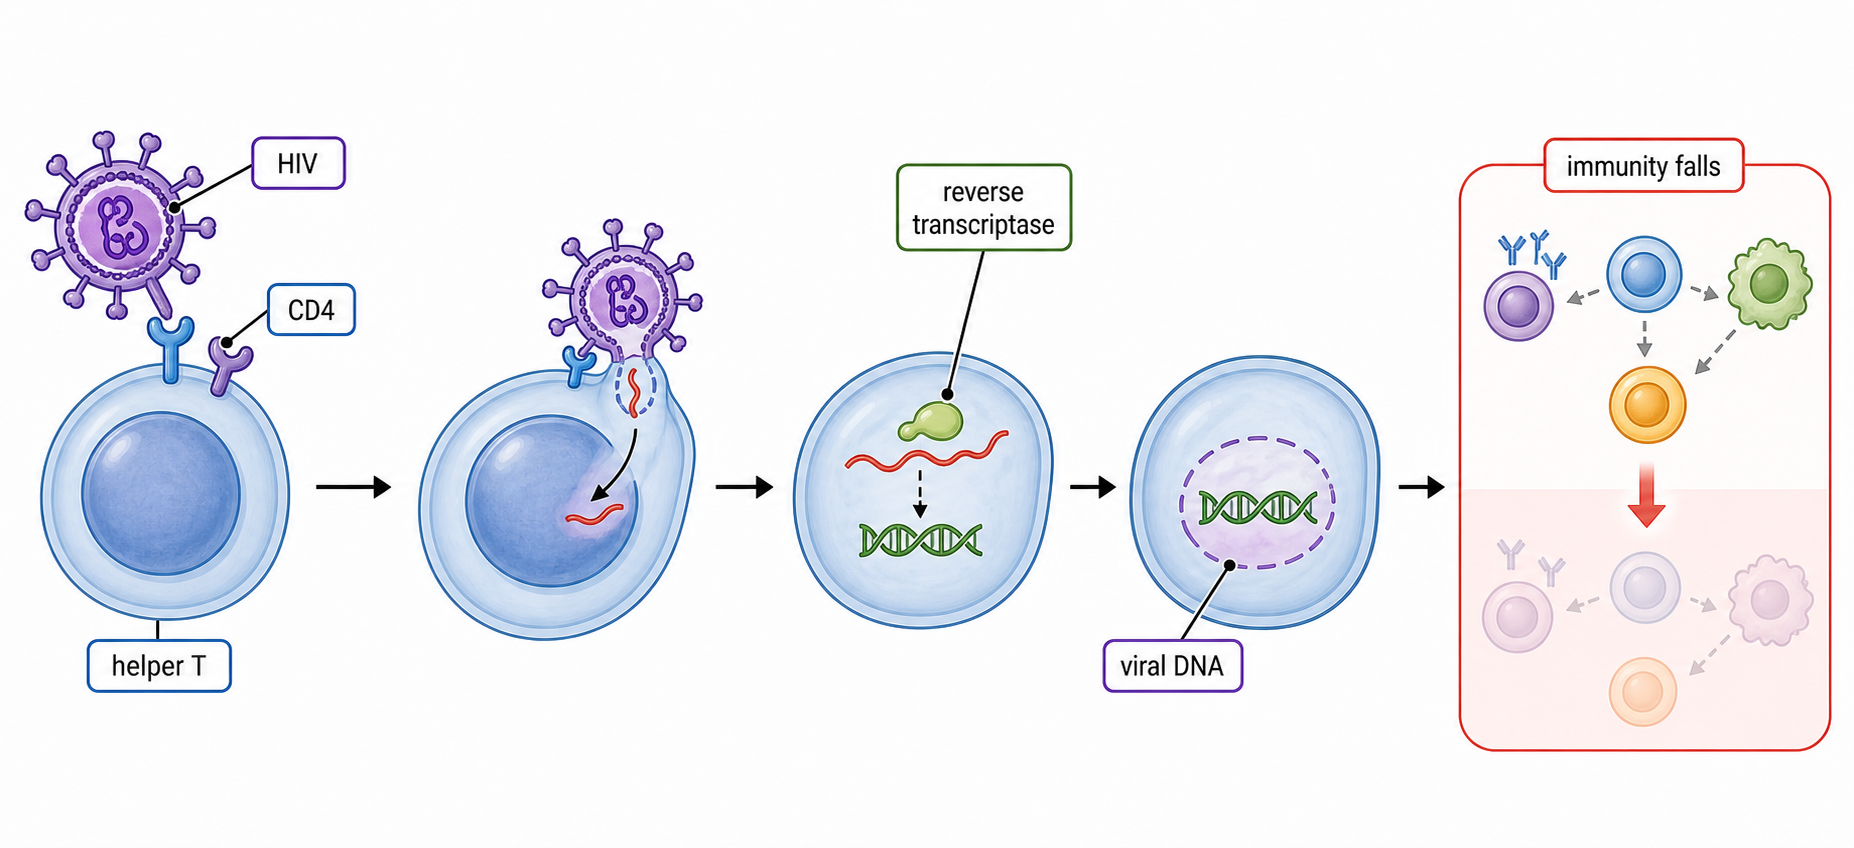
An energy pyramid is not a pyramid of numbers or standing biomass. Do not invent missing values or mix units or measurement intervals from different ecosystems.
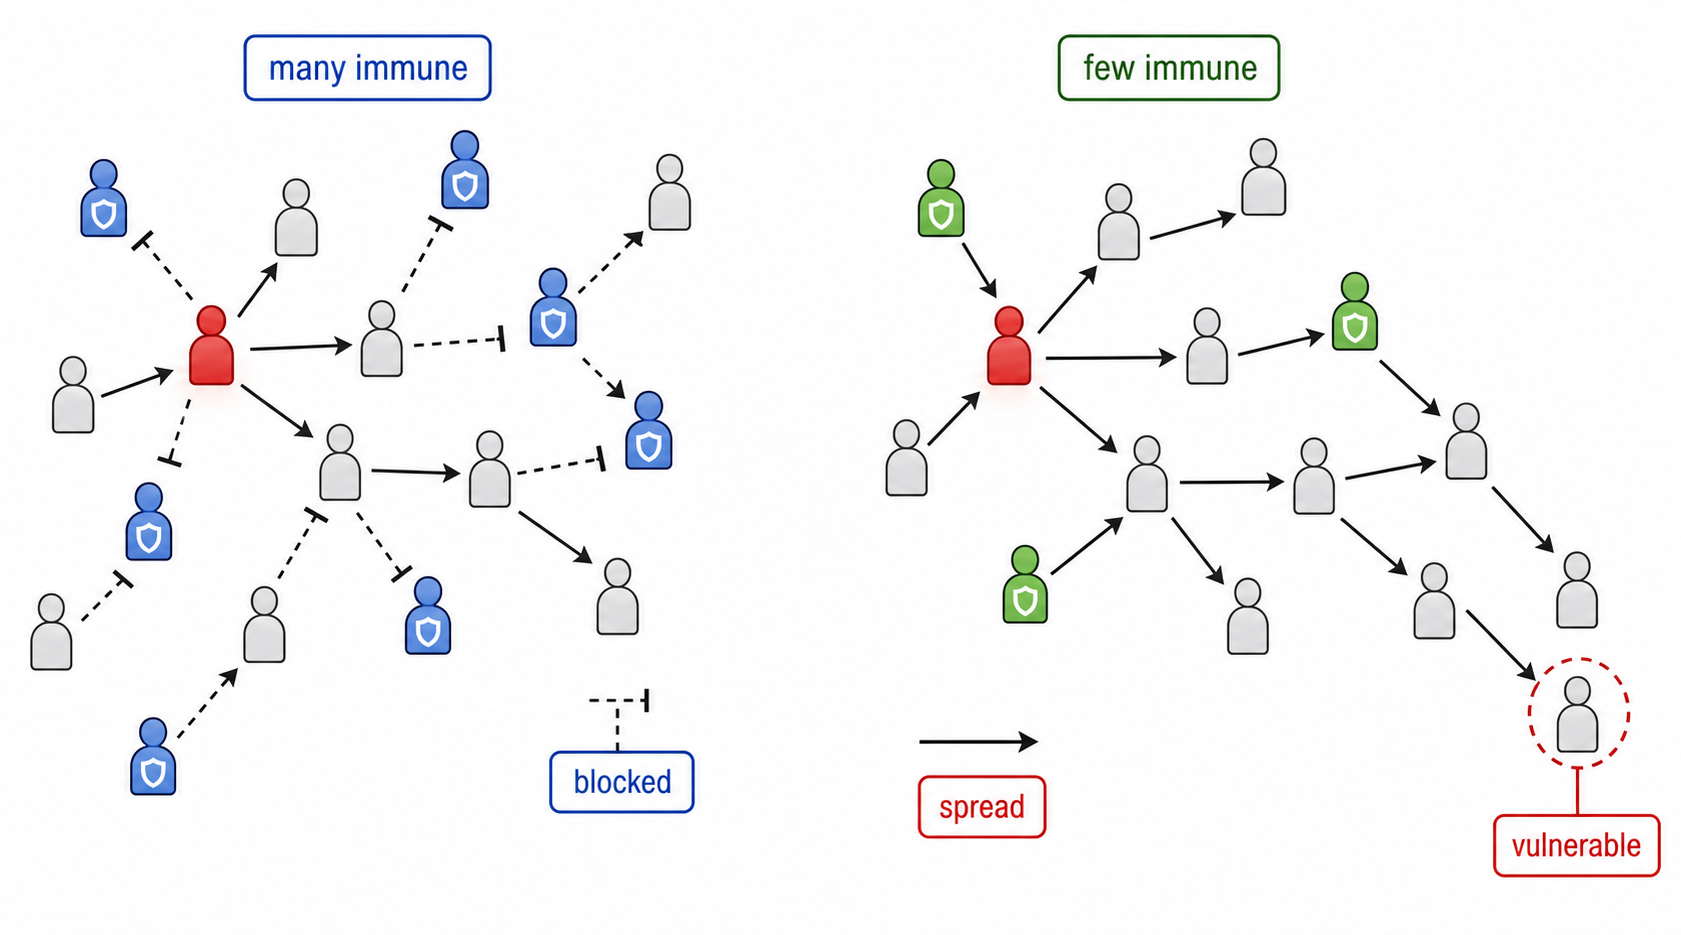
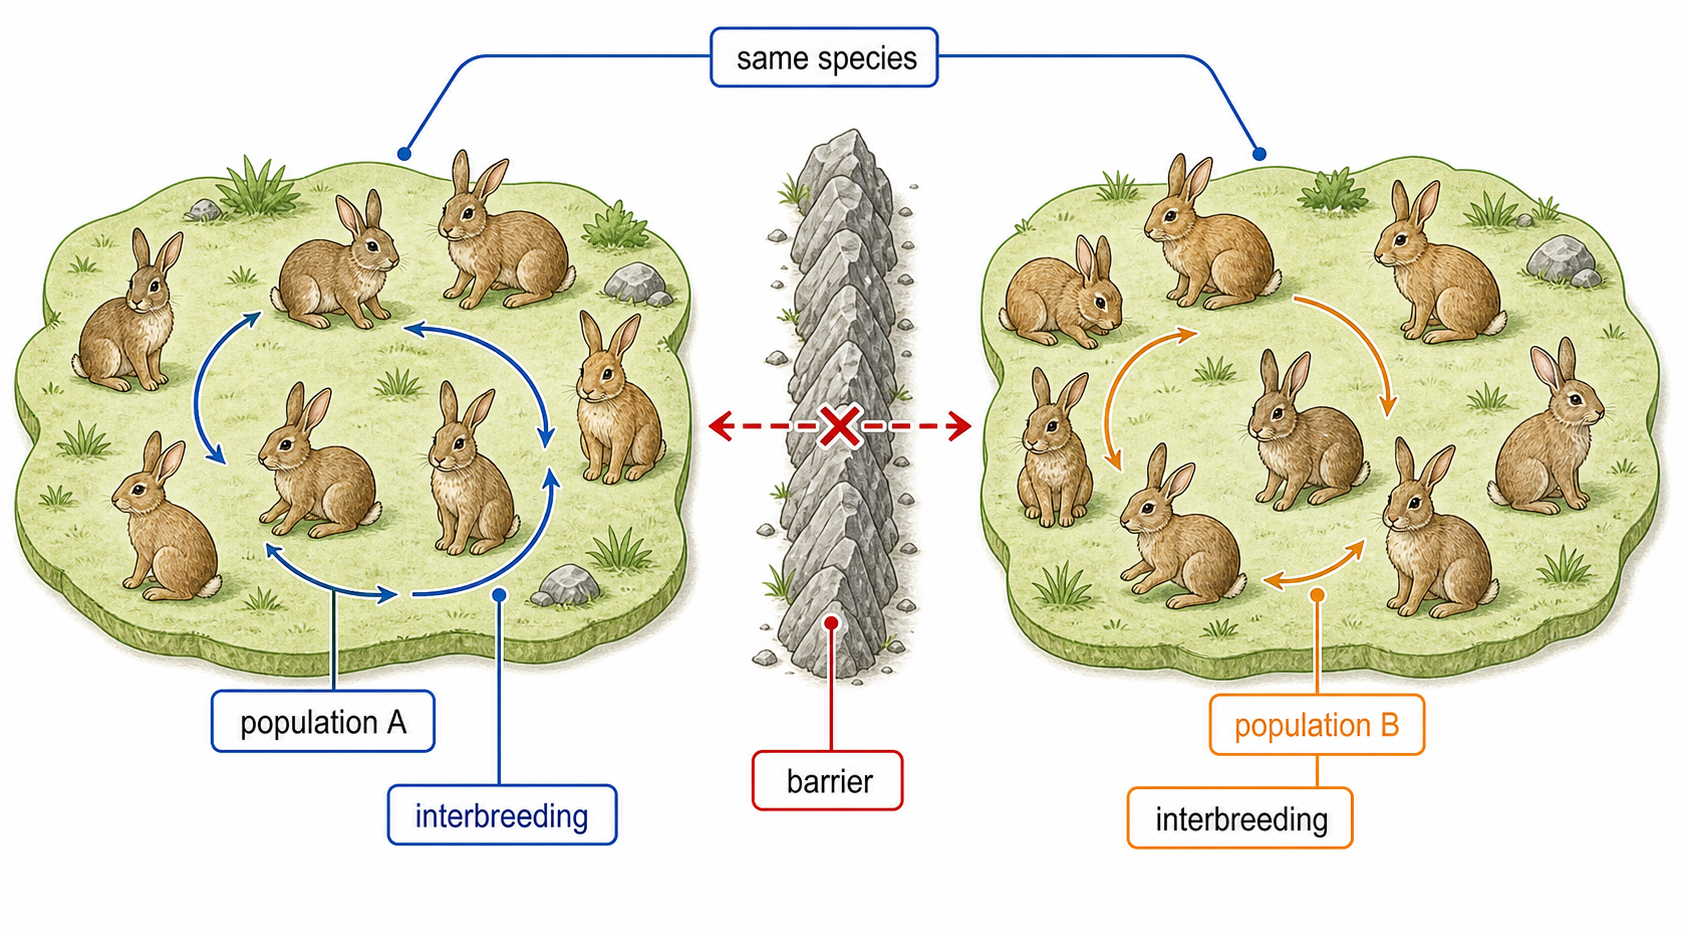
Energy pyramids

Assessment in practice

1–3 marks
How it is assessed

This objective is assessed through structured response, commonly using Identify / Label / Explain.

Command terms

Identify / Label / Explain / Describe / Outline / State / Draw / Discuss / Sketch

What earns marks

Build the answer around this relationship: Energy pyramids must be linked to the correct source, store, transfer or loss process.

Watch for

Reversing food-web arrows instead of showing energy transfer direction.

Representative question

Question 1

[Maximum number: 6]

Ecologists sometimes display data from an ecosystem using a diagram called a pyramid of energy. Describe what is shown in pyramids of energy.

Energy transfer between trophic levels is incomplete

Energy availability decreases at successive trophic levels because only part of one level's chemical energy becomes biomass eaten and assimilated by the next.

Losses include uneaten material, indigestible material egested as faeces, carbon compounds used in respiration, and heat from metabolism. Movement, maintenance and other work reduce energy stored as new biomass.

Decomposers and detritus feeders are not usually drawn as one step in a food chain, but they receive uneaten, egested and dead organic matter and transform its chemical energy through feeding and respiration.

Plant roots left uneaten and herbivore faeces can supply detrital pathways, while only new herbivore biomass remains available to a predator.

Transfer efficiency is not a universal ten-percent rule. Species, tissues, temperature and ecological conditions alter the size of each loss.

Energy reductions

Assessment in practice

1–2 marks
How it is assessed

This objective is assessed through structured response, commonly using Identify / Explain / Outline.

Command terms

Identify / Explain / Outline / Calculate / State / Deduce / Distinguish / Suggest / Discuss

What earns marks

Build the answer around this relationship: Energy reductions must be linked to the correct source, store, transfer or loss process.

Watch for

Reversing food-web arrows instead of showing energy transfer direction.

Representative question

Question 1

[Maximum number: 3]

The efficiency of energy transfer along the various food chains in a food web varies. Suggest reasons for the differences.

Heat loss limits energy available to the next level

Both autotrophs and heterotrophs release heat when chemical energy is converted during cell respiration and when ATP is used for cell work.

Energy transfers are not 100% efficient. Some substrate energy becomes heat while ATP is produced, and further heat is released when ATP hydrolysis drives synthesis, transport or movement.

Carbon-compound oxidation → ATP plus heat; ATP use → cell work plus heat; heat dissipates to the environment and is unavailable as chemical energy to the next trophic level.

A plant and a mammal both respire and lose heat during ATP production; both also release heat as ATP powers active transport or biosynthesis.

Heat loss is energy transfer, not loss of carbon mass. Ecosystems require continuing external energy input because dissipated heat is not recycled into chemical energy by organisms.

Heat loss

Assessment in practice

1 marks
How it is assessed

This objective is assessed through multiple choice, commonly using Identify.

Command terms

Identify

What earns marks

Build the answer around this relationship: Heat loss must be linked to the correct source, store, transfer or loss process.

Watch for

Reversing food-web arrows instead of showing energy transfer direction.

Representative question

Question 1

[Maximum number: 1]

Plankton are major producers in marine ecosystems. Only a small proportion of the energy harvested by plankton is passed to the primary consumers. Which process in phytoplankton results in the largest loss of energy that could otherwise be utilized by consumers?

A

Reproduction

B

Homeostasis

C

Excretion

D

Respiration

Few trophic levels can be supported when transfer is low

Repeated energy losses restrict the number of trophic levels that an ecosystem can support.

Each higher level receives less total chemical energy, so less total biomass can be maintained. Successive levels therefore tend to contain fewer organisms or organisms with smaller combined body size.

Lower-level energy → incomplete transfer → smaller upper-level energy budget → lower total biomass → fewer/smaller organisms → an additional trophic level eventually becomes unsustainable.

A food web with low primary production or large transfer losses may support herbivores but too little predator biomass to support another persistent consumer level.

Total biomass decreases upward, but the energy content per unit mass is not assumed to decrease. The limit comes from less total energy/biomass, not poorer-quality joules.

Restrictions on trophic levels

Assessment in practice

1 marks
How it is assessed

This objective is assessed through structured response, commonly using Identify / Outline.

Command terms

Identify / Outline

What earns marks

Build the answer around this relationship: Restrictions on trophic levels must be linked to the correct source, store, transfer or loss process.

Watch for

Reversing food-web arrows instead of showing energy transfer direction.

Representative question

Question 1

[Maximum number: 1]

Outline why the number of trophic levels is limited in a food chain.

Primary production is new producer biomass

Primary production is the accumulation of carbon compounds in autotroph biomass through growth and reproduction.

Report it as mass of carbon per unit area per unit time, commonly g C m⁻² yr⁻¹. A rate requires a defined area and interval rather than only a standing biomass measurement.

Biomes differ in capacity to accumulate biomass because light, temperature, water, nutrients and growing-season length constrain autotroph growth.

Compare ecosystem primary-production values only after checking that carbon mass, area and time units match; the larger rate represents faster producer carbon accumulation.

Primary production is producer biomass accumulation, not total biomass already present. Biomass also accumulates when heterotrophs grow or reproduce, but that is secondary production.

Primary production

Assessment in practice

1–3 marks
How it is assessed

This objective is assessed through structured response, commonly using State / Identify / Compare.

Command terms

State / Identify / Compare / Calculate / Distinguish / Annotate / Describe / Explain / Evaluate

What earns marks

Build the answer around this relationship: Primary production must be linked to the correct source, store, transfer or loss process.

Watch for

Confusing gross production with net production after respiration losses.

Representative question

Question 1

[Maximum number: 3]

In each forest, there are two or three trial plots per CO2 treatment. The bar chart shows the allocation of carbon from net primary production to different parts of the trees in these trial plots.

Evaluate the evidence from the bar chart that increases in carbon dioxide cause increases in carbon storage in young, developing forests.

Secondary production is consumer biomass formation

Secondary production is the accumulation of carbon compounds in heterotroph biomass through growth and reproduction.

Heterotrophs obtain organic carbon by feeding, but not all intake becomes biomass. Some is not assimilated, and respiration converts absorbed carbon compounds to carbon dioxide and water while releasing energy.

Food carbon → ingestion/digestion → assimilation → respiration losses as CO₂ and water + retained carbon in growth/reproduction. Retained carbon is secondary production.

A growing fish retains part of assimilated food as new tissue, while respiring another part; only the retained new tissue contributes to secondary production.

Secondary production is lower than primary production at ecosystem scale because carbon is lost from biomass at each heterotrophic transfer, especially through respiration.

Secondary production

Assessment in practice

1 marks
How it is assessed

This objective is assessed through structured response, commonly using Calculate.

Command terms

Calculate

What earns marks

Build the answer around this relationship: Secondary production must be linked to the correct source, store, transfer or loss process.

Watch for

Reversing food-web arrows instead of showing energy transfer direction.

Representative question

Question 1

[Maximum number: 1]

Calculate how much food would be required to produce 20 kg of boar meat.

kg

Carbon-cycle diagrams track stores and transfers

Carbon-cycle diagrams track stores and transfers.

A carbon cycle represents carbon stores such as atmosphere, biomass, soil and ocean, and transfers such as photosynthesis, respiration, decomposition and combustion.

label store versus flow; direction; rate or stock; time interval.

A forest store can gain carbon through growth while releasing carbon through respiration and decomposition at the same time.

Arrows are transfers, not extra carbon; a diagram should not be read as one-way flow.

Carbon cycle diagrams

Assessment in practice

1–5 marks
How it is assessed

This objective is assessed through experimental design, commonly using Draw / Identify / Explain.

Command terms

Draw / Identify / Explain / Label / Discuss / Outline / Describe

What earns marks

Build the answer around this relationship: Carbon cycle diagrams must be linked to the correct source, store, transfer or loss process.

Watch for

Reversing food-web arrows instead of showing energy transfer direction.

Representative question

Question 1

[Maximum number: 9]

Living organisms at every trophic level are part of the carbon cycle. Draw a labelled diagram of the carbon cycle to show the processes involved.

A carbon sink gains carbon over a chosen interval

An ecosystem is a carbon sink when photosynthesis removes more CO₂ than respiration releases, and a carbon source when respiration releases more CO₂ than photosynthesis removes.

Classification depends on the net balance across a stated ecosystem boundary and time interval, not on whether both fluxes occur—both photosynthesis and respiration normally continue.

Photosynthesis > respiration → net CO₂ uptake → sink. Respiration > photosynthesis → net CO₂ release → source. Equal fluxes → no net exchange from these two processes.

A growing forest can be a sink while carbon accumulation exceeds respiratory release; after disturbance, high respiration and decomposition can make the same area a source.

Sink/source status is not permanent and changes with season, disturbance, ecosystem age, boundary and measurement interval.

Carbon sinks and sources

Assessment in practice

1–2 marks
How it is assessed

This objective is assessed through structured response, commonly using Identify / Explain / Describe.

Command terms

Identify / Explain / Describe

What earns marks

Build the answer around this relationship: Carbon sinks and sources must be linked to the correct source, store, transfer or loss process.

Watch for

Reversing photosynthesis and respiration arrows in carbon-cycle diagrams.

Representative question

Question 1

[Maximum number: 2]

The graph shows long-term fluctuations in atmospheric CO2\mathrm{CO}_{2} concentration of about 80 ppm . The decreases in CO2\mathrm{CO}_{2} concentration are probably due to oceans acting as a sink by holding large quantities of dissolved CO2\mathrm{CO}_{2}.

Identify two other examples of natural sinks that can remove carbon from the carbon cycle and reduce atmospheric CO2\mathrm{CO}_{2} concentration.

Combustion transfers stored carbon to the atmosphere

Combustion of biomass, peat, coal, oil and natural gas oxidizes stored carbon and releases carbon dioxide to the atmosphere.

These stores formed at different times: biomass stores recent carbon, peat accumulates over longer periods, and coal, oil and natural gas contain ancient geological carbon. Burning transfers that stored carbon rapidly to atmospheric CO₂.

Lightning can ignite biomass naturally, but human burning of biomass and fossil fuels has greatly increased combustion rates and the flux of stored carbon to the atmosphere.

Complete combustion of methane in natural gas forms CO₂ and water; burning coal, oil, peat or wood likewise transfers their carbon to atmospheric products.

Combustion moves existing carbon—it does not create carbon atoms. Incomplete combustion can also form carbon monoxide or soot, but CO₂ release is the required main flux.

CO₂ release during combustion

Assessment in practice

1 marks
How it is assessed

This objective is assessed through multiple choice, commonly using Calculate / Compare / Contrast.

Command terms

Calculate / Compare / Contrast / Identify / State

What earns marks

Build the answer around this relationship: CO₂ release during combustion must be linked to the correct source, store, transfer or loss process.

Watch for

Reversing photosynthesis and respiration arrows in carbon-cycle diagrams.

Representative question

Question 1

[Maximum number: 1]

The graph shows how the worldwide use of fossil fuels has increased from 1800 to 2019.

How has the increased combustion of fossil fuels contributed significantly to global warming?

A

The heat released raises the temperature of the air.

B

Combustion causes ozone depletion, which enhances the greenhouse effect.

C

Carbon dioxide produced by combustion prevents radiation from the Sun reaching Earth.

D

The products of combustion absorb long wave radiation.

The Keeling Curve combines trend and seasonality

The Keeling Curve shows both a long-term rise in atmospheric CO₂ and repeated annual fluctuations.

Seasonal photosynthesis and respiration, especially across Northern Hemisphere land ecosystems, create the annual oscillation: growing-season uptake lowers CO₂, while reduced photosynthesis and continuing respiration raise it later.

Over many years, CO₂ peaks and troughs both shift upward because combustion adds carbon faster than global sinks remove the additional amount.

When reading the curve, compare equivalent points in successive years to identify the long-term trend; do not mistake one seasonal decline for a reversal of the multi-year rise.

Photosynthesis, respiration and combustion explain different components of the pattern. Axis units and time scale must be checked before interpreting magnitude or rate.

Keeling Curve analysis

Assessment in practice

1 marks
How it is assessed

This objective is assessed through multiple choice, commonly using Identify.

Command terms

Identify

What earns marks

Build the answer around this relationship: Keeling Curve analysis must be linked to the correct source, store, transfer or loss process.

Watch for

Reversing photosynthesis and respiration arrows in carbon-cycle diagrams.

Representative question

Question 1

[Maximum number: 1]

The graph shows data collected at Mauna Loa, USA, for monthly mean carbon dioxide concentration.

What causes the decreases in monthly mean carbon dioxide concentration each year?

A

Combustion increases.

B

Respiration increases.

C

Decomposition increases.

D

Photosynthesis increases.

Respiration and photosynthesis connect carbon flows

Photosynthesis and aerobic respiration are interdependent through the atmosphere: photosynthesis supplies oxygen, while respiration supplies carbon dioxide.

Photosynthetic organisms release atmospheric O₂ when water is split and use atmospheric CO₂ to build carbon compounds. Aerobic organisms require O₂ as the terminal electron acceptor and release CO₂ when carbon compounds are oxidized.

Photosynthesis: CO₂ consumed, O₂ released. Aerobic respiration: O₂ consumed, CO₂ released. The annual fluxes are huge, making this a major interaction between autotrophs and heterotrophs.

A plant contributes O₂ used by animal aerobic respiration; the animal's respiratory CO₂ can later be fixed by photosynthetic organisms.

The two processes are complementary at ecosystem scale but are not exact reverse reaction pathways, and plants themselves also carry out aerobic respiration.

Chemical elements cycle even when energy does not

Every chemical element required by living organisms is recycled through ecosystems; carbon is only one example.

Atoms move between organisms and abiotic stores through uptake, feeding, excretion and death. Decomposers digest dead organic matter and wastes, returning elements in inorganic forms that producers can use again.

Organic matter → decomposer action → inorganic compounds in soil, water or air → producer uptake → food-web transfer → waste/death → decomposition.

Carbon, nitrogen, phosphorus and other required elements can all pass through biomass and return to abiotic stores; the detailed nitrogen or other nutrient cycles are not required here.

Recycling does not mean immediate or unlimited availability. Elements may be lost across ecosystem boundaries or remain in slow stores, while energy follows a one-way dissipative flow.

Recycling of all chemical elements

Assessment in practice

2–7 marks
How it is assessed

This objective is assessed through structured response, commonly using Identify / Describe / Outline.

Command terms

Identify / Describe / Outline / Explain / Suggest

What earns marks

Build the answer around this relationship: Recycling of all chemical elements must be linked to the correct source, store, transfer or loss process.

Watch for

Confusing detritivores that ingest material with saprotrophs that digest externally.

Representative question

Question 1

[Maximum number: 7]

Explain how carbon is recycled in a terrestrial ecosystem.

Energy and Matter

  • Ecosystems are open systems: energy flows through them and leaves as heat, while matter is recycled and may enter or leave.
  • Photoautotrophs capture light; chemoautotrophs oxidize inorganic substances. Both build biomass from inorganic carbon. Heterotrophs obtain organic carbon from other organisms.
  • Food-web arrows show energy and biomass transfer. Energy decreases between trophic levels through respiration, heat, egestion, excretion and uneaten material, limiting chain length.
  • Gross primary production minus producer respiration gives net primary production; secondary production is heterotroph biomass gain.
  • Decomposers obtain energy from detritus and return inorganic nutrients to producers.
  • Carbon-cycle diagrams distinguish stores and fluxes. Photosynthesis removes CO2; respiration, decomposition and combustion release it.
  • A sink absorbs more carbon than it releases; a source does the reverse. The Keeling Curve shows a long-term atmospheric CO2 rise with seasonal oscillation.