C1.3 Photosynthesis
Photosynthesis converts light energy into chemical energy by using pigments, thylakoid reactions and Calvin-cycle carbon fixation to build organic compounds from carbon dioxide.
- Syllabus
- First assessment 2025
- Topic
- C1.3
- Level
- SL
Photosynthesis converts light energy into chemical energy by using pigments, thylakoid reactions and Calvin-cycle carbon fixation to build organic compounds from carbon dioxide.
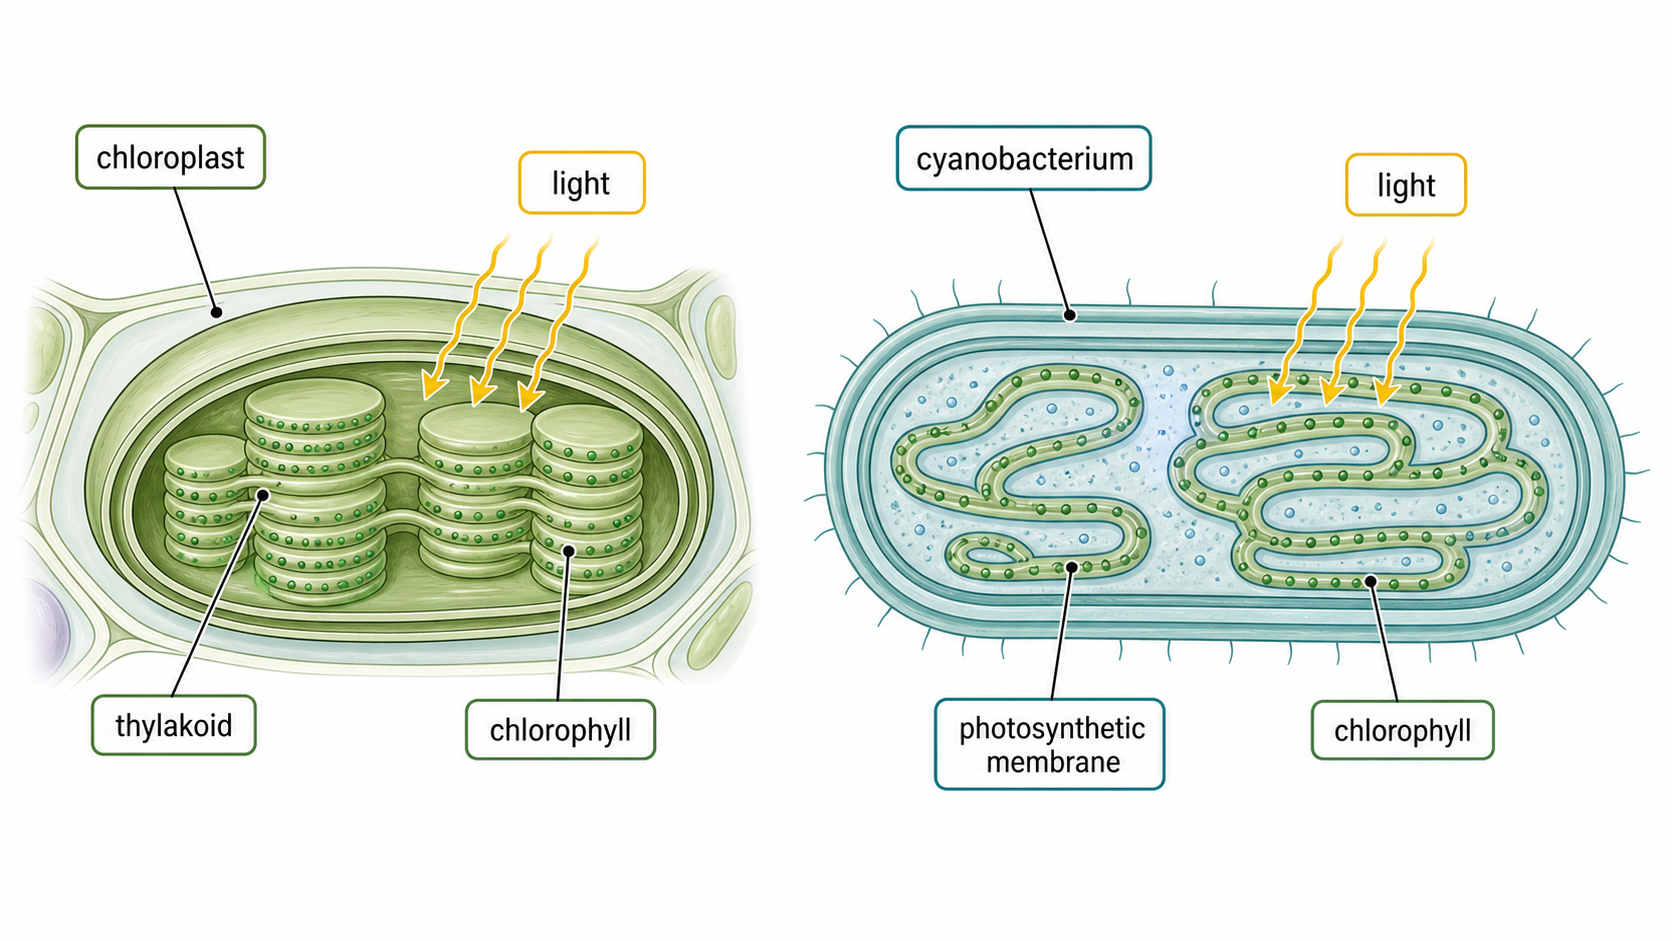
Photosynthesis captures light energy and stores it as chemical energy in organic molecules.
Pigments absorb photons and excite electrons; electron transfer creates ATP and reduced NADP, which then drive carbon fixation. The process depends on light, pigments, membranes, water, carbon dioxide and suitable conditions.
Trace the energy conversion:
A leaf exposed to light can use ATP and reduced NADP from the thylakoid reactions to build carbohydrate in the stroma.
Light provides energy but is not itself converted directly into glucose molecules.
This objective is assessed through structured response, commonly using Identify / State / Outline.
Identify / State / Outline / Describe / Explain / Distinguish
Build the answer around this relationship: Chlorophyll and other pigments absorb light energy inside chloroplasts.
Representative question
Explain the processes by which light energy is converted into chemical energy.
a. plants/producers/autotrophs convert light to chemical energy by photosynthesis
b. chlorophyll/photosynthetic pigments absorb light
c. electrons are excited/raised to higher energy level
d. excited electrons pass along chain of electron carriers
e. energy from electrons used to pump protons across thylakoid membrane/into thylakoid space
f. chemiosmosis/proton gradient used to make ATP
g. ATP synthase generates ATP
h. pigments arranged in photosystems
i. electrons from Photosystem II flow via the electron chain to Photosystem I
j. electrons from Photosystem I are used to reduce NADP
k. ATP and reduced NADP used in the light independent reactions/Calvin cycle
I. carbohydrate/glucose/carbon compounds produced containing energy

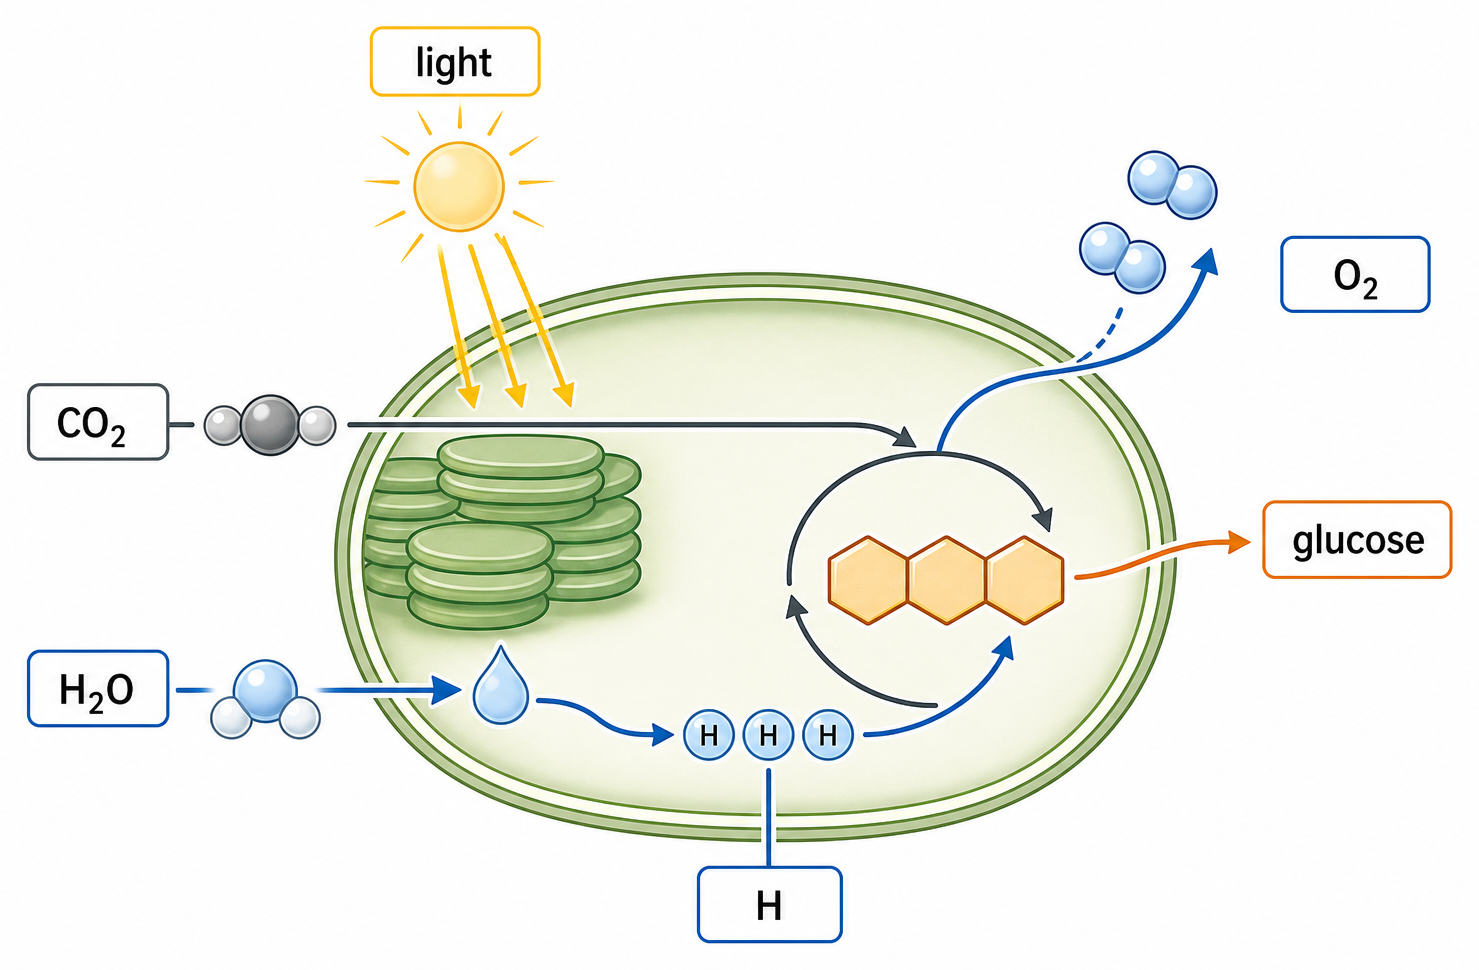
The overall photosynthesis equation shows carbon dioxide and water converted to carbohydrate using light energy: 6CO₂ + 6H₂O → C₆H₁₂O₆ + 6O₂. Carbon dioxide supplies the carbon skeleton and is reduced using hydrogen derived from water. Oxygen is released when water is split by photolysis in the light-dependent reactions, not directly from CO₂. Glucose represents a carbohydrate product; the products can be used to make starch, sucrose and other organic compounds.
This objective is assessed through structured response, commonly using State / Outline / Predict.
State / Outline / Predict / Suggest
Build the answer around this relationship: Carbon dioxide is the source of carbon for photosynthetic carbohydrates.
Representative question
Outline how photosynthesis produces glucose.
a. solar/light energy is converted to chemical energy
b. energy needed to produce glucose
c. only specific wavelengths are absorbed by chlorophyll OR
red and blue absorbed most strongly.
OR
chlorophyll is the pigment that absorbs light energy
d. H(+)/electrons from water are used to reduce compounds
e CO2 is absorbed/used/reduced to produce carbohydrates
f. correct word/balanced symbol equation of photosynthesis
Marking guidance:
Accept correct reference to NADPH/ATP from AHL.
This objective is assessed through multiple choice, commonly using State.
State
Build the answer around this relationship: Photolysis splits water during the light-dependent reactions.
Representative question
Which group(s) produce(s) oxygen as a by-product of photosynthesis?
I. Algae
II. Cyanobacteria
III. Fungi
I only
I and II only
II and III only
I, II and III
B
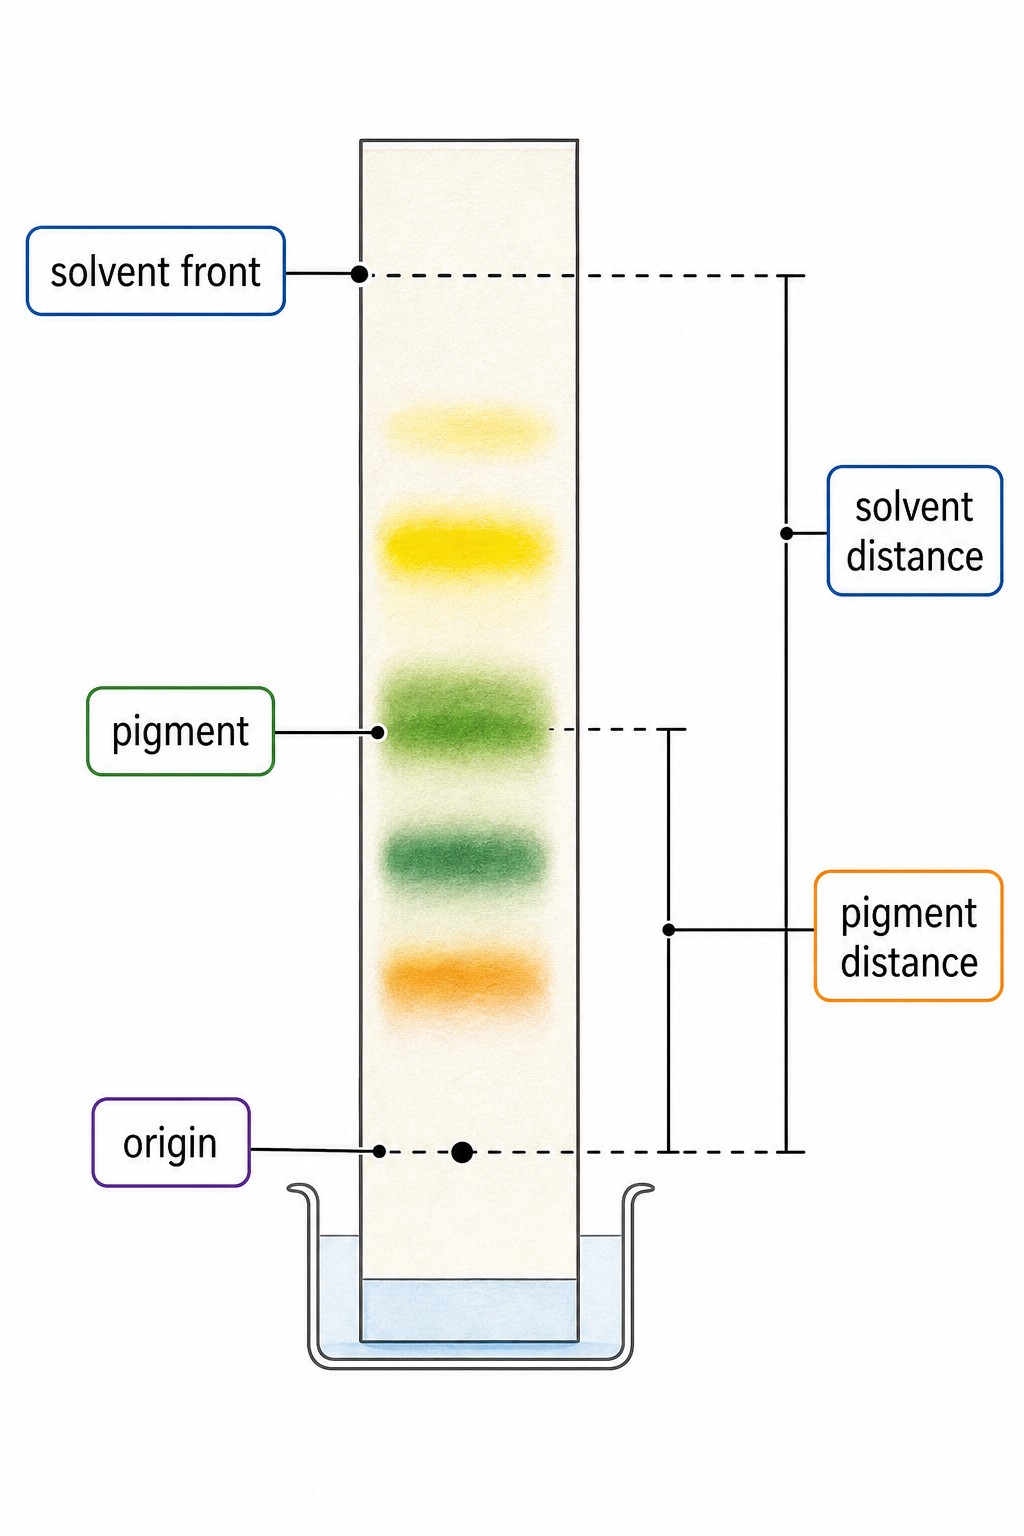
Photosynthetic pigments can be separated and identified because they differ in solubility in the mobile solvent and attraction to the stationary phase.
Extract pigments, place a small concentrated spot on paper or a thin-layer plate, keep the spot above the solvent, allow the solvent front to rise, then mark the solvent front immediately and observe the separated bands.
Rf=distancetravelledbypigment÷distancetravelledbysolventfront
If a pigment travels 4.2 cm while the solvent front travels 6.0 cm, Rf = 4.2 ÷ 6.0 = 0.70. Identify a pigment using both its colour and an Rf reference obtained with the same solvent and stationary phase.
Rf has no unit and normally lies between 0 and 1. It depends on the solvent and stationary phase, so an Rf from different conditions is not a secure identification; band distance alone is not pigment abundance.
This objective is assessed through structured response, commonly using Identify / State / Outline.
Identify / State / Outline / Describe / Explain
Build the answer around this relationship: Chromatography separates pigments because they move different distances with the solvent.
Representative question
Describe the process used to obtain this chromatogram.
| a | crush/blend algae with organic solvent/alcohol/other valid solvent; |
| b | place drop of extracted algal pigments/ obtained liquid on thin layer OR mark the origin; |
| c | place slide (with pigments) in solvent ensuring the pigment spot does not touch the solvent OR solvent moves up carrying pigments OR different pigments move at different rates/distances (so can be distinguished); |
Thin layer could be
(chromotography) paper, slide,
column etc.
3 max

An absorption spectrum shows the proportion of each wavelength absorbed by a pigment; an action spectrum shows the measured rate or effectiveness of photosynthesis at each wavelength.
Only photons with suitable energies are absorbed and excite electrons in pigment molecules. Chlorophylls and accessory pigments absorb different wavelength ranges, so their combined absorption helps explain the action spectrum.
Plot wavelength in nanometres, with the corresponding light colours, on the horizontal axis. For an action spectrum, calculate photosynthesis rate from oxygen production or carbon-dioxide consumption at each wavelength and plot rate on the vertical axis.
If oxygen production is greatest in blue and red light and lowest in green light, the action spectrum has blue and red peaks that broadly match pigment absorption; accessory pigments can make the curves differ.
Absorption and photosynthesis rate are different dependent variables. Do not label an action-spectrum y-axis as absorbance, and compare rates only when intensity and other limiting factors are controlled.
This objective is assessed through structured response, commonly using Describe / Distinguish / Outline.
Describe / Distinguish / Outline / Predict / Explain
Build the answer around this relationship: Chlorophyll absorbs blue and red light more strongly than green light.
Representative question
Outline how plants make use of the different wavelengths of light.
a. light used in photosynthesis/light-dependent reactions/ photolysis/photosystems/photophosphorylation/excitation of electrons/switch to flowering
b. chlorophyll absorbs red AND blue light (more)
c. chlorophyll/leaf/plant reflects/does not absorb/does not use green light
d. absorption spectrum of chlorophyll has peaks in the red and blue/sketch graph to show this
e. action spectrum shows which wavelengths plants use in photosynthesis/sketch graph of action spectrum showing peaks in the blue and red
f. accessory/other (named) photosynthetic pigments absorb different wavelengths/colours
g. violet is the shortest wavelength and red the longest
h. red light and far red/infra-red absorbed to measure length of light/dark periods
4 max
This objective is assessed through experimental design, commonly using Sketch / Draw / Explain.
Sketch / Draw / Explain / Compare / Contrast / Predict / Deduce / Identify
Build the answer around this relationship: Absorption spectra measure light absorbed by pigments at each wavelength.
Representative question
Draw a fully labelled graph of the action spectrum for photosynthesis.
a. axes correctly labelled «wavelength and rate of photosynthesis»
b. 400 and 700 nm as limits
c. correct shape of curve involving two peaks at the correct places, broader in the blue-violet range not starting at zero and a narrower peak in the orange-red range with the trough in the green range that does not reach zero
d. peaks of activity at 430 nm AND at 660 nm
e. peaks indicated as «violet» blue light AND peak indicated as «orange» red light
Accept rate of oxygen production for rate of photosynthesis.
3 max
At any moment, the limiting factor is the condition in shortest effective supply relative to photosynthetic demand; increasing it raises rate until another factor becomes limiting.
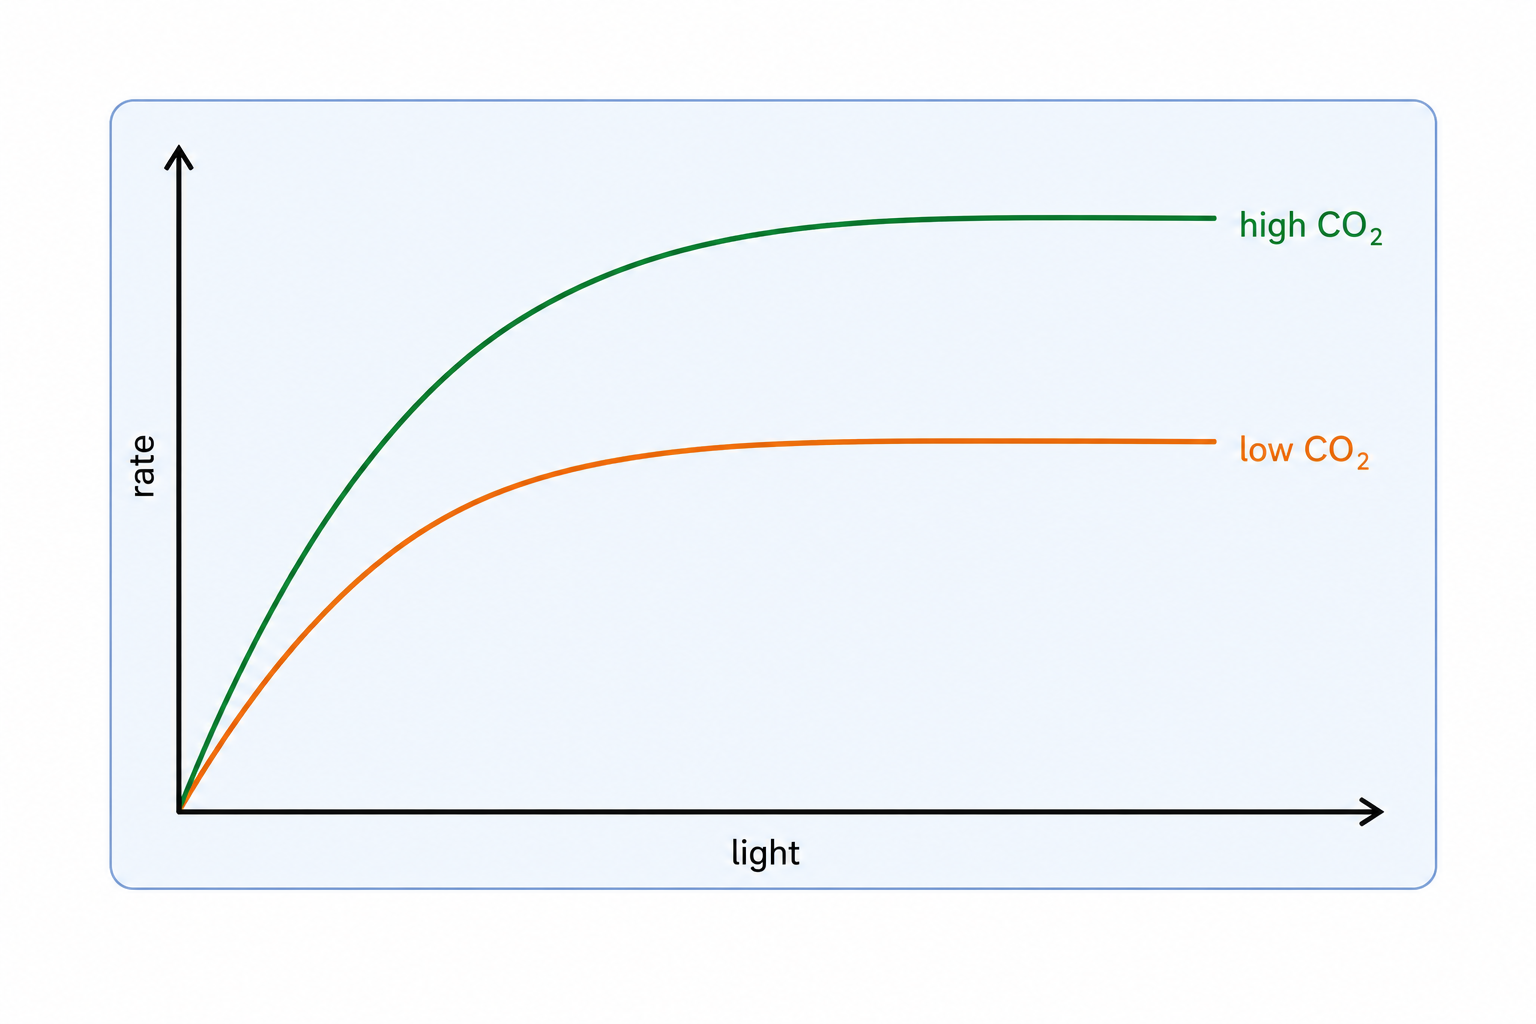
State a testable hypothesis, vary one independent variable—carbon-dioxide concentration, light intensity or temperature—and measure photosynthesis rate as the dependent variable. Control the other two, plant material, time and measurement conditions; repeat measurements.
Vary light with lamp distance or a light meter, CO₂ with known hydrogencarbonate concentrations or gas control, and temperature with a thermostatically controlled water bath. Measure an initial oxygen-production or CO₂-consumption rate.
A rate rising with light intensity and then reaching a plateau supports the hypothesis that light was initially limiting; at the plateau, CO₂ concentration, temperature or biochemical capacity may limit instead.
A hypothesis is provisional and needs repeated testing. A plateau does not mean photosynthesis has stopped, and moving a lamp can also change temperature unless heat is controlled.
This objective is assessed through structured response, commonly using State / Identify / Determine.
State / Identify / Determine / Calculate / Describe / Compare / Explain / Suggest / Draw / Sketch / Predict / Outline / Discuss
Build the answer around this relationship: Photosynthesis rises with a limiting factor only while that factor restricts the rate.
Representative question
Explain methods by which the rate of photosynthesis can be measured, including conditions that affect the rate.
measuring oxygen release;
measuring volume / counting rising oxygen bubbles / counting rising disks;
measuring carbon dioxide intake/uptake;
CO2 can be measured by change in pH / increase in pH shows an increase in CO2 fixation;
increase in biomass would be an indirect measure of photosynthesis / measure of net photosynthesis;
measure starch production / dry organic mass;
increasing temperature would increase the rate of photosynthesis;
provided the temperature did not go above optimum temperature of enzymes;
increasing carbon dioxide concentration would increase the rate of photosynthesis;
higher light intensity would increase the rate of photosynthesis;
light of different wavelengths / blue and red light can affect photosynthesis / green wavelength usually not absorbed;
Carbon-dioxide enrichment experiments test how higher atmospheric CO₂ may alter photosynthesis and plant growth, but responses depend on other limiting factors.
| Design | Control strength | Realism | Typical limitation |
|---|---|---|---|
| Enclosed greenhouse/chamber | CO₂ and other conditions can be controlled closely | Artificial enclosure | Chamber conditions can alter light, temperature or airflow |
| FACE field experiment | CO₂ is raised around plants in an open ecosystem | High field realism | Weather and ecosystem variation are harder to control |
Compare enriched and ambient-CO₂ treatments with replication. Record photosynthetic rate and longer-term growth or biomass while monitoring controlled variables such as light, temperature, water, nutrients and plant age.
A crop may show greater CO₂ uptake under enrichment when light and nutrients are sufficient, but little additional biomass under shade or nutrient limitation. This conditional response improves predictions of future growth.
Higher CO₂ does not guarantee a proportional or permanent rise in photosynthesis or yield. Greenhouse results cannot be transferred to natural ecosystems without considering enclosure effects and field interactions.
This objective is assessed through structured response, commonly using Discuss.
Discuss
Build the answer around this relationship: FACE experiments expose plants to elevated carbon dioxide under more realistic field conditions.
Representative question
Using the data in the graph, discuss whether rising carbon dioxide levels in the atmosphere will increase growth rates in maize.
data does not support idea that rising CO2 levels will increase growth rates in maize
(at all temperatures) there appears to be no difference between exchange rate at current or elevated CO2 levels
temperature has larger effect on growth of maize
so if rising CO2 levels causes more of a greenhouse effect/larger temperature increase, this will affect growth of maize
Photosynthesis converts light energy into chemical energy in carbon compounds. Carbon dioxide is reduced to carbohydrate using hydrogen from water, glucose is the main stored product, and released oxygen comes from photolysis of water. Pigment evidence is tested with chromatography and Rf, spectra questions separate absorption from action, and rate/evidence questions use limiting factors, controls, and CO2 enrichment context.