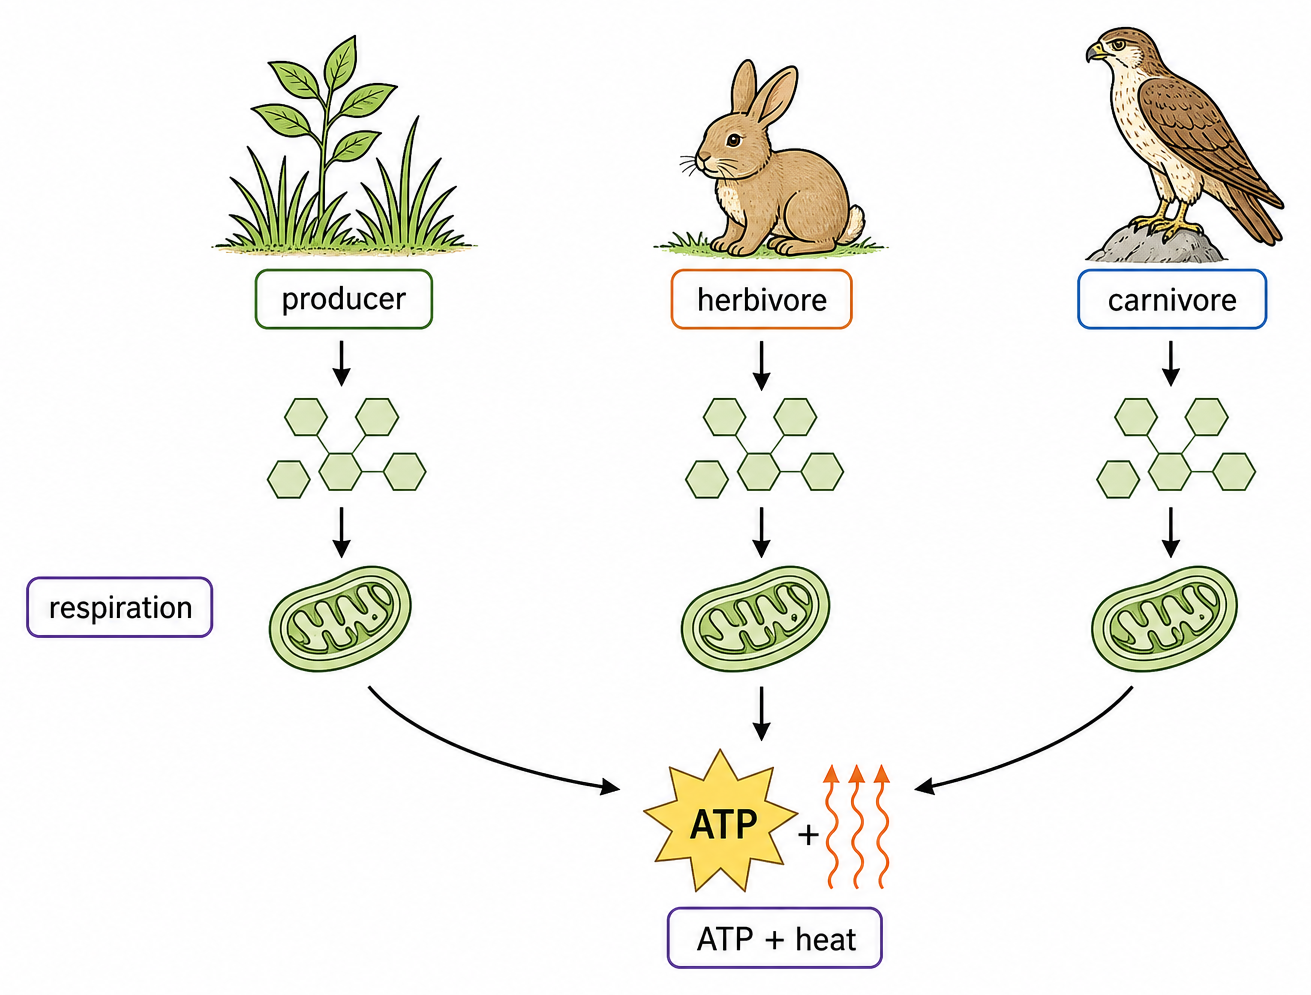
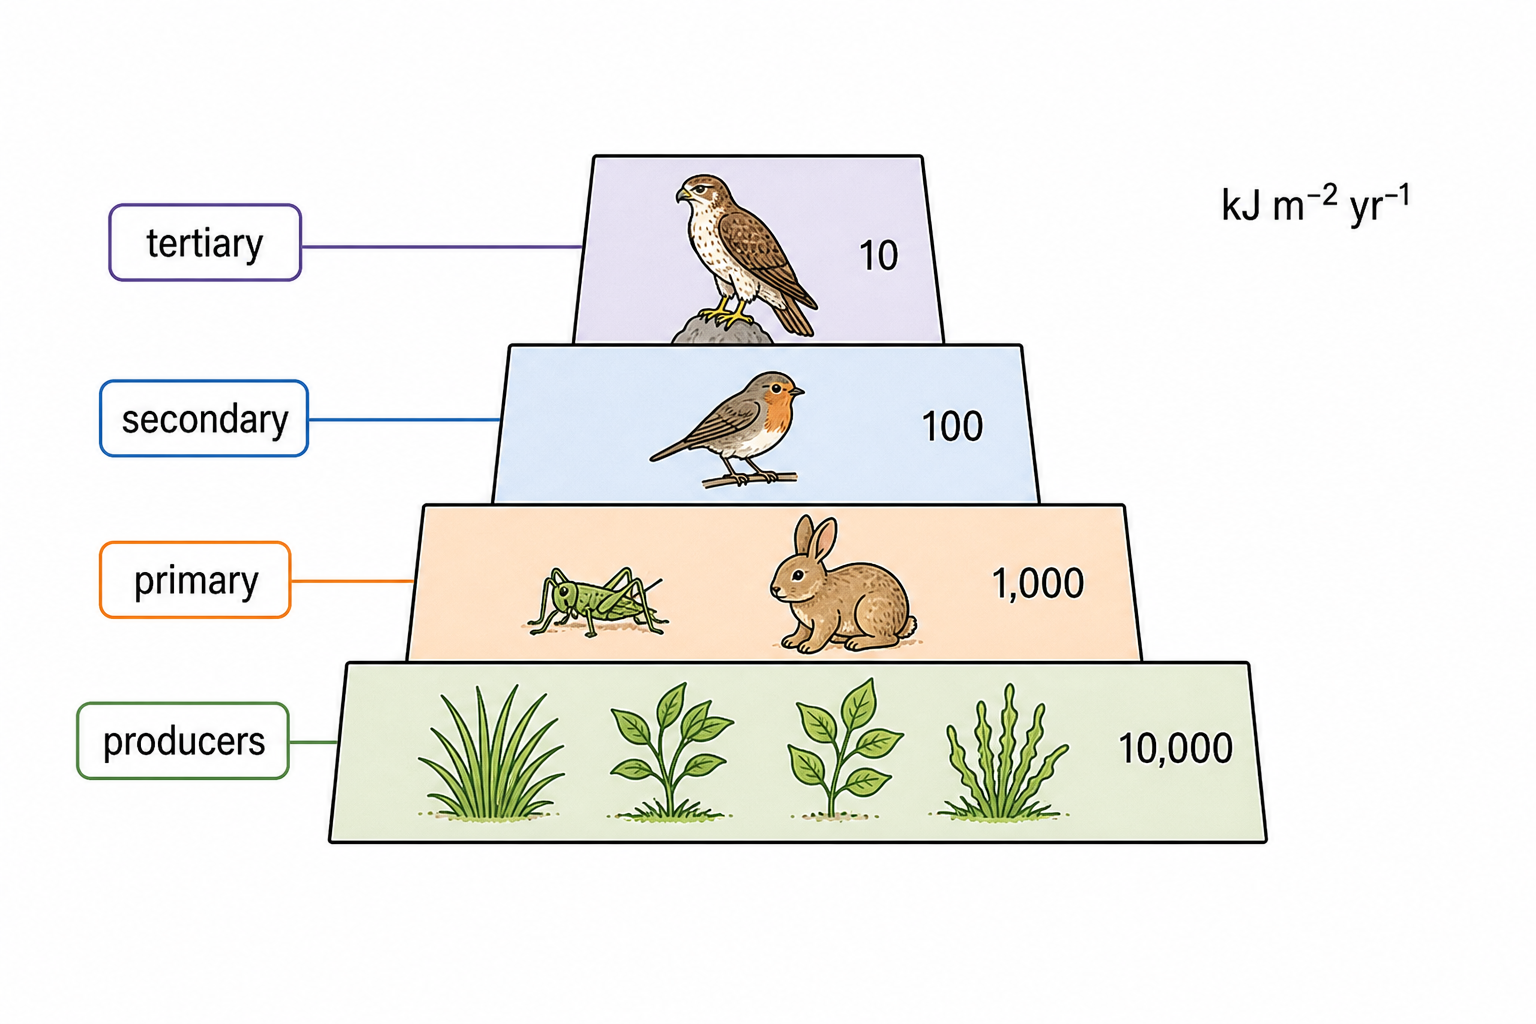
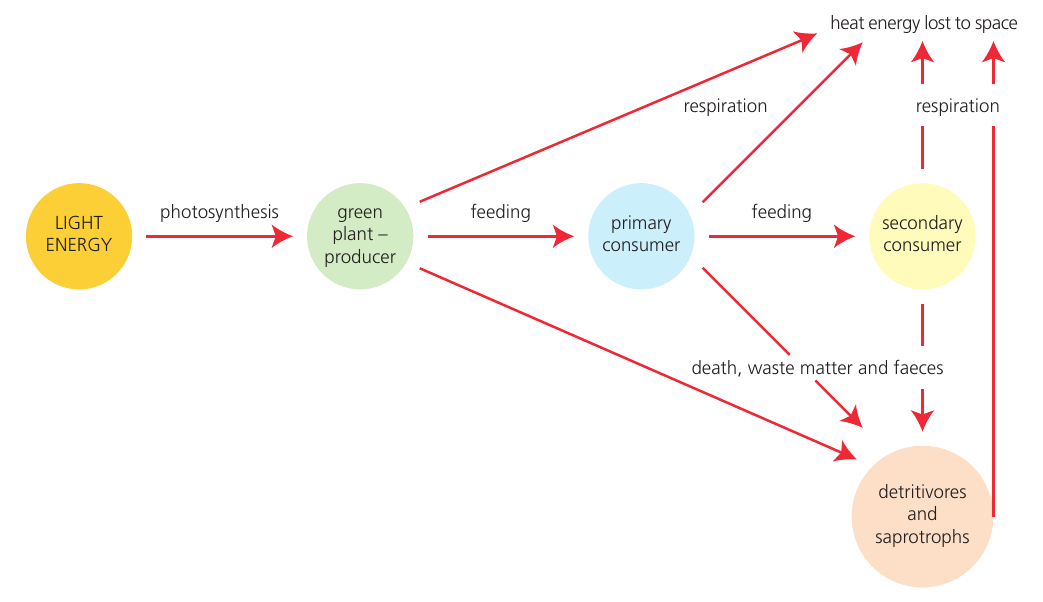
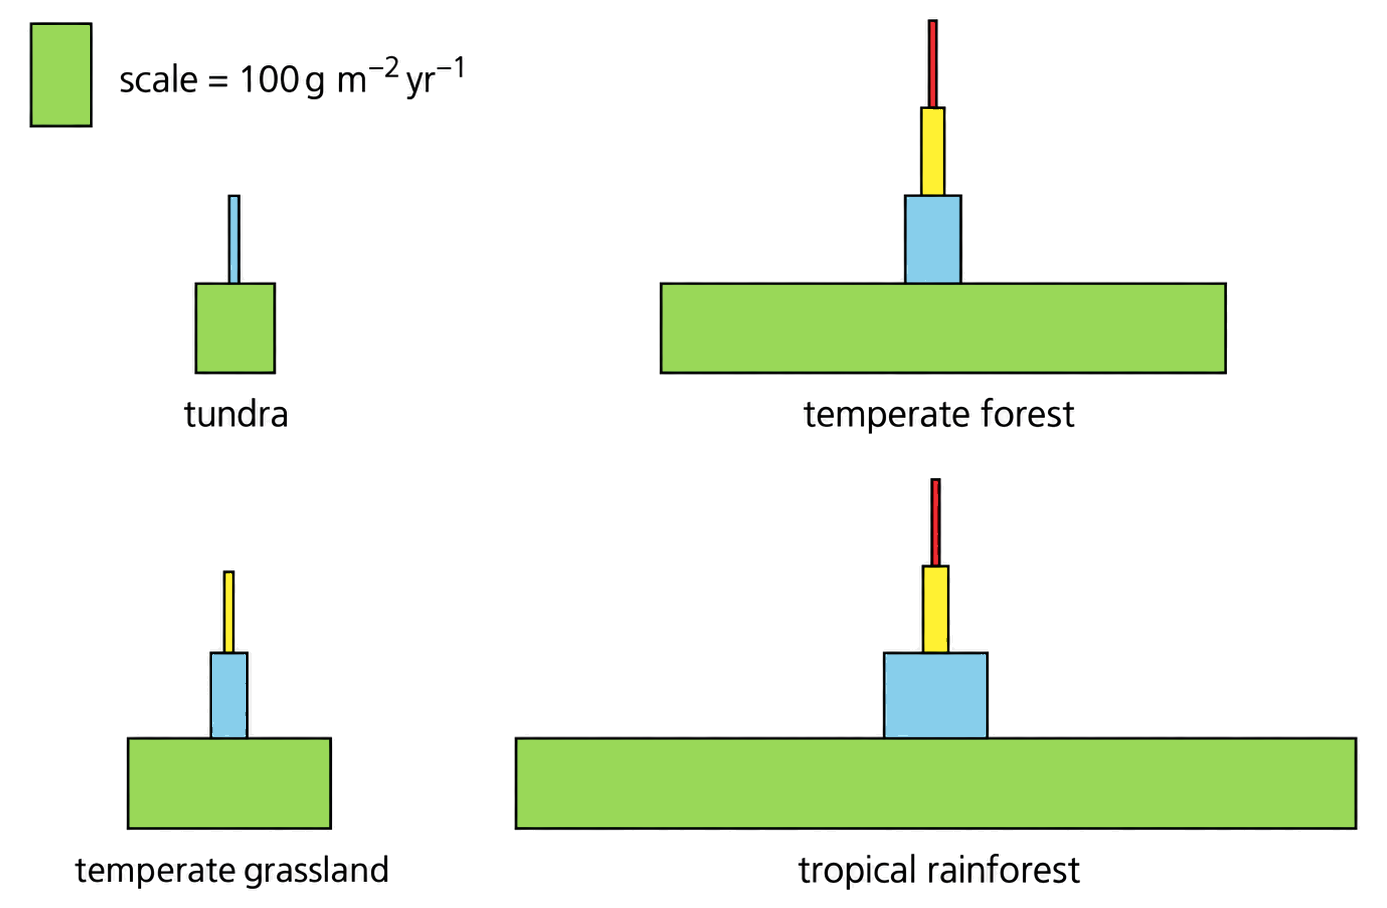
C4.1 Populations and communities

Populations and communities describe abundance, sampling, growth limits, species interactions and trophic controls that shape ecological patterns across habitats and ecosystems.

Syllabus
First assessment 2025
Topic
C4.1
Level
SL

A population is one species in one area

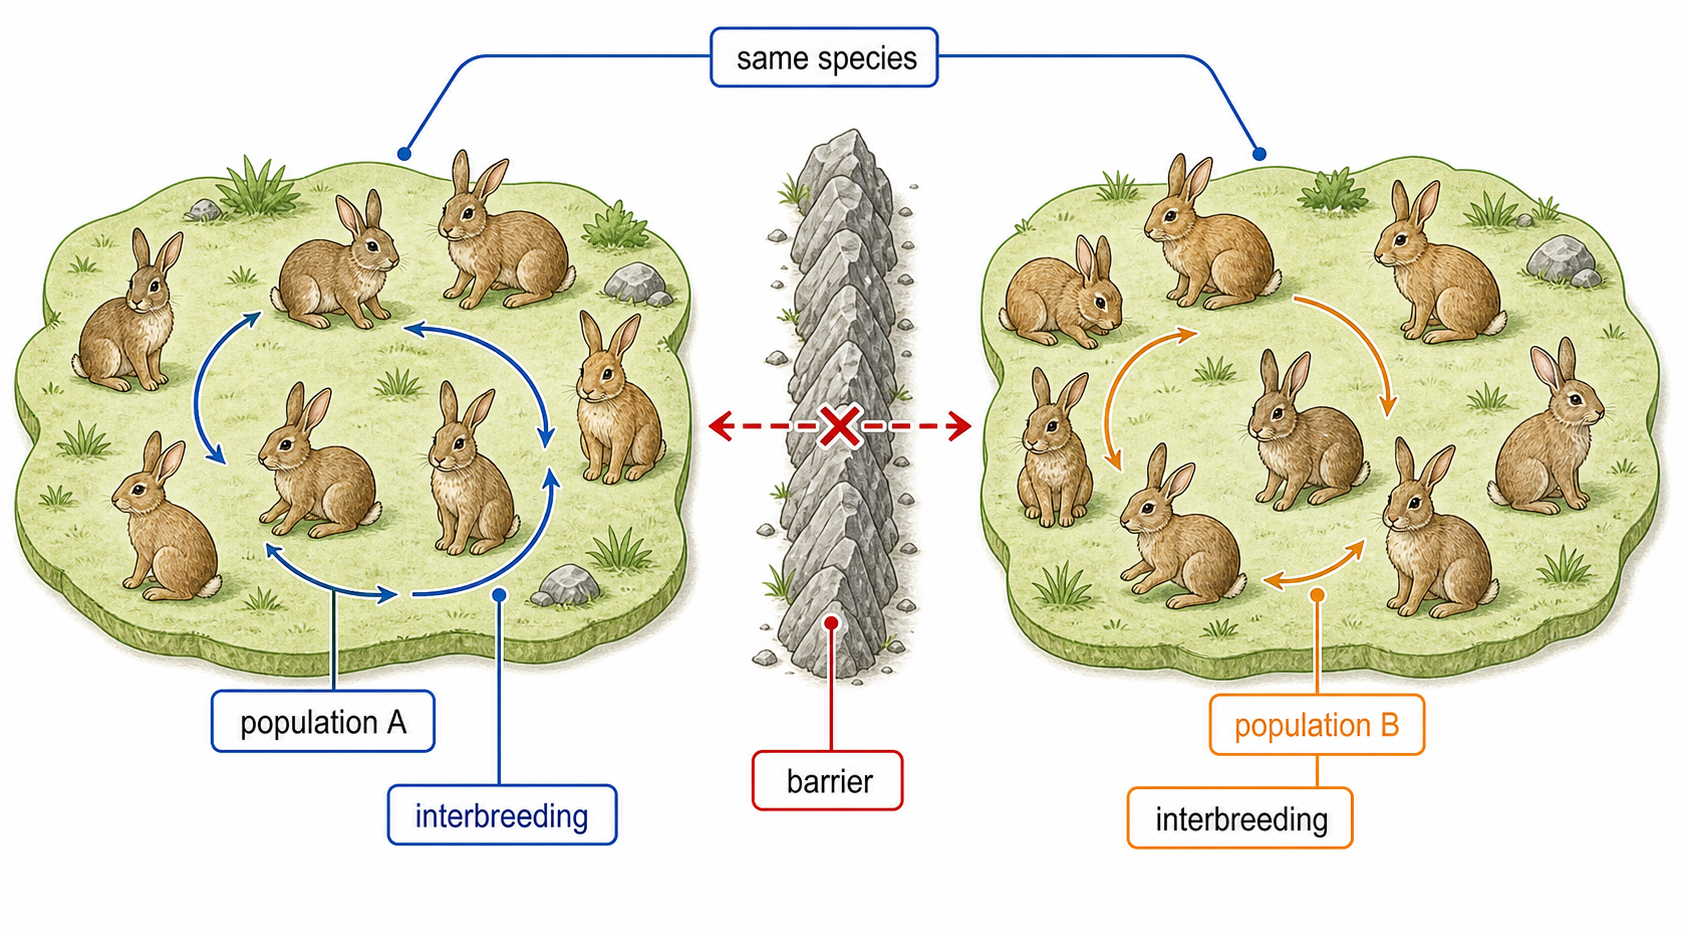
A population is an interacting group of organisms of the same species living in a defined area at the same time.

Members normally have opportunities to breed with one another. Reproductive isolation—little or no gene flow through breeding—can distinguish one population of a species from another.

State the species, spatial boundary and time; show interaction or breeding opportunity; use reproductive isolation to separate neighbouring populations when relevant.

Frogs of one species breeding in a connected pond system can form one population, while a geographically isolated group with no interbreeding is treated as a separate population.

A population is not every organism in a habitat—that is closer to a community. Sharing a species name alone is insufficient if groups are reproductively isolated.

Populations exam focus

Assessment in practice

1 marks
How it is assessed

This objective is assessed through structured response, commonly using Identify / Explain / State.

Command terms

Identify / Explain / State

What earns marks

Build the answer around this relationship: Populations must be linked to the correct ecological unit, method or species interaction.

Watch for

Confusing a population with a community or with all organisms in an ecosystem.

Representative question

Question 1

[Maximum number: 1]

State the biological term for a group of organisms of the same species living in an area.

Estimate population size with a defined method

Population size is estimated by random sampling when counting every individual is impractical, disruptive or impossible.

Random selection gives locations or individuals an unbiased chance of inclusion, making a sample more representative before its mean or marked fraction is extrapolated to the whole area.

Define target population and area → select positions or individuals randomly → standardize sampling effort → repeat → calculate estimate and uncertainty.

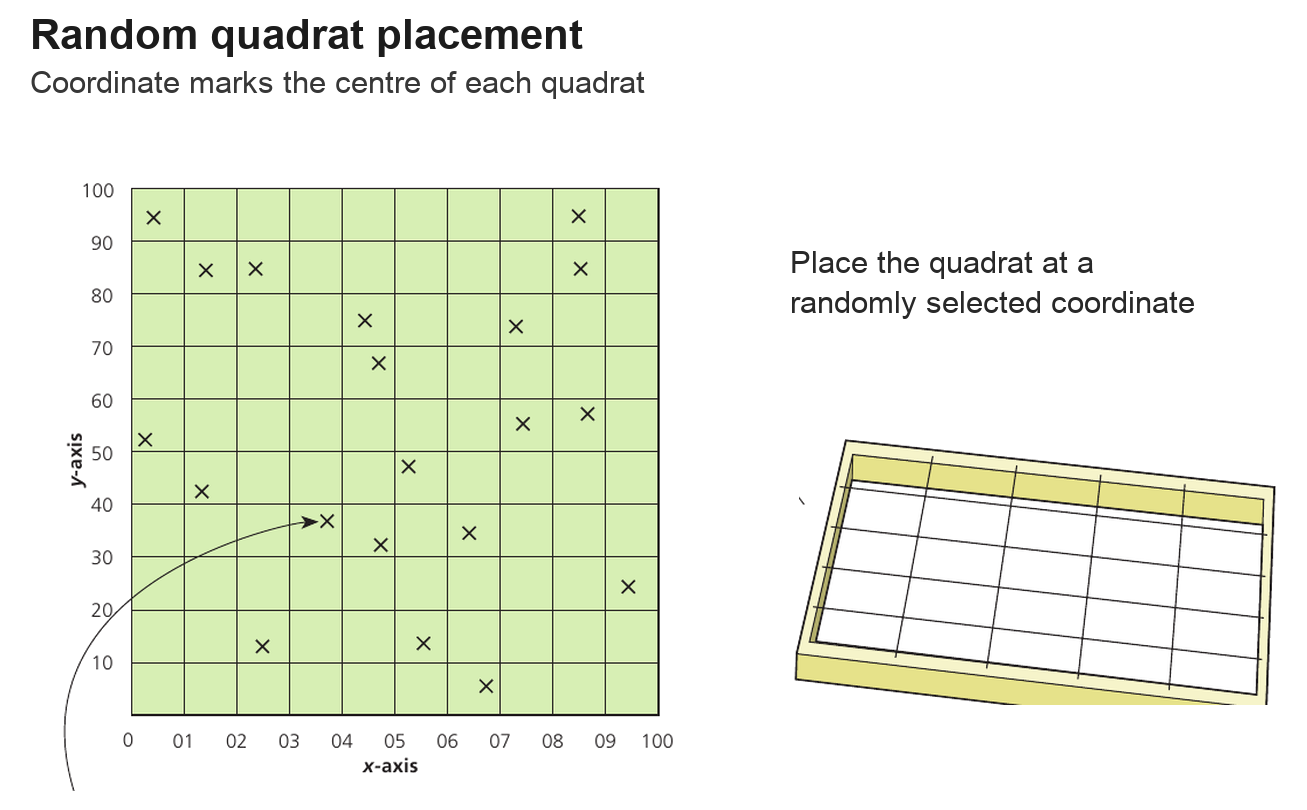
Random quadrat coordinates across a large meadow give an average plant density that can be multiplied by meadow area, avoiding convenient locations near a path.

Sampling error is the difference between the sample-based estimate and the true population size. Randomness reduces placement bias but cannot remove sampling error.

Population size estimation

Assessment in practice

1–3 marks
How it is assessed

This objective is assessed through structured response, commonly using Describe / Outline / Evaluate.

Command terms

Describe / Outline / Evaluate / Explain / State / Discuss / Suggest

What earns marks

Population size estimation is assessed through capture-mark-release-recapture population estimates, chi-squared testing of species association, transect and quadrat field sampling, quadrat sampling for population estimates.

Watch for

Confusing a population with a community or with all organisms in an ecosystem.

Representative question

Question 1

[Maximum number: 6]

Discuss how wild fish populations are assessed to ensure sustainable fishing practices.

Random quadrats reduce placement bias

Random quadrat sampling estimates abundance of sessile plants or animals whose individuals can be counted within a known area.

Map the study area, generate random coordinates, place equal-area quadrats at those positions, count individuals using a consistent boundary rule, repeat many times, and scale the mean count per quadrat to the total habitat area.

Use a calculator to obtain the standard deviation of quadrat counts. A small standard deviation suggests counts are similar and distribution is relatively even; a large standard deviation suggests strong spatial variation or clumping.

If 1 m² quadrats average 4 plants and the habitat is 250 m², the estimated population is 4 × 250 = 1,000 plants; the standard deviation shows how variable the counts were around that mean.

Quadrats suit sessile organisms, not freely moving animals. Random placement does not guarantee representation if too few or poorly sized quadrats are used; the standard-deviation formula need not be memorized.

Random quadrat sampling

Assessment in practice

2 marks
How it is assessed

This objective is assessed through structured response, commonly using Outline / Distinguish / Determine.

Command terms

Outline / Distinguish / Determine / Describe

What earns marks

Build the answer around this relationship: Random quadrat sampling must be linked to the correct ecological unit, method or species interaction.

Watch for

Confusing a population with a community or with all organisms in an ecosystem.

Representative question

Question 1

[Maximum number: 3]

Describe a method that can be used to measure the diversity of herbaceous plants in one of the green areas at different distances from the main road.

Capture–mark–recapture estimates mobile populations

Capture–mark–recapture estimates mobile populations.

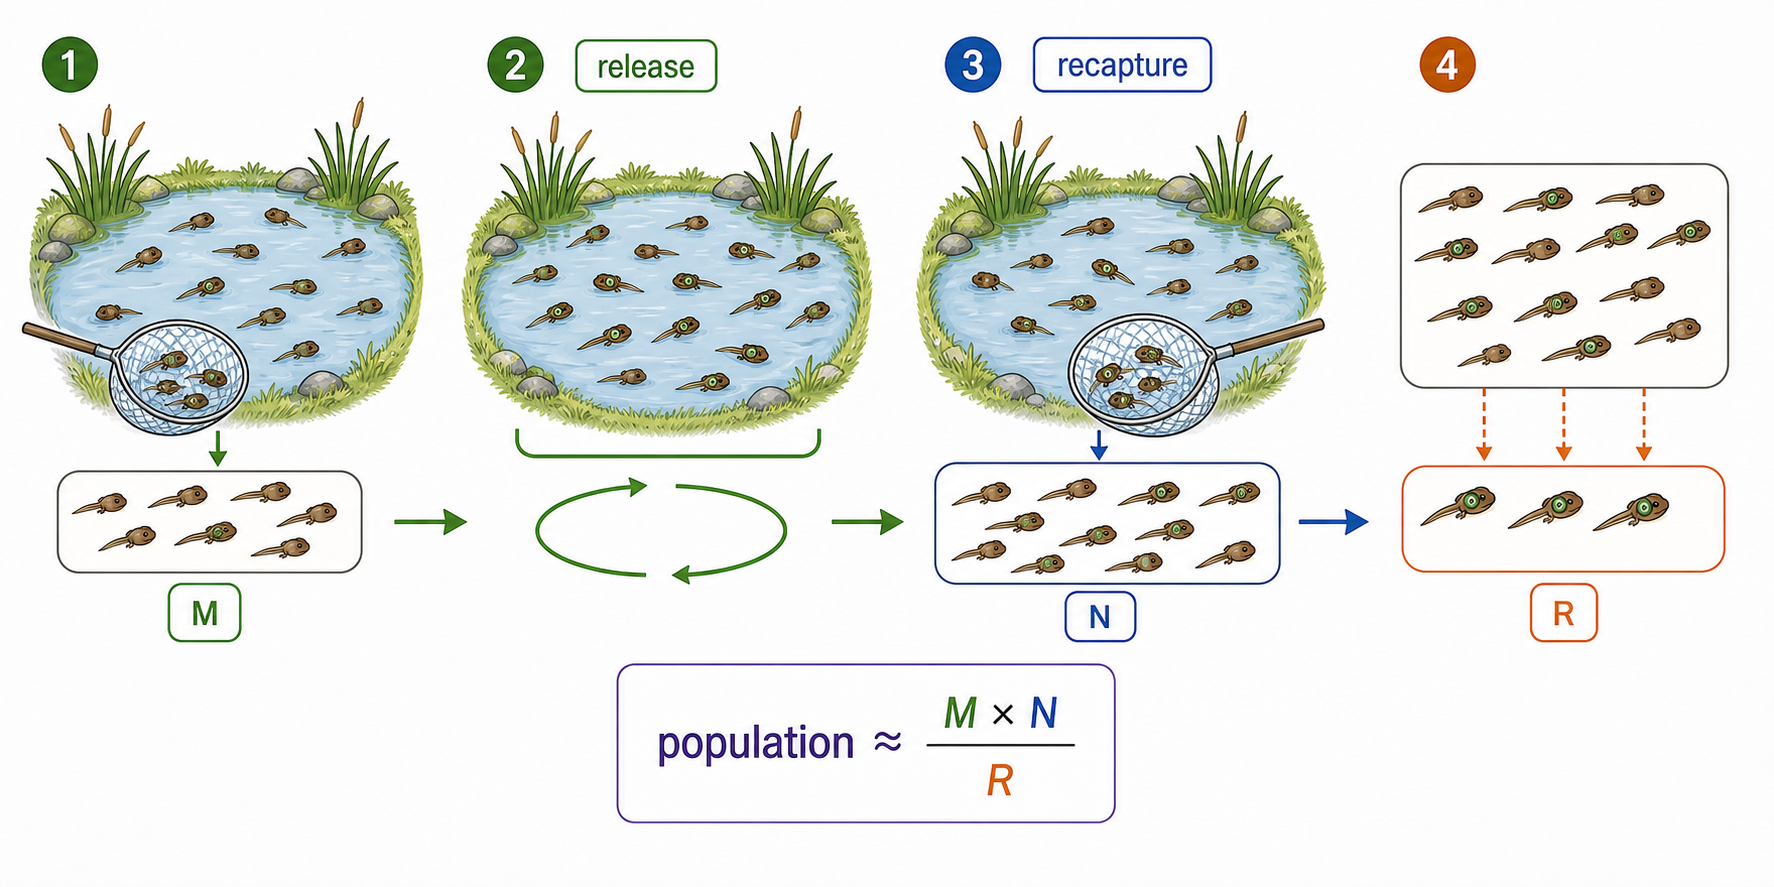
A first sample is captured, marked harmlessly and released. After mixing, a second sample is taken; the marked fraction helps estimate the total population.

N≈(first caught × second caught)/marked recaptured; check mixing, mark retention and equal catchability.

If 40 fish are marked, 50 are caught later and 10 are marked, the estimate is about 200 fish.

The calculation fails if marks are lost, animals learn the trap or the population changes between samples.

Capture-mark-release-recapture exam focus

Assessment in practice

2–6 marks
How it is assessed

This objective is assessed through structured response, commonly using Describe / Outline / Explain.

Command terms

Describe / Outline / Explain / Identify

What earns marks

Key ideas include Capture Mark Release Recapture, Estimates, Motile, Animal, each tied to evidence about abundance, distribution, survival or species effects.

Watch for

Confusing a population with a community or with all organisms in an ecosystem.

Representative question

Question 1

[Maximum number: 6]

Explain the technique used to estimate the population size of a named species of organism that is able to move.

Carrying capacity is a resource-limited population size

Carrying capacity is a resource-limited population size.

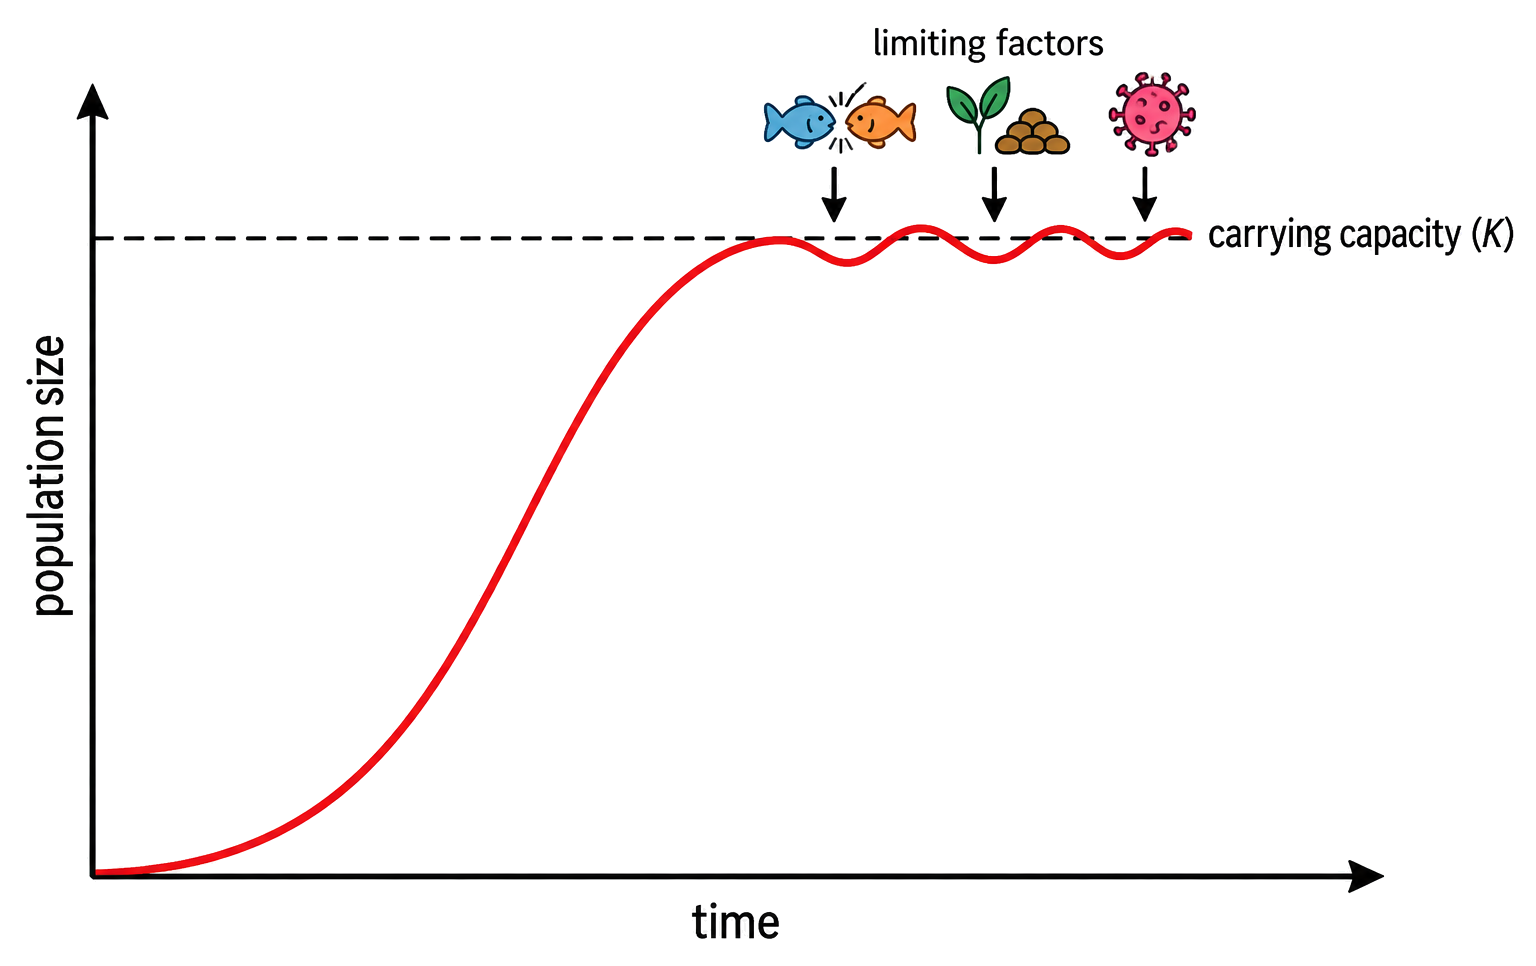
Carrying capacity is the population size an environment can support over time under specified conditions. Resource limits and feedback make growth slow as the population approaches it.

identify limiting resource; link density to birth/death rate; state that capacity can change.

A drought lowers available food, so the carrying capacity for grazing animals falls even if the species is unchanged.

Carrying capacity is not a fixed species constant; it depends on environment and timescale.

Carrying capacity

Assessment in practice

1–6 marks
How it is assessed

This objective is assessed through structured response, commonly using Identify / Describe / Explain.

Command terms

Identify / Describe / Explain / Outline / State

What earns marks

Build the answer around this relationship: Carrying capacity must be linked to the correct ecological unit, method or species interaction.

Watch for

Confusing a population with a community or with all organisms in an ecosystem.

Representative question

Question 1

[Maximum number: 7]

Explain why populations that have grown exponentially reach a maximum size, rather than continue to grow.

Negative feedback restrains population growth

Negative feedback restrains population growth.

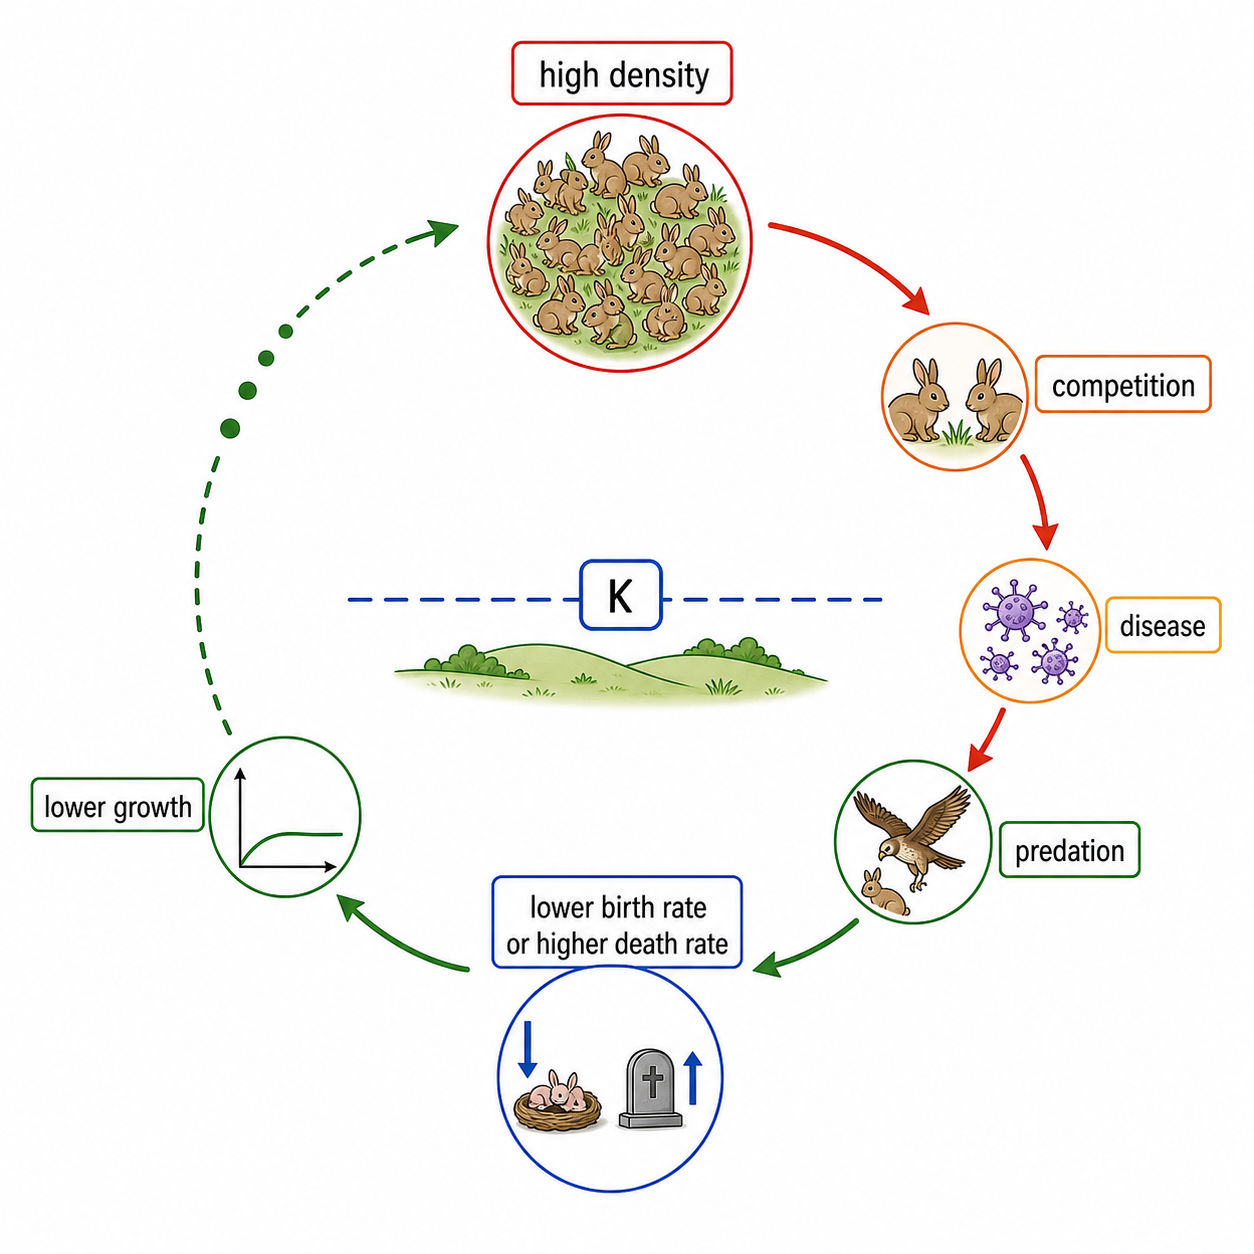
As density rises, competition, disease or predation can reduce births or increase deaths. The response opposes the change and tends to return population size toward a range.

disturbance → density-dependent response → birth/death change → correction.

Crowding increases disease transmission, lowering survival and slowing further population growth.

Not every population change is negative feedback; density-independent storms can reduce numbers without crowding.

Negative feedback control

Assessment in practice

1–2 marks
How it is assessed

This objective is assessed through structured response, commonly using Identify / Explain.

Command terms

Identify / Explain

What earns marks

Build the answer around this relationship: Negative feedback control must be linked to the correct ecological unit, method or species interaction.

Watch for

Confusing a population with a community or with all organisms in an ecosystem.

Representative question

Question 1

[Maximum number: 2]

Explain the change in numbers of the cactus moth throughout the study period.

Growth curves show changing net population rate

Population growth is exponential while resources are abundant and limiting factors are weak, but becomes sigmoid as density-dependent limits slow growth near carrying capacity.

During exponential growth, a roughly constant per-capita growth rate produces an increasingly steep rise. In a sigmoid model, competition and other density-dependent factors reduce net growth until births plus immigration balance deaths plus emigration near carrying capacity.

Test exponential growth by plotting population size on a logarithmic vertical axis against time on a linear horizontal axis: exponential data form an approximately straight line. For the IB sigmoid model, a separate lag phase is not expected.

An introduced population with abundant food may initially show a straight line on the semi-log graph; later points fall below that line as resource limitation increases and the population approaches a plateau.

A population curve is an idealized model, not a guaranteed trajectory. A steep slope means rapid change, not the greatest population size; migration, seasons and disturbances can alter the pattern.

Population growth curves

Assessment in practice

1–3 marks
How it is assessed

This objective is assessed through essay response, commonly using Draw / Identify / Label.

Command terms

Draw / Identify / Label / Outline / State / Explain / Discuss / Suggest / Compare

What earns marks

Build the answer around this relationship: Population growth curves must be linked to the correct ecological unit, method or species interaction.

Watch for

Confusing a population with a community or with all organisms in an ecosystem.

Representative question

Question 1

[Maximum number: 6]

Discuss the factors affecting population growth that can result in an exponential growth curve.

The sigmoid model links growth to carrying capacity

A sigmoid growth model can be tested by repeatedly measuring a population grown under controlled conditions, such as yeast or duckweed.

Start replicate cultures with comparable initial populations, keep temperature, nutrients, volume and light conditions controlled, measure population size at regular intervals, calculate means, and plot population size against time.

Look for an initially increasing growth rate, a transition as limiting factors intensify, and a plateau near carrying capacity. Compare replicate data with the ideal S-shaped curve and identify deviations.

Duckweed frond number can be counted daily in replicate containers; nutrient depletion, shading and crowding eventually reduce net growth and produce a plateau.

The sigmoid is a model. A plateau may shift if conditions change, and deviations must not be hidden by forcing a fitted curve through poor data.

Competition occurs when organisms share a limited resource

Intraspecific relationships occur within one population: individuals compete when they require the same limited resource, but may cooperate when joint action raises survival or reproduction.

Relationship within one species Why it occurs Real example
Competition Food, mates, territory, nesting sites or light are limited Male deer compete for access to mates
Cooperation Coordinated action gives a shared fitness benefit Wolves hunt in packs to capture prey that one wolf may not subdue
Cooperation Care increases offspring survival Adult birds feed and defend their chicks

As a plant population becomes denser, individuals of the same species shade one another and compete for light; cooperative animal hunting can instead increase each participant's food access.

Competition need not involve aggression, and cooperation can have costs. An interaction between two different plant species is interspecific and does not demonstrate this objective.

Competition vs. cooperation

Assessment in practice

1–2 marks
How it is assessed

This objective is assessed through structured response, commonly using Discuss / State / Describe.

Command terms

Discuss / State / Describe / Outline / Suggest / Compare / Contrast

What earns marks

Build the answer around this relationship: Competition versus cooperation must be linked to the correct ecological unit, method or species interaction.

Watch for

Describing overlapping niches without explaining that one competitor is displaced or restricted.

Representative question

Question 1

[Maximum number: 2]

Compare and contrast the frequency of monopoly and fighting when there is a change from two trays to one tray of food.

A community contains interacting populations

A community contains interacting populations.

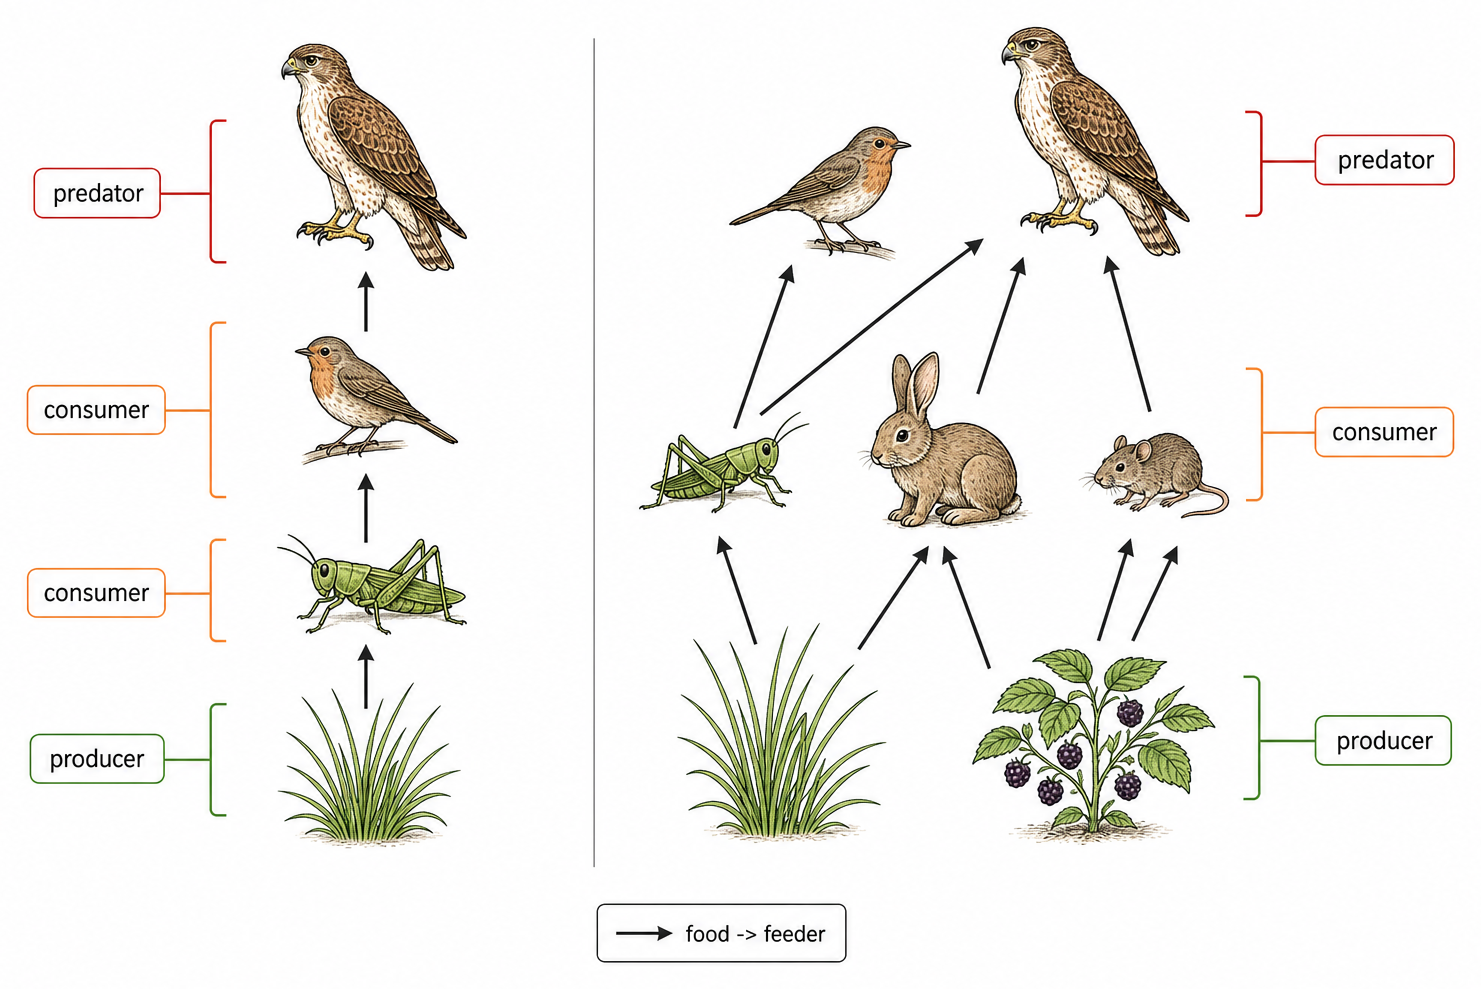
A community is the populations of different species living and interacting in one area. Its composition and structure depend on abiotic conditions and biotic relationships.

list populations; define boundary; identify interaction and environmental filter.

A pond community includes algae, plants, fish, bacteria and invertebrates interacting under the pond’s chemistry and light.

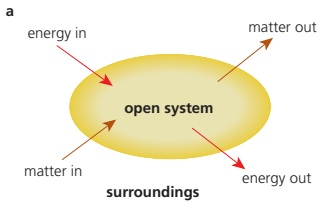
A community is not the same as an ecosystem: an ecosystem also includes abiotic stores and flows.

Community exam focus

Assessment in practice

1 marks
How it is assessed

This objective is assessed through structured response, commonly using Identify / State / Suggest.

Command terms

Identify / State / Suggest / Evaluate / Compare / Contrast / Describe / Explain

What earns marks

Build the answer around this relationship: Community must be linked to the correct ecological unit, method or species interaction.

Watch for

Including abiotic factors in the definition of community instead of reserving them for ecosystem.

Representative question

Question 1

[Maximum number: 3]

Compare and contrast the community structure within and outside the marine protected area.

Interspecific relationships change population outcomes

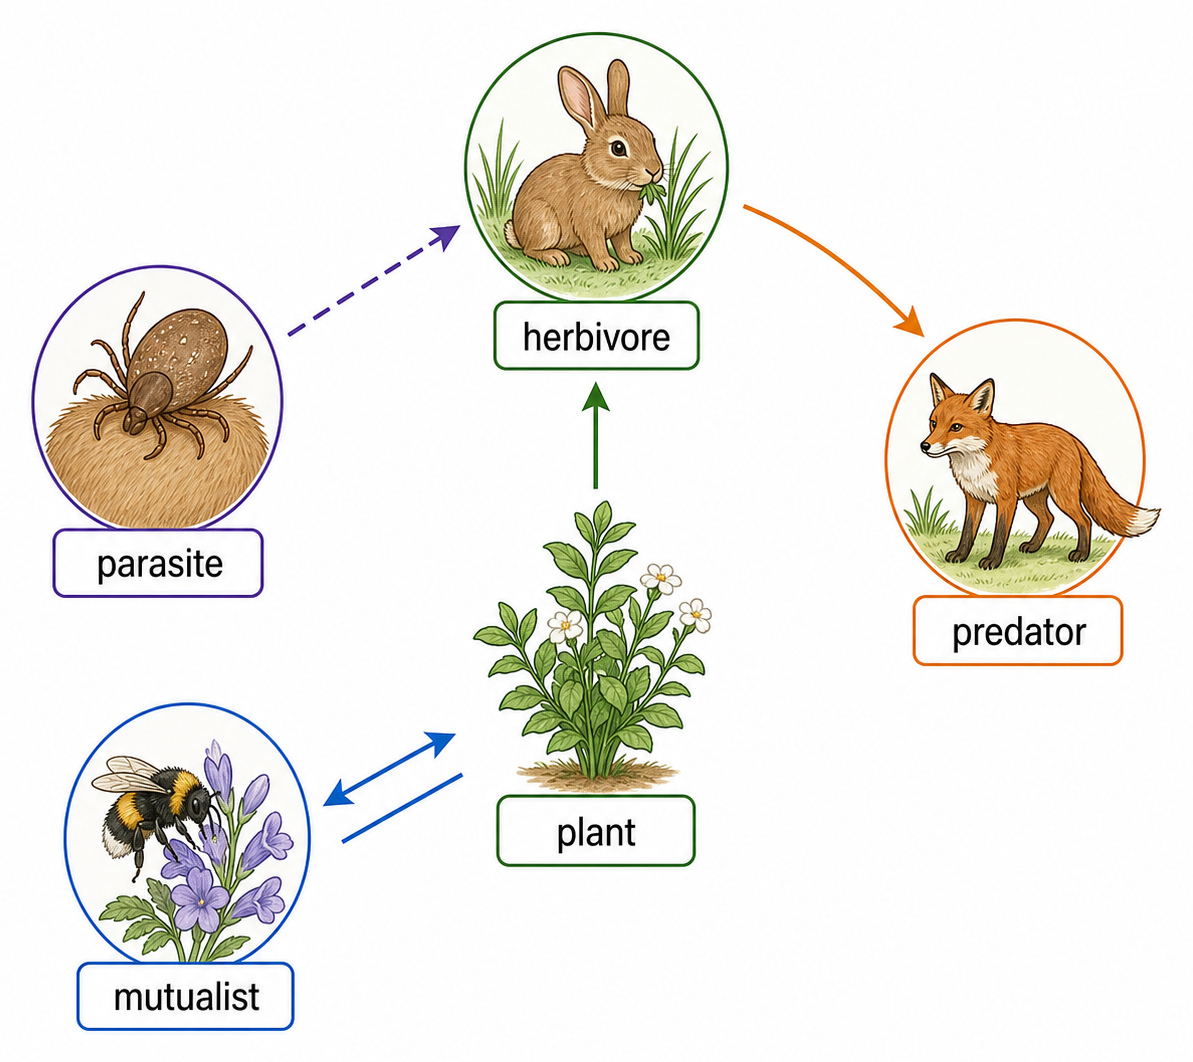
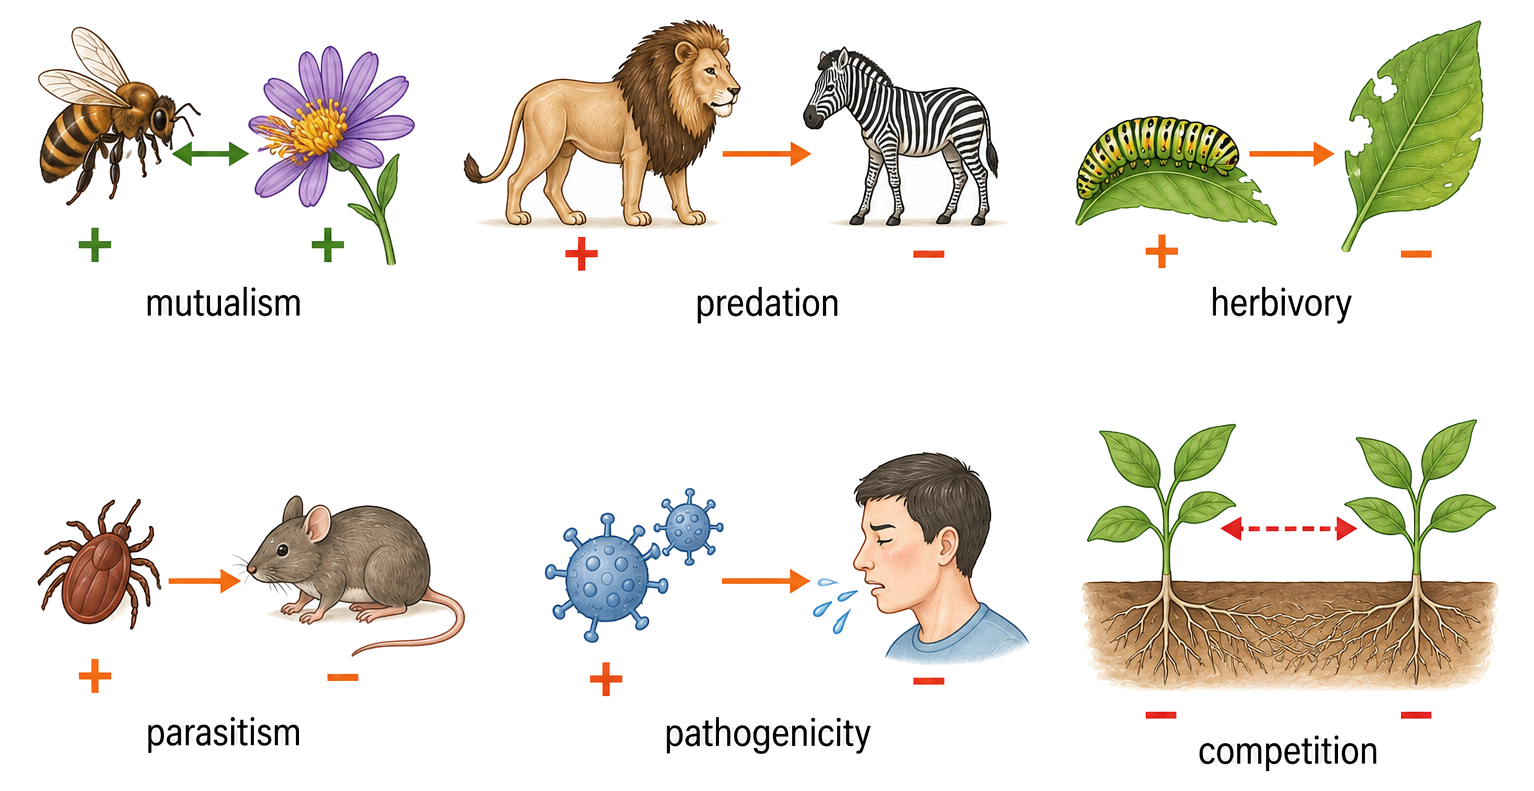
Interspecific relationships are interactions between different species that change survival, growth or reproduction within a community.

Category Effect Example
Herbivory Herbivore benefits; plant is harmed Caterpillar eats leaf tissue
Predation Predator benefits; prey is killed Owl captures a mouse
Interspecific competition Both lose access to a limited resource Two plant species compete for light
Mutualism Both species benefit Bee gains nectar while pollinating a flower
Parasitism Parasite benefits; host is harmed Tick feeds on a mammal
Pathogenicity Pathogen benefits/reproduces; host is harmed Rust fungus infects a wheat plant

Classify from the mechanism and effects, not from proximity alone. Commensalism is a valid ecological term but is not one of the six categories required for this objective.

Interspecific relationships

Assessment in practice

1–2 marks
How it is assessed

This objective is assessed through essay response, commonly using Identify / Discuss / Describe.

Command terms

Identify / Discuss / Describe / State / Suggest / Predict / Deduce / Evaluate

What earns marks

Interspecific relationships is assessed through predator-prey effects and population regulation, interspecific relationships in communities, capture-mark-release-recapture population estimates, chi-squared testing of species association.

Watch for

Confusing a population with a community or with all organisms in an ecosystem.

Representative question

Question 1

[Maximum number: 3]

Evaluate whether crop yield may be improved through enhancement of pollinator richness.

Mutualism gives both partners a context-dependent benefit

Mutualism is an interspecific relationship in which both species receive a net benefit.

Required mutualism Benefit to first partner Benefit to second partner
Fabaceae root nodules + nitrogen-fixing bacteria Legume receives usable nitrogen compounds Bacteria receive sugars and a protected nodule habitat
Orchidaceae + mycorrhizal fungus Orchid gains mineral nutrients/water and support during germination Fungus receives carbon compounds from the plant in the mutualistic association
Hard coral + zooxanthellae Coral receives photosynthetic carbon compounds and oxygen Algae receive shelter, CO₂ and mineral nutrients

Name the benefit to each organism. Merely living together is not enough to establish mutualism, and the balance of benefit can change with environmental conditions.

Mutualism as interspecific relationship

Assessment in practice

1–2 marks
How it is assessed

This objective is assessed through structured response, commonly using Outline / Suggest / Deduce.

Command terms

Outline / Suggest / Deduce / Distinguish / State / Describe / Identify / Analyse

What earns marks

Build the answer around this relationship: Mutualism as interspecific relationship must be linked to the correct ecological unit, method or species interaction.

Watch for

Confusing a population with a community or with all organisms in an ecosystem.

Representative question

Question 1

[Maximum number: 3]

Analyse the relationship between plants and their pollinators.

Endemic and invasive describe distribution histories

An introduced species can become invasive when it acquires limiting resources more effectively than local endemic or native species and spreads at their expense.

In southern China, the introduced vine Mikania micrantha grows rapidly over local vegetation. Its canopy captures light and space, shading slower-growing native plants and reducing their access to photosynthetic resources.

For a local case, identify introduced species → named resource → acquisition advantage → reduced resource availability or performance of local endemic/native species → spread and community impact.

Compare light interception, cover or growth of local plants in plots with and without dense Mikania; greater vine resource capture provides evidence for its competitive advantage.

Non-native does not automatically mean invasive. Spread and harm must be demonstrated, and resource competition must be separated from other mechanisms such as predation or disease.

Endemic vs. invasive species

Assessment in practice

2–3 marks
How it is assessed

This objective is assessed through essay response, commonly using State / Discuss / Suggest.

Command terms

State / Discuss / Suggest / Identify / Outline / Describe / Explain / Evaluate / Define / Analyse

What earns marks

Build the answer around this relationship: Endemic versus invasive species must be linked to the correct ecological unit, method or species interaction.

Watch for

Naming an alien species without explaining competition, predation, disease or biodiversity impact.

Representative question

Question 1

[Maximum number: 6]

Discuss, giving an example, the possible effects of the introduction of an alien species into an ecosystem.

Competition tests need a manipulated comparison

Interspecific competition is indicated—but not proved—when one species performs better in the absence of another.

Approach What is compared Strength/limit
Laboratory experiment Species alone versus together under controlled conditions Strong control but artificial setting
Field observation with random sampling Abundance or performance where species co-occur versus do not Realistic but confounding variables remain
Field removal manipulation Remove one species from random plots and compare with control plots Stronger causal evidence but disturbance may have side effects

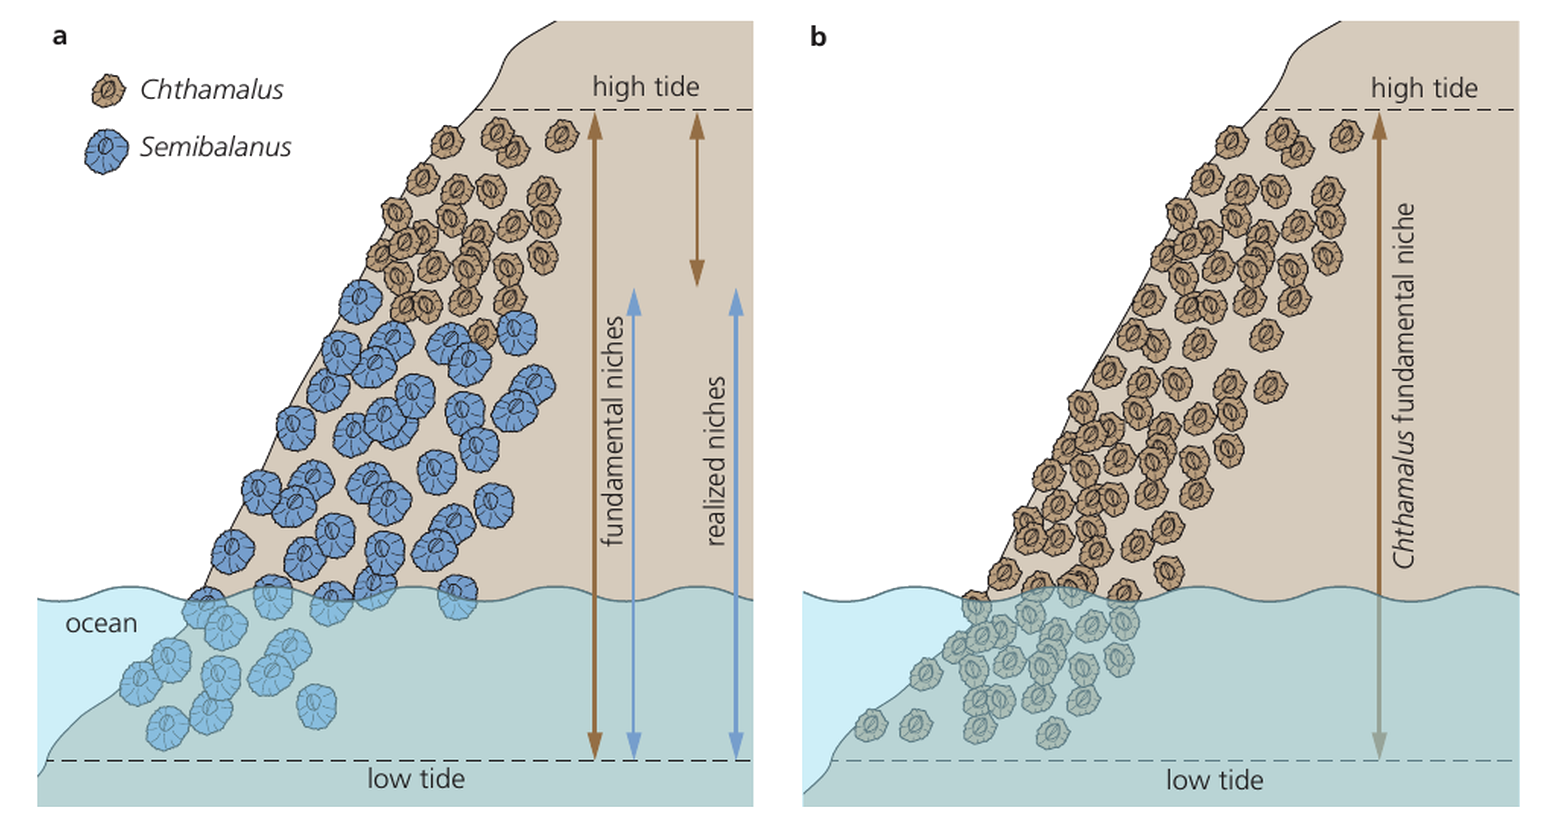
In a barnacle removal study, greater occupation of lower shore by one species after its competitor is removed supports competition as the restriction on its realized distribution.

Experiments manipulate a variable; observations do not. Better performance without a second species is evidence for competition, but alternative environmental differences must still be excluded.

Tests for interspecific competition

Assessment in practice

1–3 marks
How it is assessed

This objective is assessed through structured response, commonly using Outline / Suggest / Explain.

Command terms

Outline / Suggest / Explain / State / Predict

What earns marks

Build the answer around this relationship: Tests for interspecific competition must be linked to the correct ecological unit, method or species interaction.

Watch for

Describing overlapping niches without explaining that one competitor is displaced or restricted.

Representative question

Question 1

[Maximum number: 3]

Explain the results shown in this experiment.

Chi-squared tests compare observed and expected counts

A chi-squared test can test whether presence or absence of species A is associated with presence or absence of species B across several sampling sites.

Build a 2 × 2 table: both present, A only, B only, neither. Null hypothesis: the species' distributions are independent. Calculate each expected count as (row total × column total) ÷ grand total.

χ2=Σ((observedexpected)2÷expected);degreesoffreedom=(rows1)(columns1)=1fora2×2table.χ² = Σ((observed − expected)² ÷ expected); degrees of freedom = (rows − 1)(columns − 1) = 1 for a 2 × 2 table.

Compare calculated χ² with the chosen critical value or p-value. A significant result rejects independence and supports an association between distributions.

Association does not prove interspecific competition: both species may respond to the same abiotic factor, or association may reflect another interaction. Sampling sites must be independent and expected counts suitable for the test.

Chi-squared test

Assessment in practice

1 marks
How it is assessed

This objective is assessed through structured response, commonly using Identify / Outline / Determine.

Command terms

Identify / Outline / Determine / Explain / Calculate / State

What earns marks

Build the answer around this relationship: Chi-squared test must be linked to the correct ecological unit, method or species interaction.

Watch for

Using non-random sampling when the estimate requires representative quadrat positions.

Representative question

Question 1

[Maximum number: 3]

Outline how chi-squared can be used to test for an association between the distributions of the two species.

Predator and prey numbers can oscillate

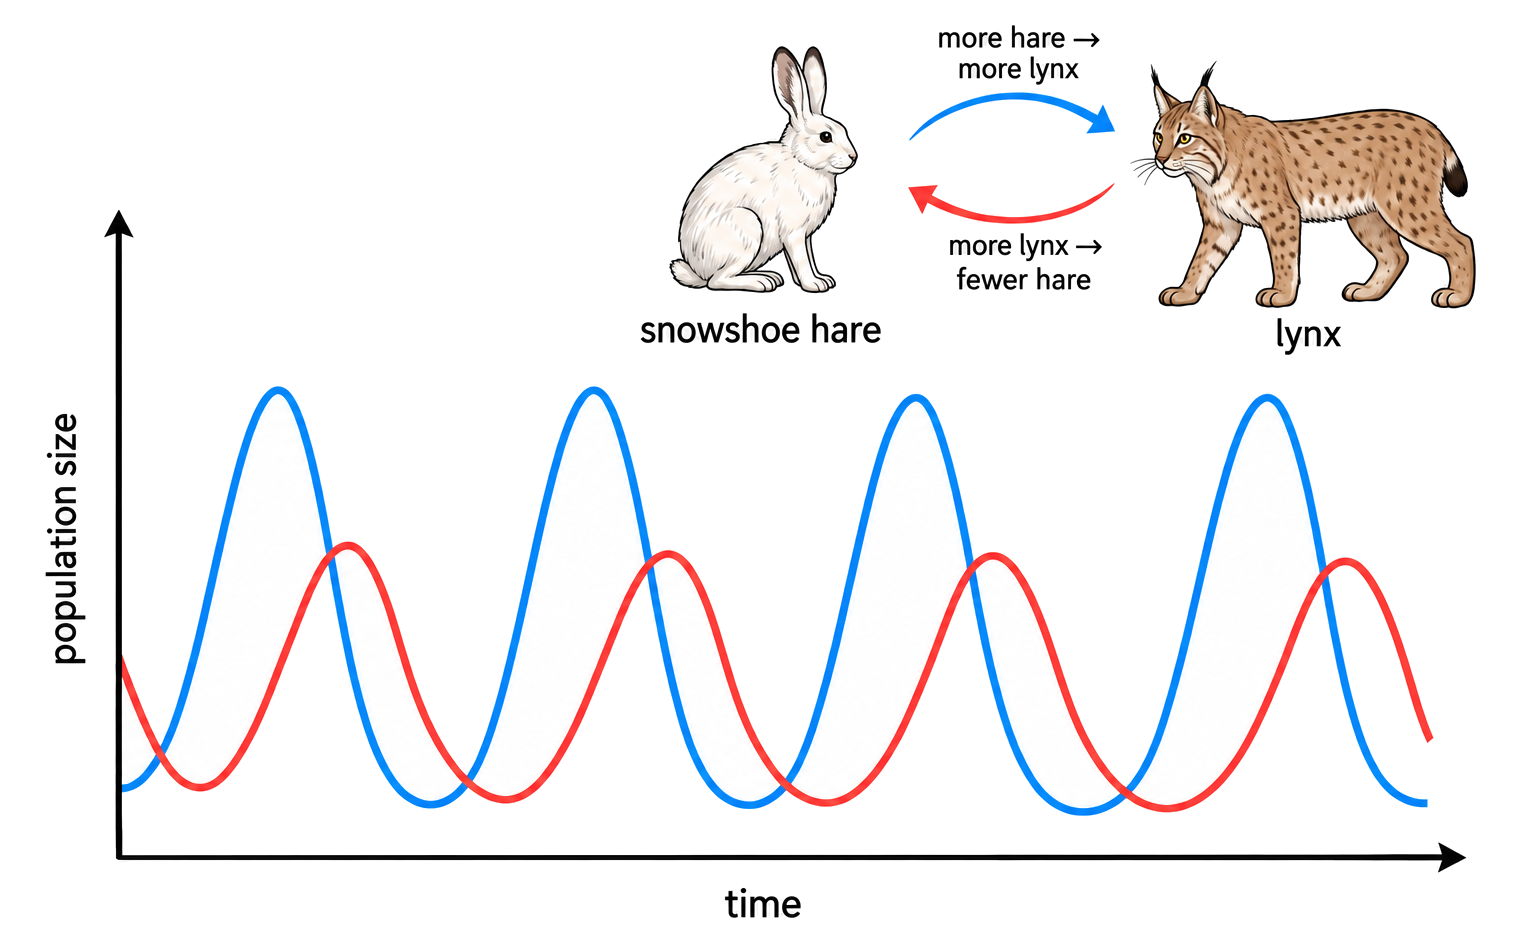
Predator–prey interactions can regulate both animal populations through density-dependent feedback, often producing time-lagged cycles.

More prey support predator survival and reproduction, so predator numbers rise later. Increased predation then lowers prey numbers; food shortage subsequently lowers predator numbers, allowing prey recovery.

Long-term snowshoe hare and Canada lynx records show repeated abundance cycles in which lynx peaks generally follow hare peaks, consistent with the delayed predator response.

Trace hare increase → more food for lynx → delayed lynx increase → higher hare mortality → hare decline → lynx decline from reduced food.

A lagged correlation supports but does not alone prove a predator-driven cycle. Food supply, disease, climate and sampling methods can also influence both populations.

Predator-prey relationships

Assessment in practice

2 marks
How it is assessed

This objective is assessed through structured response, commonly using Identify / Compare / Describe.

Command terms

Identify / Compare / Describe / Predict / Explain / Contrast / Suggest / Determine

What earns marks

Build the answer around this relationship: Predator-prey relationships must be linked to the correct ecological unit, method or species interaction.

Watch for

Confusing a population with a community or with all organisms in an ecosystem.

Representative question

Question 1

[Maximum number: 3]

Describe the effect of removing trout on frog density in Upper and Lower LeConte Lakes.

Top-down and bottom-up control start at different levels

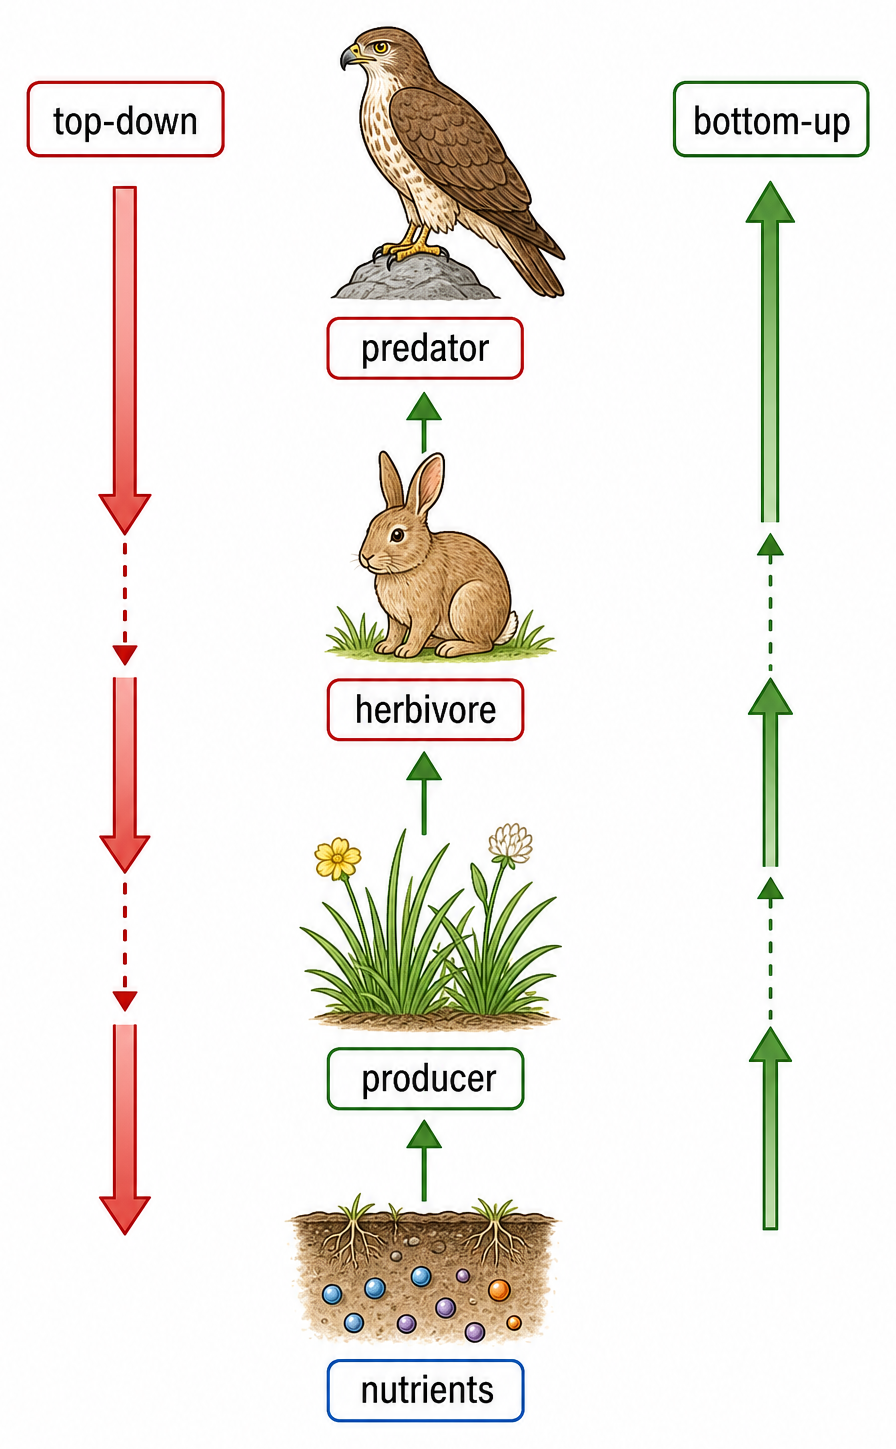
Top-down control begins with consumers at higher trophic levels; bottom-up control begins with resource supply or primary producers at lower levels.
Top-down effects cascade downward when predators alter herbivores and therefore plants. Bottom-up effects propagate upward when nutrients or primary production limit herbivores and predators.

Removing a top predator can release herbivores and reduce plant biomass; low nitrogen can independently limit plant production and therefore all higher levels.
Both pathways can operate in one community, but evidence often shows one is dominant in a particular place and time. Identify the direction and trace effects through trophic levels rather than assuming universal control.

Top-down vs. bottom-up control
Assessment in practice

1–3 marks
How it is assessed

This objective is assessed through structured response, commonly using Explain / Describe / Identify.
Command terms

Explain / Describe / Identify / Outline

What earns marks

Build the answer around this relationship: Top-down versus bottom-up control must be linked to the correct ecological unit, method or species interaction.

Watch for

Confusing a population with a community or with all organisms in an ecosystem.

Representative question

Question 1

[Maximum number: 3]

Explain how nutrients can have a positive or negative bottom-up effect on seagrass.

Allelopathy and antibiotics are chemical interference

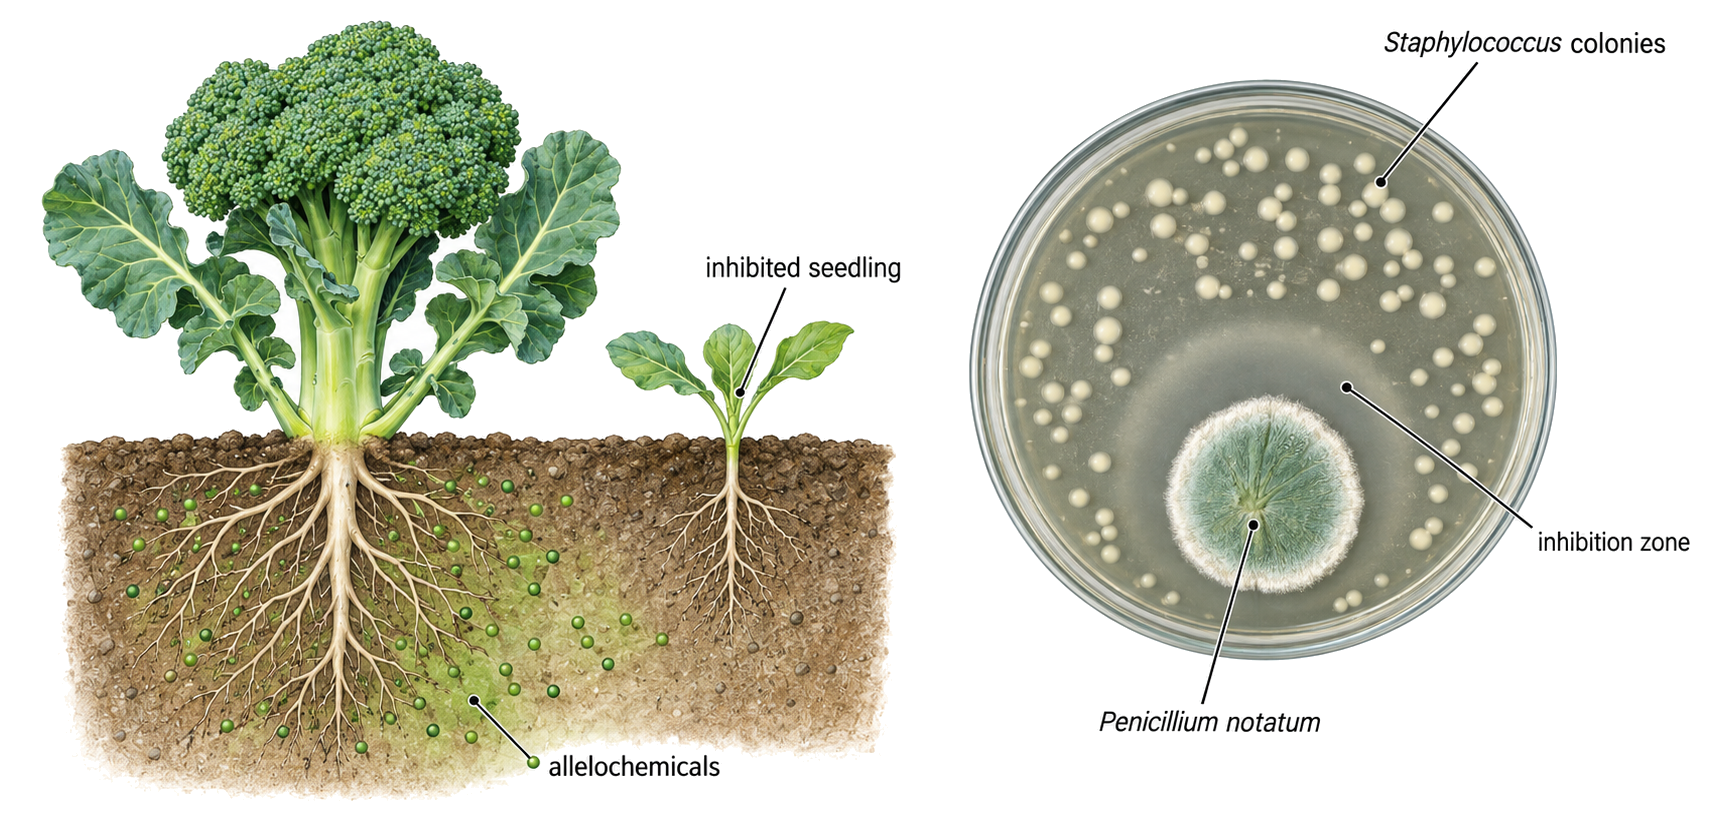
Allelopathy and antibiotic secretion both release chemicals into the environment that deter potential competitors.

Process Specific example Producer and target effect
Allelopathy Juglone released by black walnut Inhibits germination or growth of susceptible neighbouring plants
Antibiotic secretion Penicillin from Penicillium fungus Inhibits susceptible bacteria competing in the same environment

The ecological outcome depends on chemical concentration, transport, breakdown and target susceptibility; secretion can improve the producer's access to space or resources.

A laboratory inhibition zone shows chemical activity but does not by itself prove an ecologically important field concentration. Antibiotic secretion here is competition between organisms, not clinical prescribing.

Allelopathy and antibiotics

Assessment in practice

1–3 marks
How it is assessed

This objective is assessed through structured response, commonly using Explain / Identify.

Command terms

Explain / Identify

What earns marks

Build the answer around this relationship: Allelopathy and antibiotics must be linked to the correct ecological unit, method or species interaction.

Watch for

Including abiotic factors in the definition of community instead of reserving them for ecosystem.

Representative question

Question 1

[Maximum number: 3]

Explain how a named plant can reduce competition by allelopathy.

Populations and Communities

  • A population is one species in an area; a community is all interacting populations there.
  • Estimate abundance with unbiased sampling: quadrats for sessile organisms and capture–mark–release–recapture for mobile animals, checking each method’s assumptions.
  • Density-dependent competition, predation, disease and waste create negative feedback around carrying capacity; exponential growth slows into a sigmoid curve as limits strengthen.
  • Classify interspecific relationships by costs and benefits: predation, herbivory, competition, mutualism, parasitism and pathogenicity.
  • Invasive species may escape controls and displace endemic species. Removal experiments can reveal competition and fundamental versus realized niches.
  • Chi-squared tests assess species association from observed and expected quadrat counts.
  • Predator peaks usually lag prey peaks; top-down control begins with consumers, while bottom-up control begins with resources or producers.

Objective notes

18 learning objectives
C4.1.1Populations• A population is interacting organisms of the same species in one area• Members have opportunities to interbreed and may be reproductively isolated from others4% of analysed papers 5 papers · 5 questionsViewC4.1.2Population size estimation• Population size is estimated when full counts are impractical• Random sampling reduces bias; stratified and systematic sampling fit different habitats3% of analysed papers 4 papers · 4 questionsViewC4.1.3Random quadrat sampling• Quadrats estimate density, frequency, cover, or abundance of sessile organisms• Random coordinates and known quadrat area support representative population estimates2% of analysed papers 3 papers · 3 questionsViewC4.1.4Capture-mark-release-recapture• Capture-mark-release-recapture estimates motile animal populations• Lincoln index assumes marks persist, mixing occurs, and marking does not affect survival1% of analysed papers 2 papers · 2 questionsViewC4.1.5Carrying capacity• Carrying capacity is the maximum population an environment can sustain• Limited food, space, mates, and other resources create competition near capacity2% of analysed papers 3 papers · 3 questionsViewC4.1.6Negative feedback control• Density-dependent factors regulate populations by negative feedback• Competition, predation, waste, and disease intensify as population density rises1% of analysed papers 2 papers · 2 questionsViewC4.1.7Population growth curves• Exponential growth occurs when resources are abundant and limiting factors are weak• Sigmoid growth slows as resources limit growth near carrying capacity4% of analysed papers 6 papers · 7 questionsViewC4.1.8Modelling sigmoid growth• Sigmoid curves can be modelled with yeast, duckweed, or other fast-growing organisms• Lag, exponential, transition, and plateau phases show changing growth rate0% of analysed papers ViewC4.1.9Competition vs. cooperation• Intraspecific competition occurs for food, mates, space, or light• Cooperation such as social hunting or parental care can increase survival and reproduction1% of analysed papers 1 paper · 5 questionsViewC4.1.10Community• A community is all interacting populations in an ecosystem• Species interactions make populations interdependent within the abiotic environment7% of analysed papers 10 papers · 13 questionsViewC4.1.11Interspecific relationships• Interspecific relationships occur between different species in communities• Categories include herbivory, predation, competition, mutualism, parasitism, and pathogenicity6% of analysed papers 9 papers · 11 questionsViewC4.1.12Mutualism as interspecific relationship• Mutualism benefits both species through exchanged resources or protection• Examples include legumes and Rhizobium, orchids and mycorrhizae, corals and zooxanthellae4% of analysed papers 6 papers · 9 questionsViewC4.1.13Endemic vs. invasive species• Endemic species are native to a restricted geographic area• Invasive species can escape controls and compete with endemic species for niche resources13% of analysed papers 18 papers · 25 questionsViewC4.1.14Tests for interspecific competition• Competition is tested using lab experiments, field observations, or removal studies• Connell's barnacle study links removal experiments to fundamental and realized niches2% of analysed papers 3 papers · 3 questionsViewC4.1.15Chi-squared test• Chi-squared tests association between two species from quadrat presence/absence data• Compare observed and expected counts, degrees of freedom, and critical values3% of analysed papers 4 papers · 4 questionsViewC4.1.16Predator-prey relationships• Predator-prey relationships regulate populations through density-dependent feedback• Snowshoe hare and lynx cycles show time-lagged predator and prey changes2% of analysed papers 3 papers · 5 questionsViewC4.1.17Top-down vs. bottom-up control• Top-down control begins with predators and cascades to lower trophic levels• Bottom-up control begins with producers or resources and affects higher trophic levels0% of analysed papers ViewC4.1.18Allelopathy and antibiotics• Allelopathy releases chemicals that inhibit competitor germination or growth• Antibiotics are microbial allelochemicals, such as penicillin from Penicillium1% of analysed papers 1 paper · 1 questionView