C4.2.10—Trophic levels

Trophic levels explains how energy flow, matter cycling, trophic transfer or carbon movement is represented, measured or limited within ecosystems.
Syllabus
First assessment 2025
Objective
C4.2.10
Level
SL

Exam analysis

Chance of appearing16%of analysed past papers
Latest appearanceNovember 2025
Most common paperPaper1
Typical marks1

Common command terms

  • Identify
  • Explain
  • Discuss
  • Deduce
  • Describe
  • State
  • Distinguish
  • Suggest

Scoring notes

Common mistake
Reversing food-web arrows instead of showing energy transfer direction.
Recent exam appearances

November 2025Paper1A ["SL"] · TZ328[ 1 ]C4.2.10—Trophic levels
November 2025Paper1A ["SL"] · TZ127[ 1 ]C4.2.10—Trophic levels
May 2025Paper2 ["SL"] · TZ35(b)(i)[ 1 ]C4.2.10—Trophic levels
May 2025Paper1A ["SL"] · TZ328[ 1 ]C4.2.10—Trophic levels
November 2024Paper2 ["SL"] · TZ23(a)[ 1 ]C4.2.10—Trophic levels
Practice this objective

Coverage 2010–2025 · Updated 16 Jul 2026

Trophic levels describe feeding position

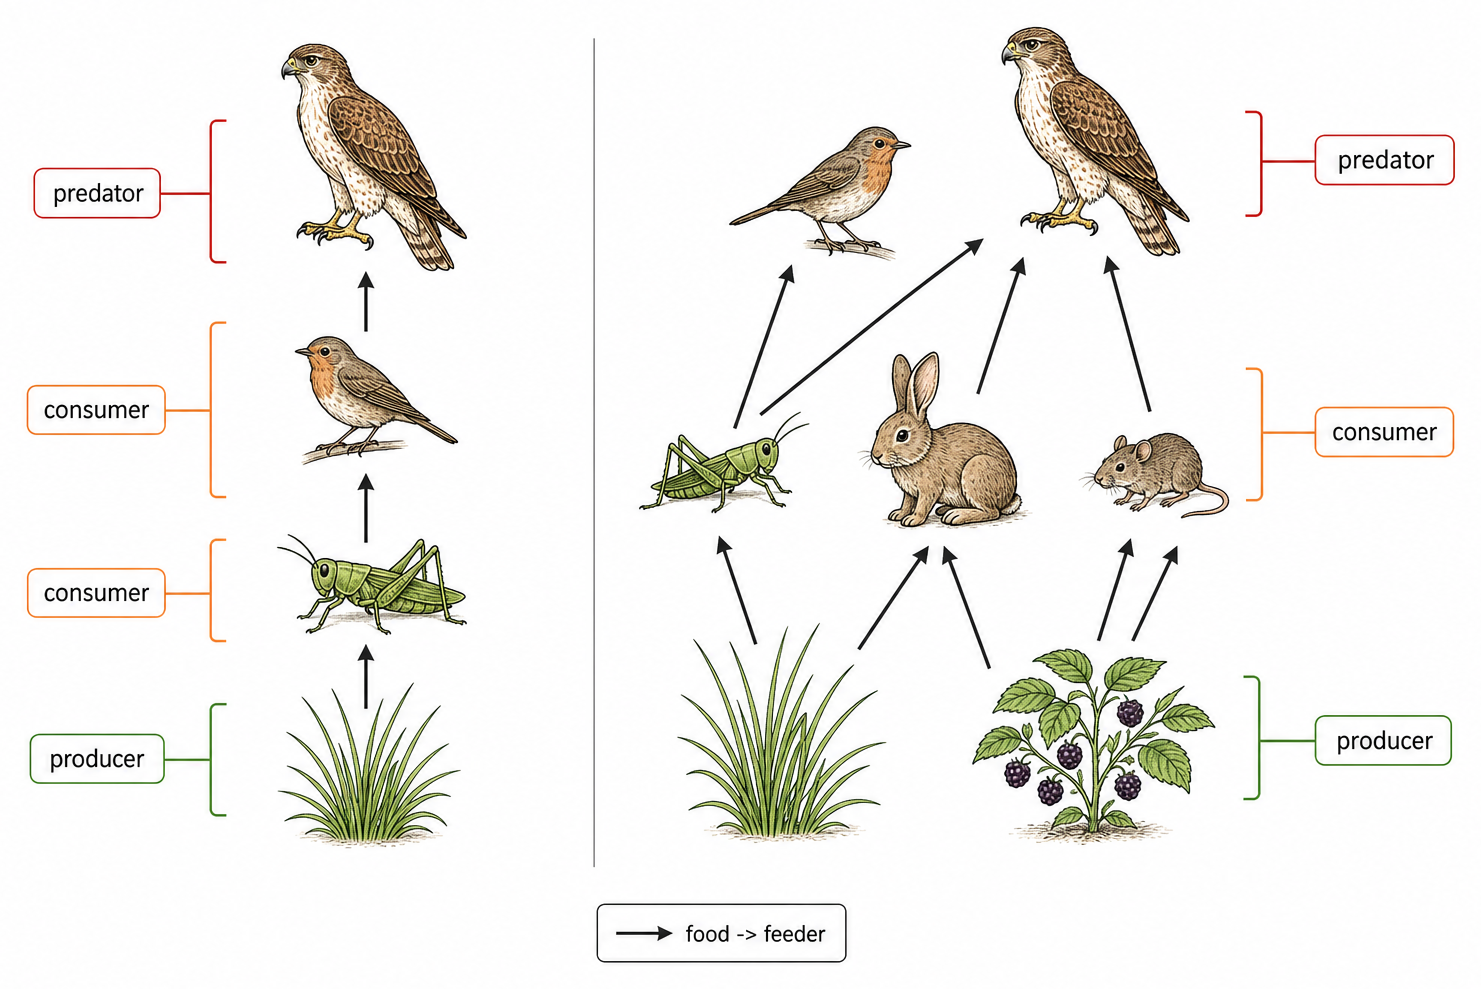
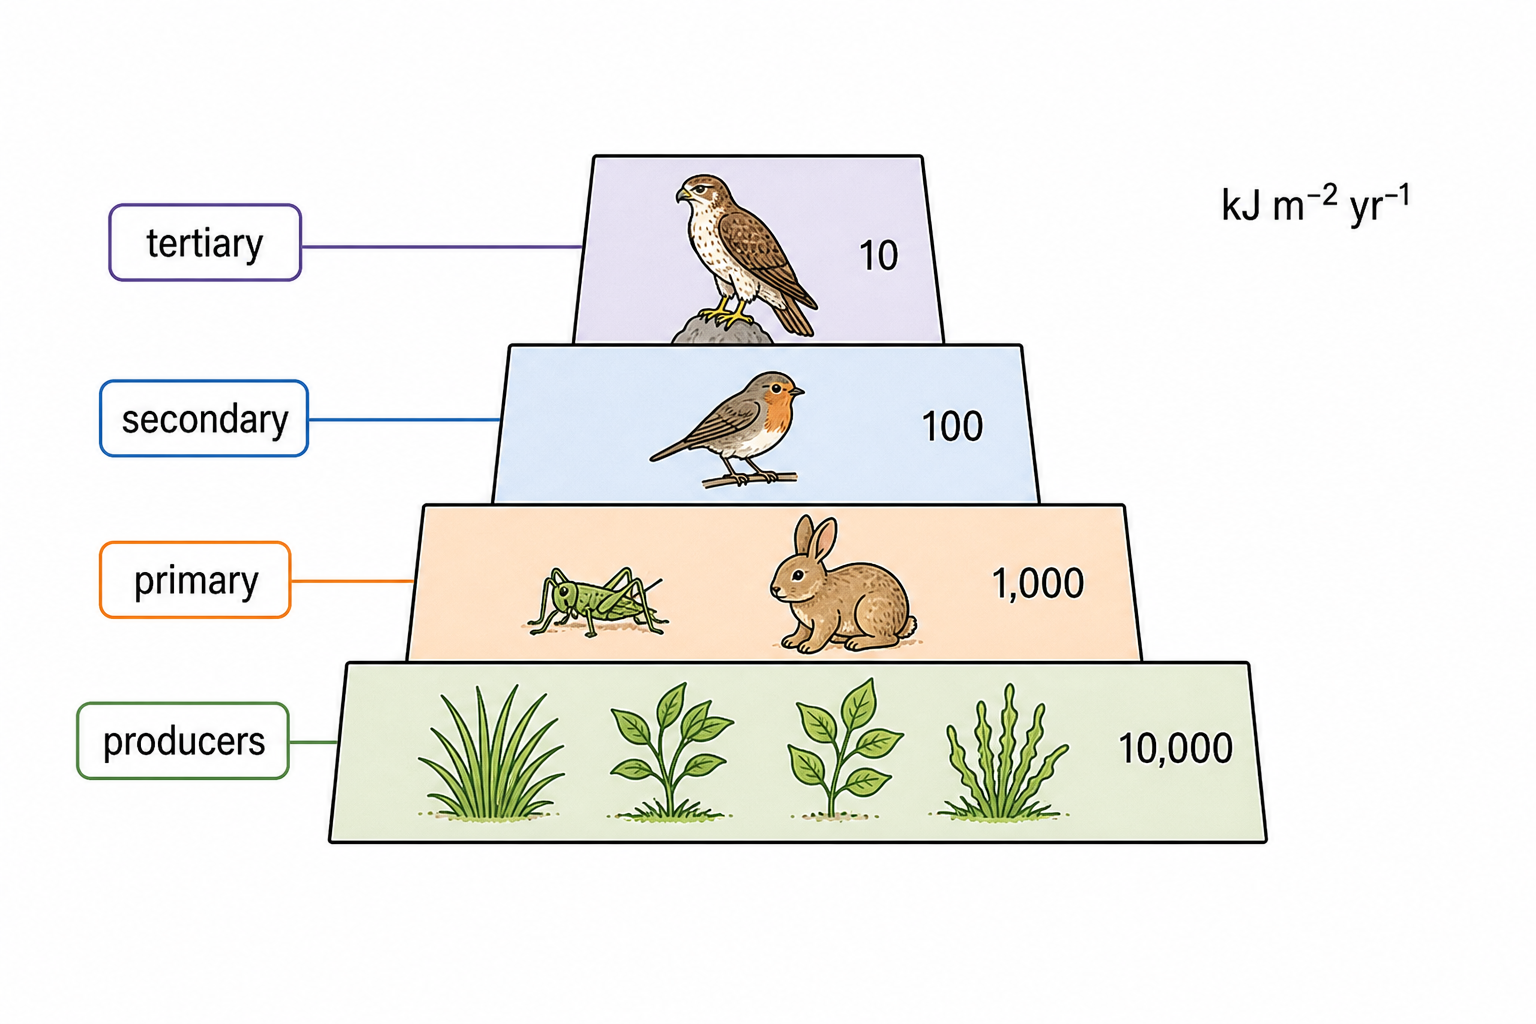
A trophic level classifies an organism by its feeding position in a particular food chain.

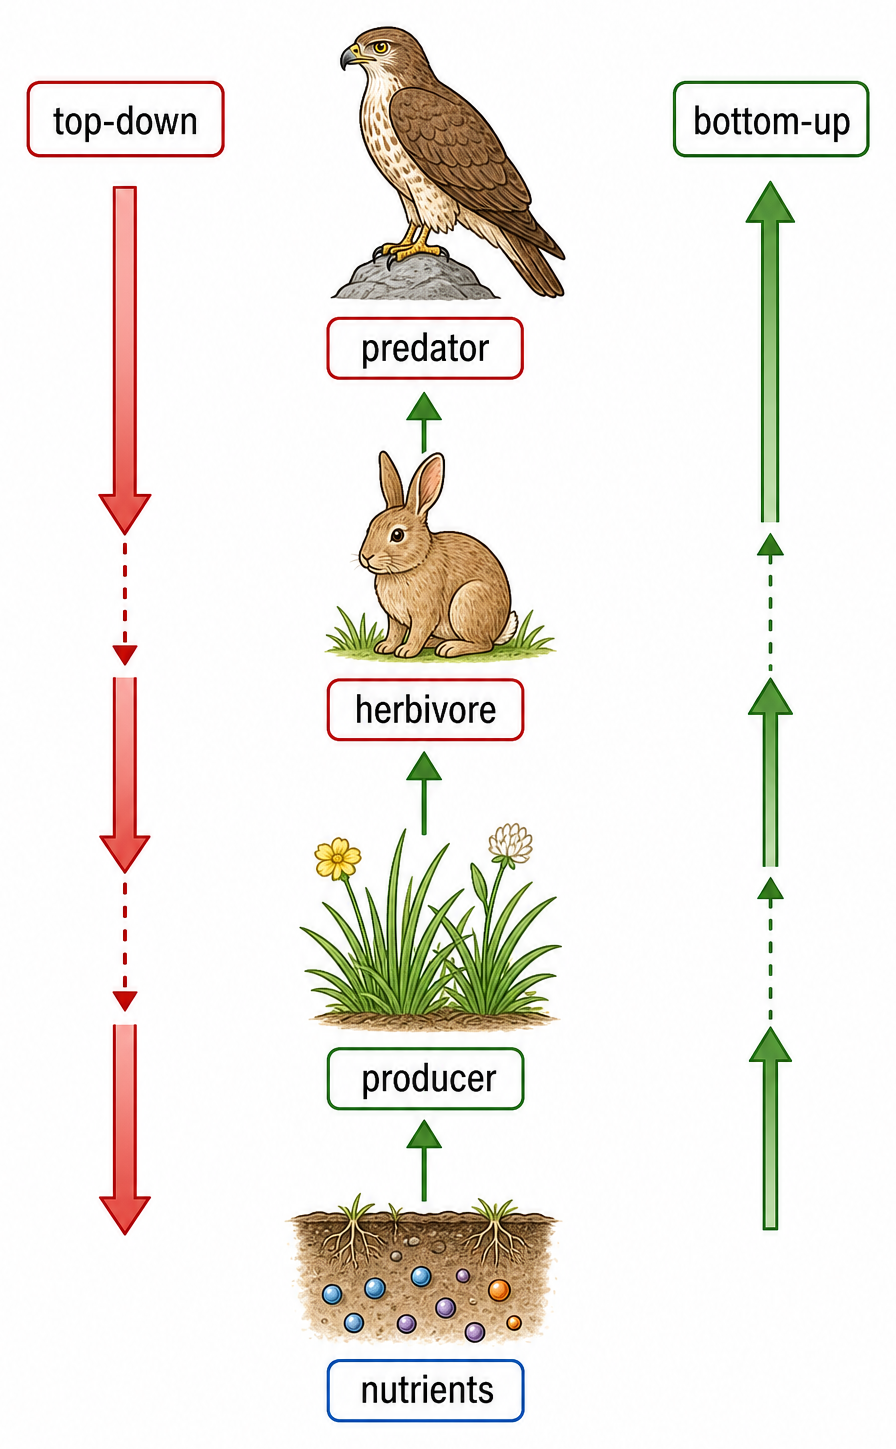
Trophic level Role Example in grass → grasshopper → frog → snake
Producer Synthesizes organic carbon from inorganic sources Grass
Primary consumer Feeds on producer Grasshopper
Secondary consumer Feeds on primary consumer Frog
Tertiary consumer Feeds on secondary consumer Snake

An omnivorous bird may be a primary consumer when eating seeds and a secondary consumer when eating herbivorous insects, so trophic level depends on the food chain.

Trophic level is not body size, intelligence or a permanent label for a species with a varied diet.

Trophic levels

Assessment in practice

1 marks
How it is assessed

This objective is assessed through structured response, commonly using Identify / Explain / Discuss.

Command terms

Identify / Explain / Discuss / Deduce / Describe / State / Distinguish / Suggest

What earns marks

Build the answer around this relationship: Trophic levels must be linked to the correct source, store, transfer or loss process.

Watch for

Reversing food-web arrows instead of showing energy transfer direction.

Representative question

Question 1

[Maximum number: 4]

Explain, using an example of a food chain, how trophic levels can be deduced.

Energy and Matter

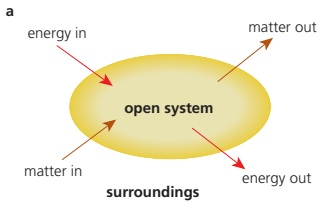
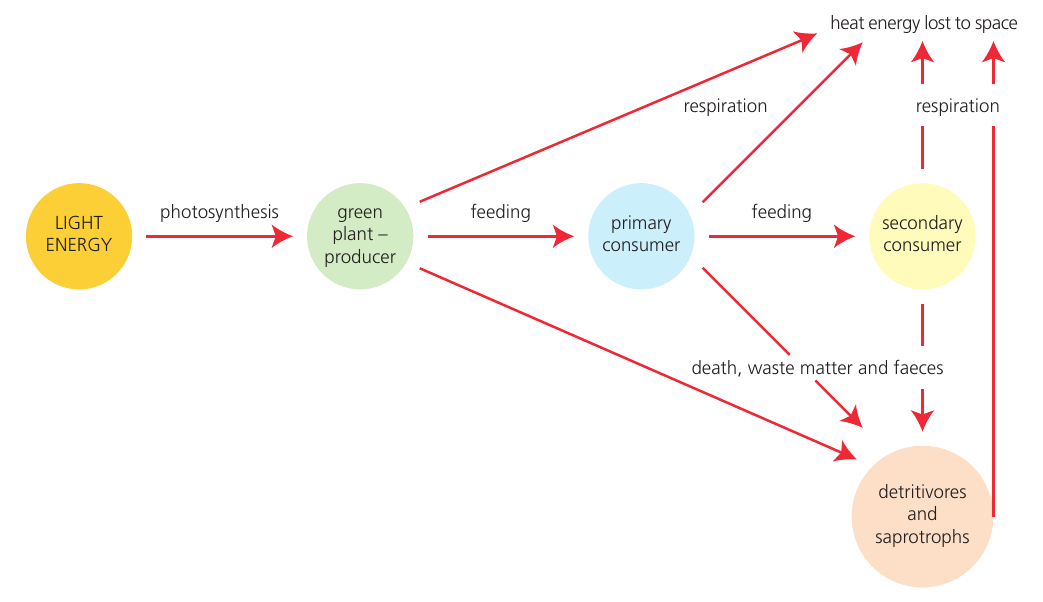
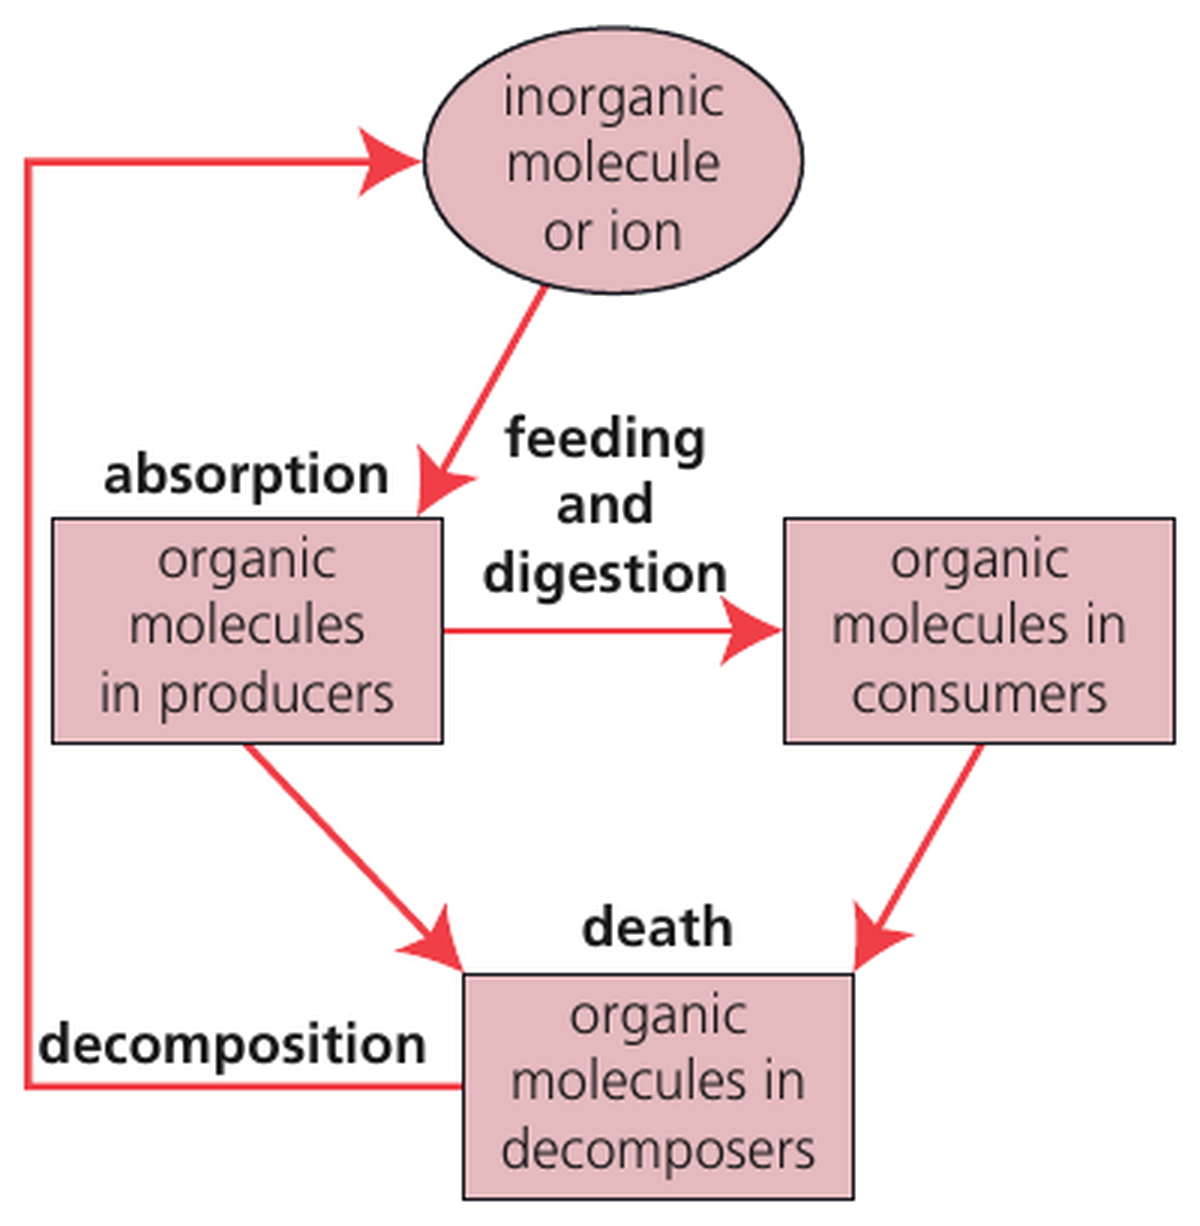
  • Ecosystems are open systems: energy flows through them and leaves as heat, while matter is recycled and may enter or leave.
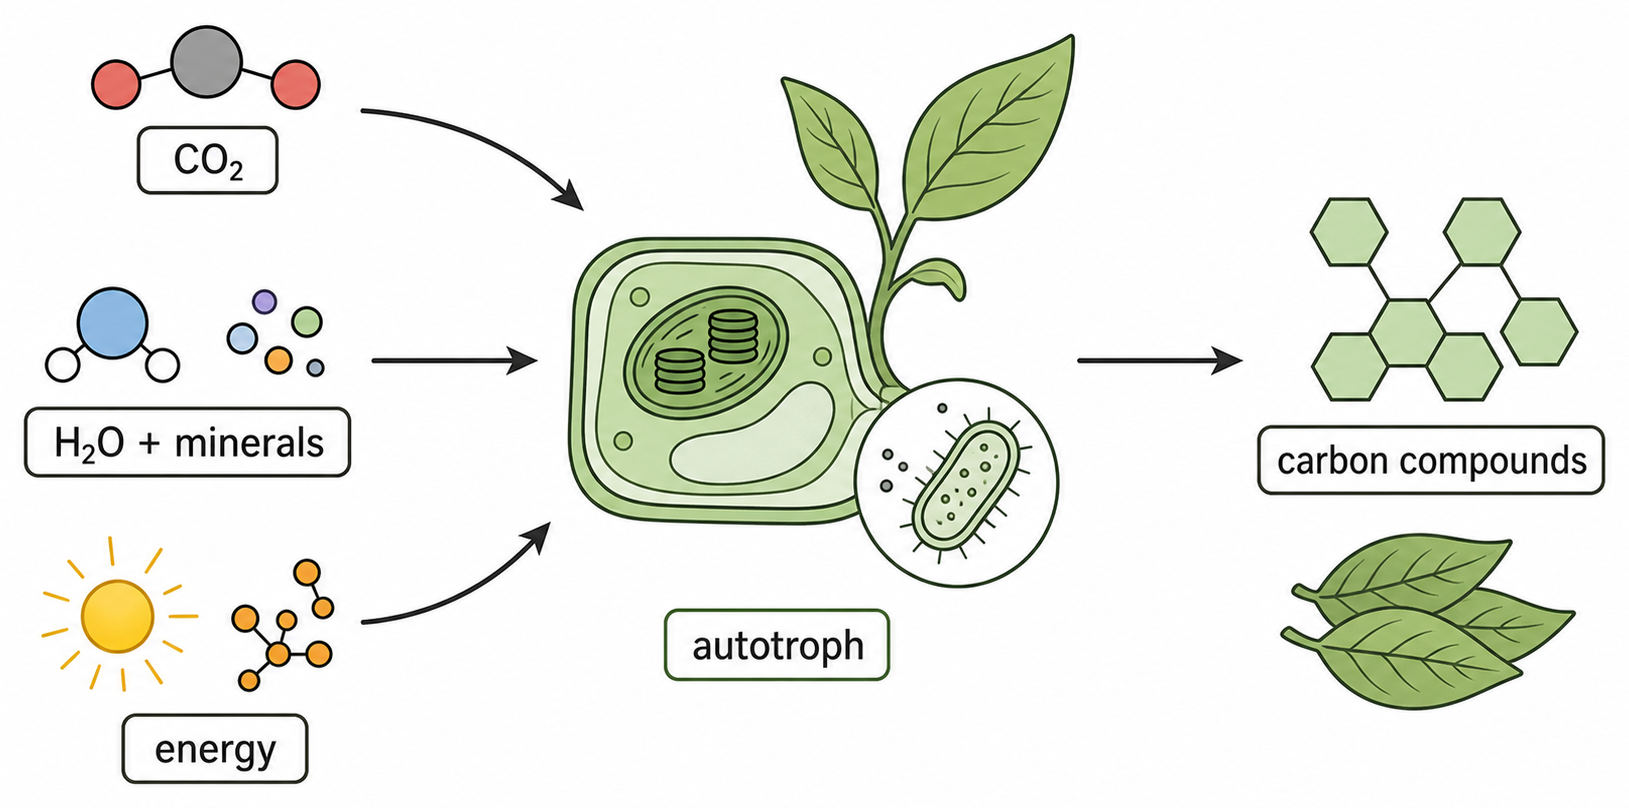
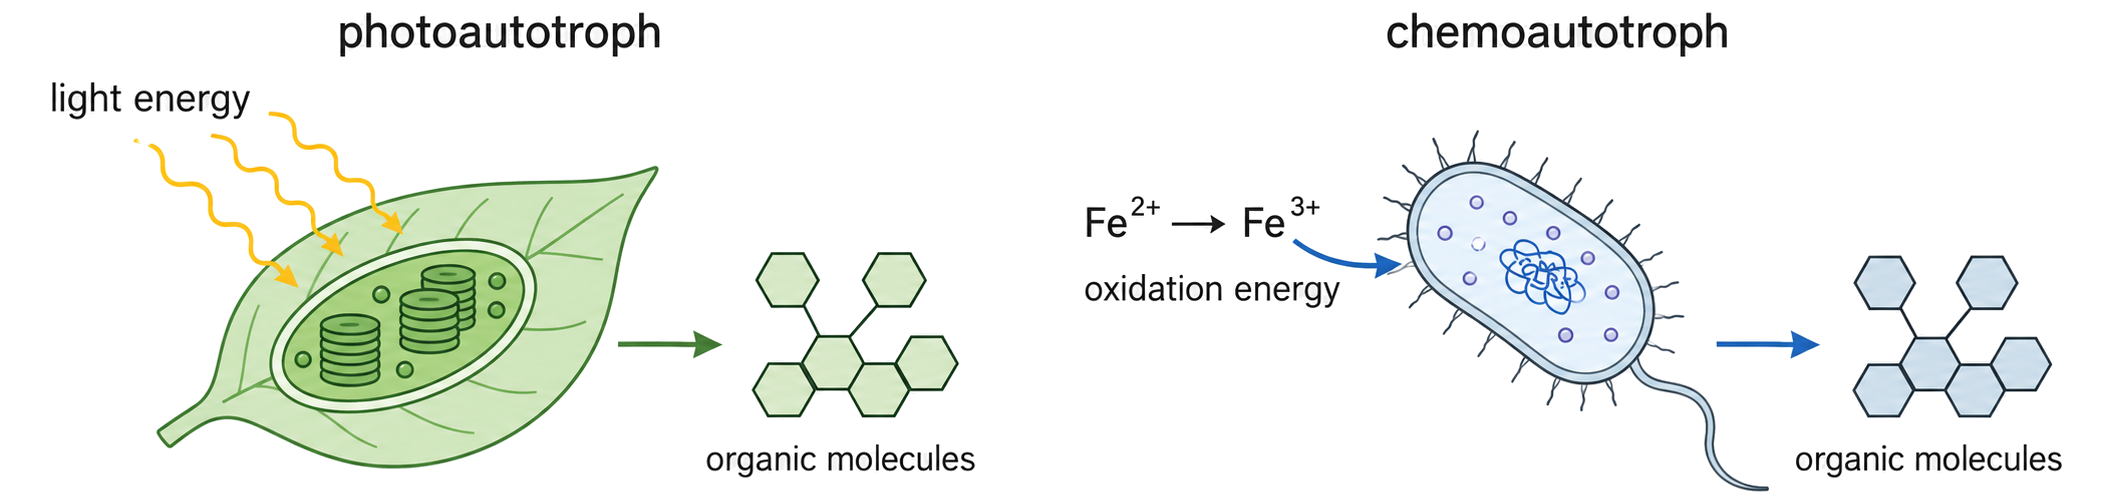
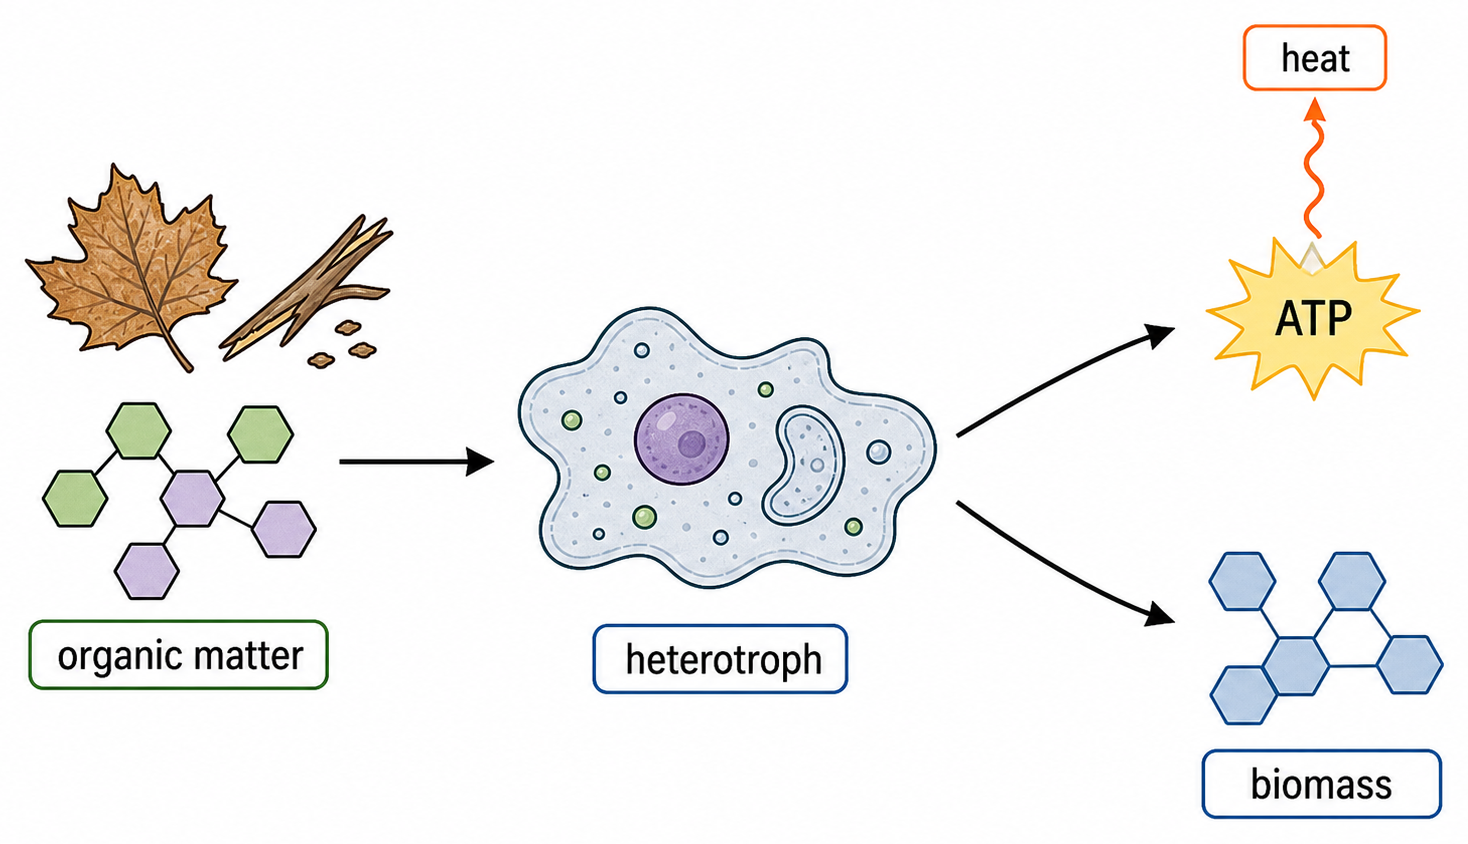
  • Photoautotrophs capture light; chemoautotrophs oxidize inorganic substances. Both build biomass from inorganic carbon. Heterotrophs obtain organic carbon from other organisms.
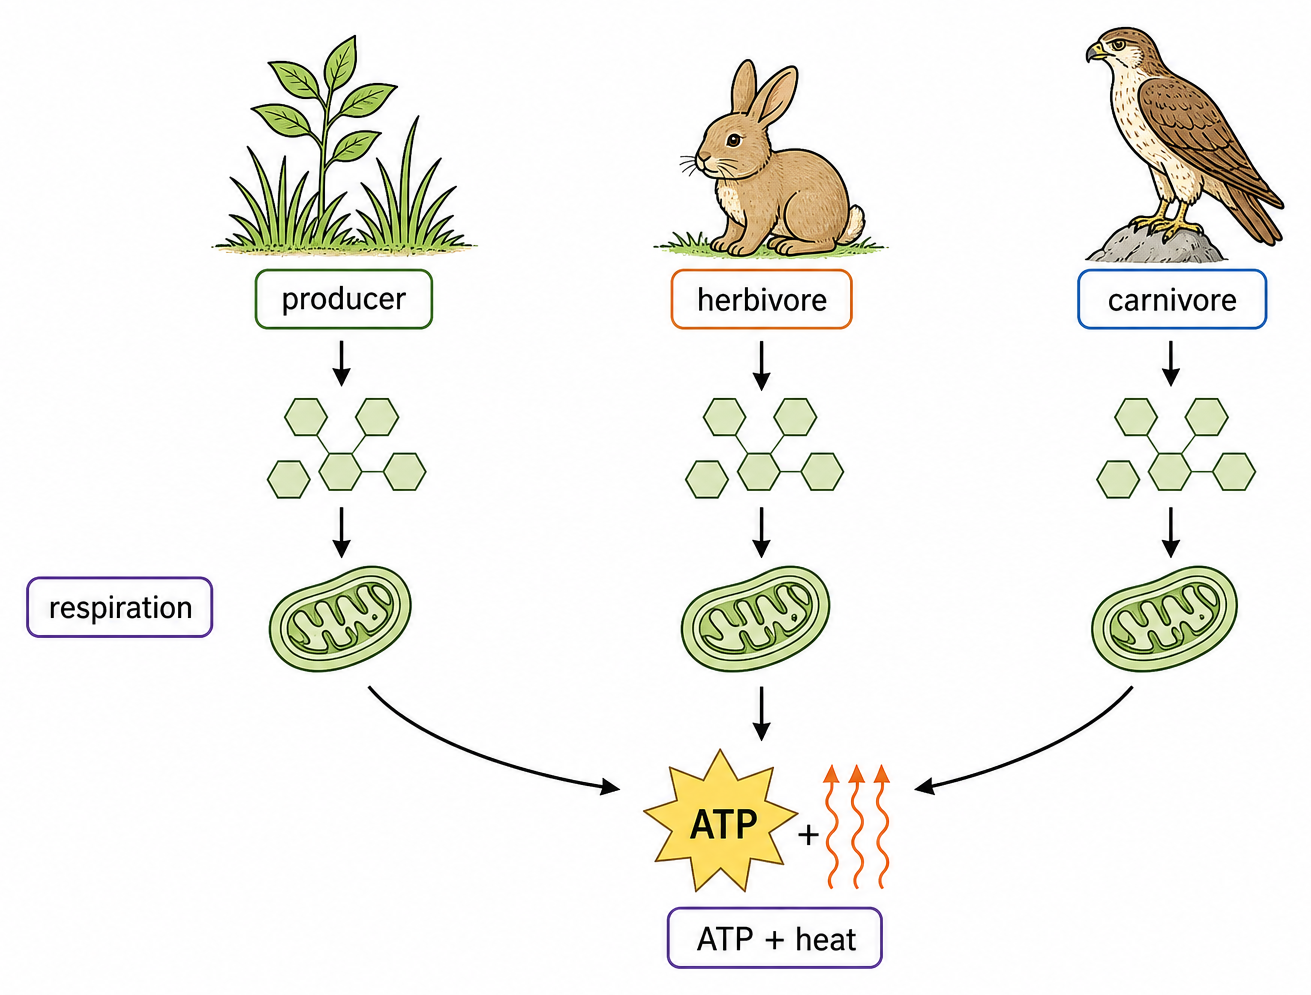
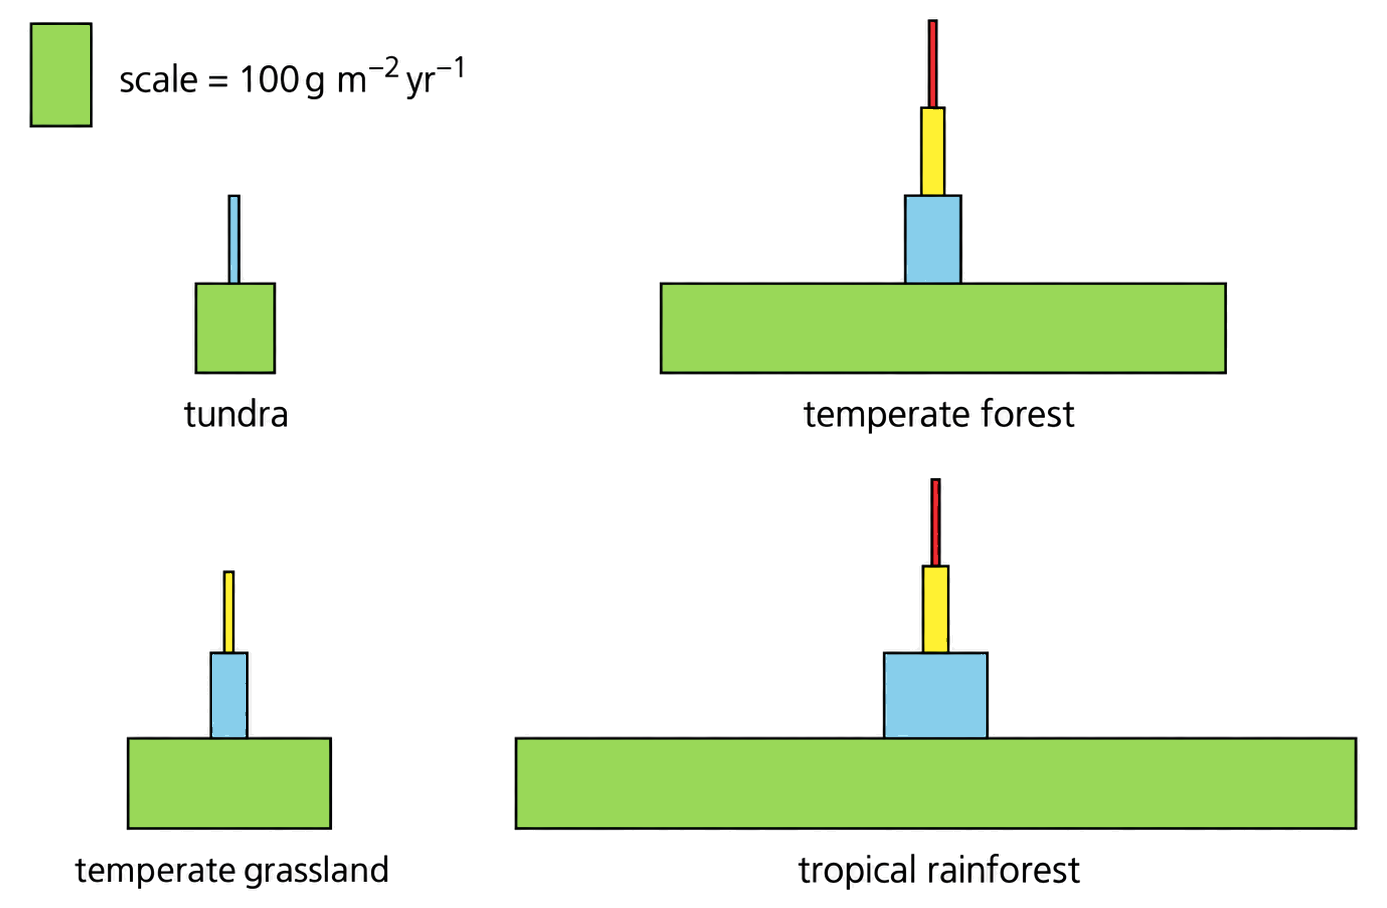
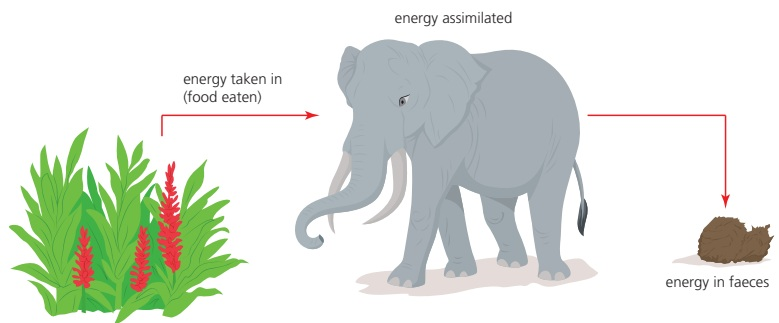
  • Food-web arrows show energy and biomass transfer. Energy decreases between trophic levels through respiration, heat, egestion, excretion and uneaten material, limiting chain length.
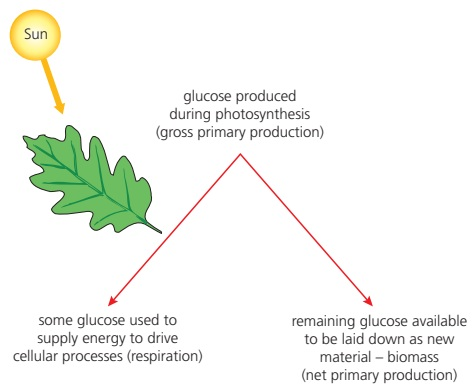
  • Gross primary production minus producer respiration gives net primary production; secondary production is heterotroph biomass gain.
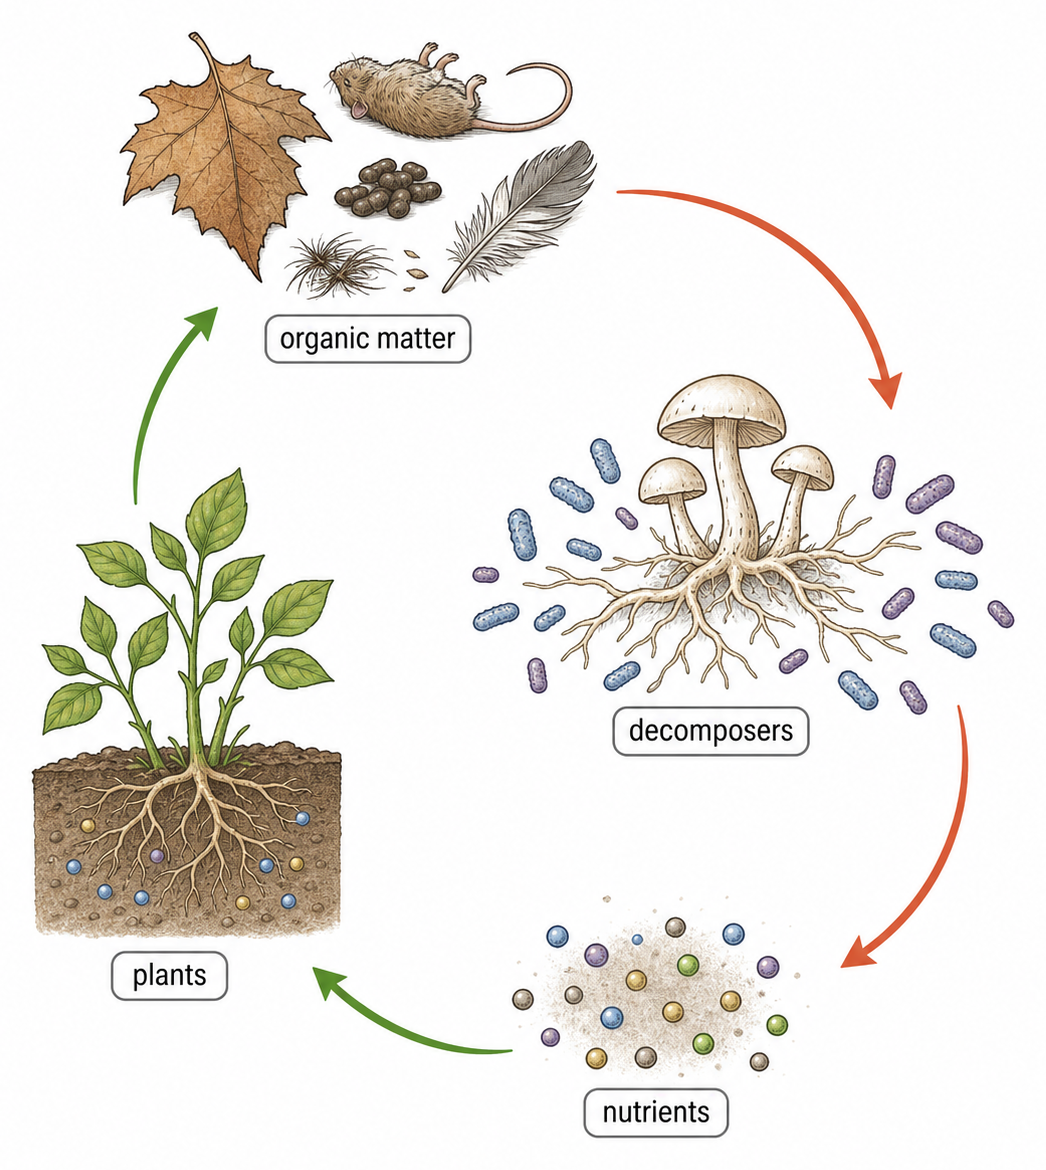
  • Decomposers obtain energy from detritus and return inorganic nutrients to producers.
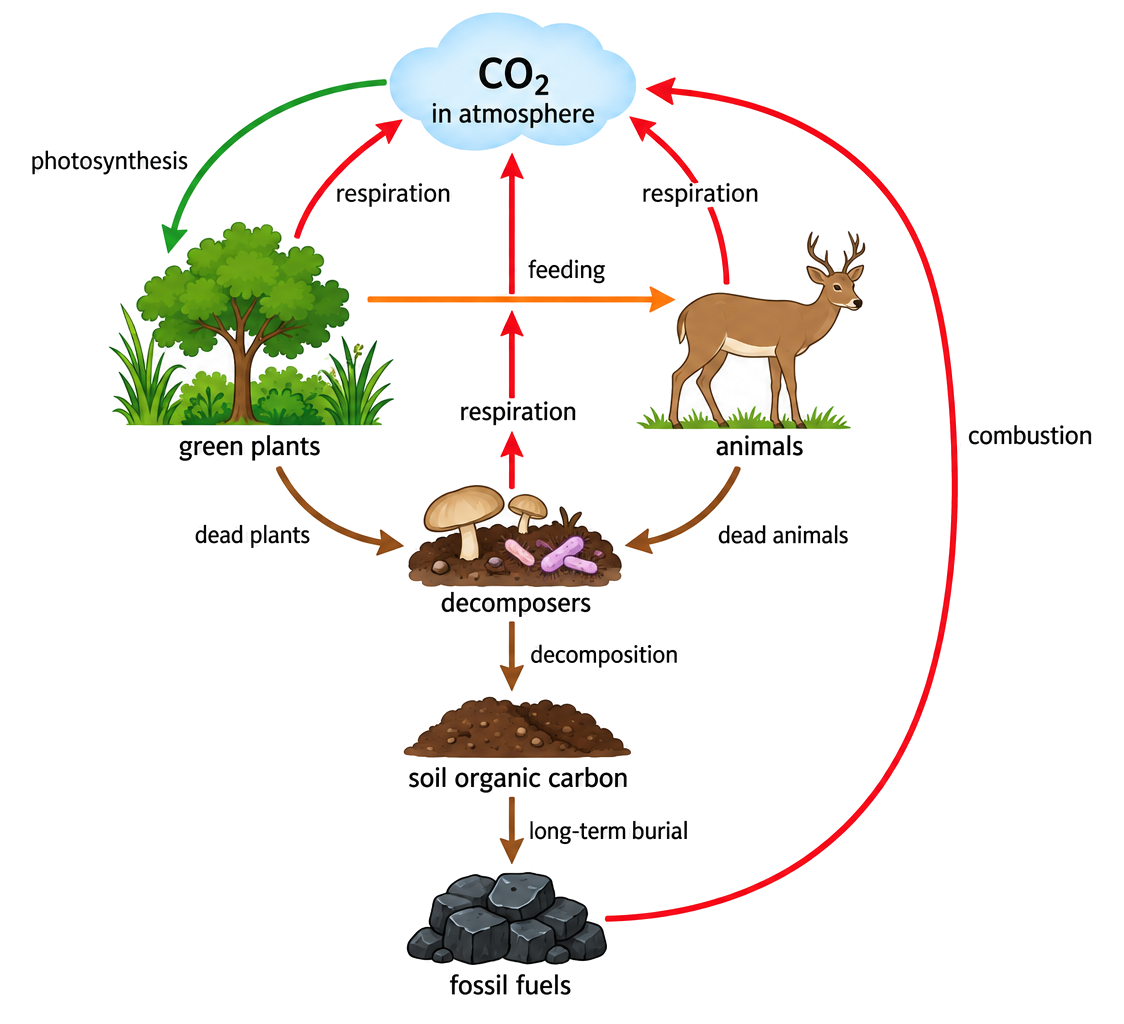
  • Carbon-cycle diagrams distinguish stores and fluxes. Photosynthesis removes CO2; respiration, decomposition and combustion release it.
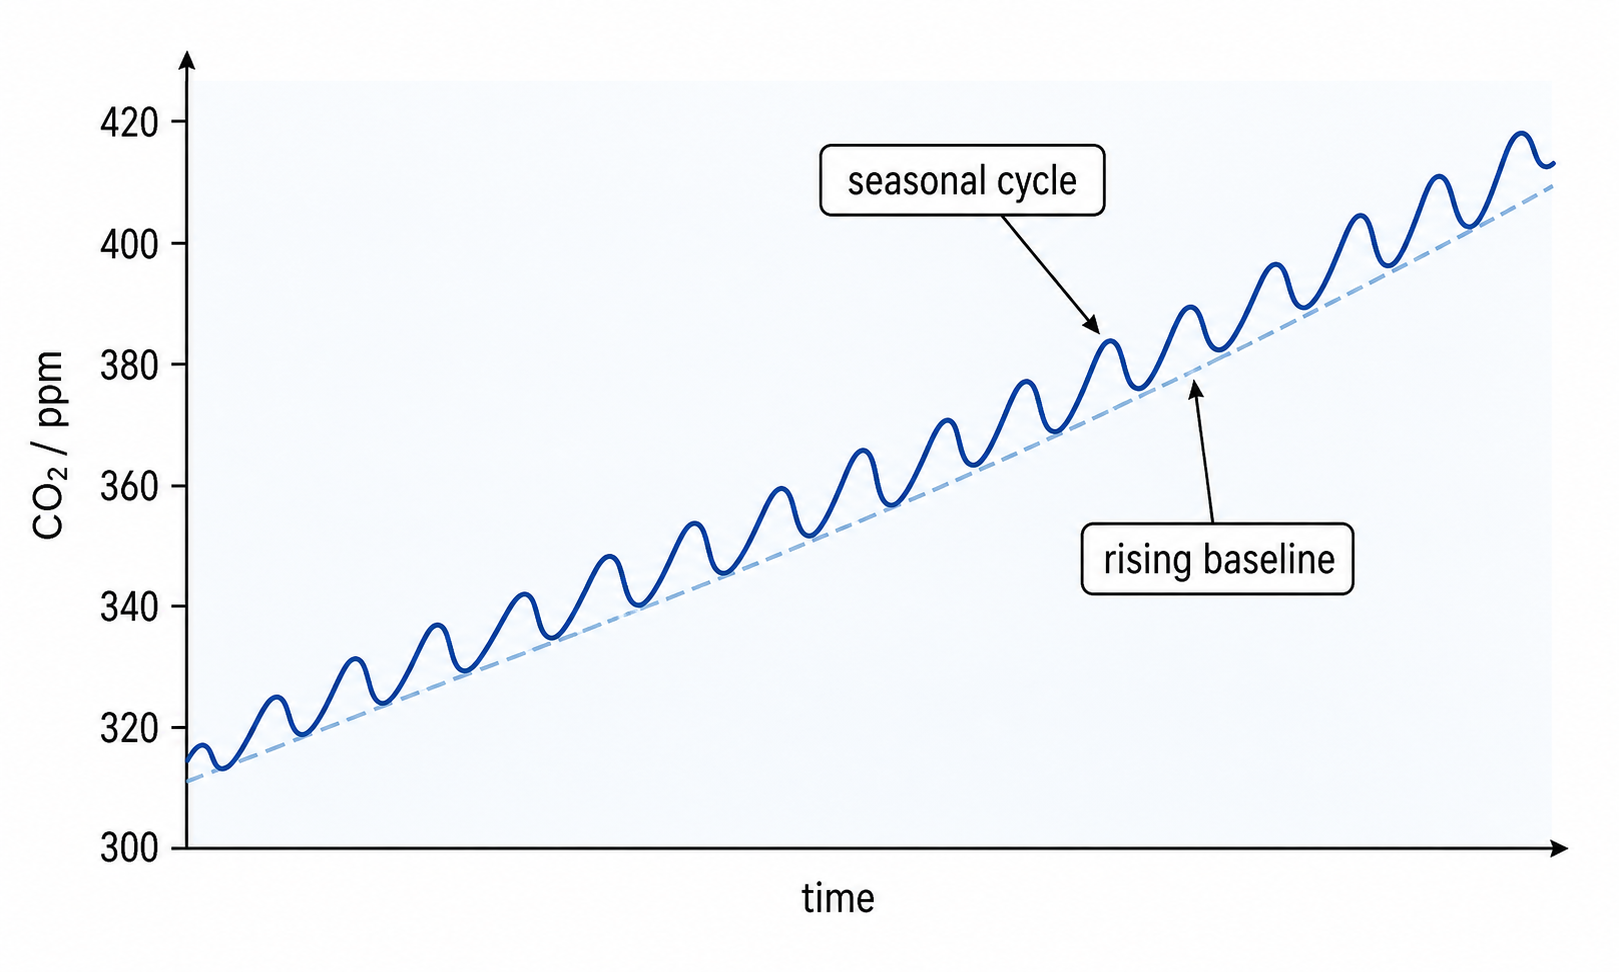
  • A sink absorbs more carbon than it releases; a source does the reverse. The Keeling Curve shows a long-term atmospheric CO2 rise with seasonal oscillation.

Concept essentials

  • Trophic levels must be linked to the correct source, store, transfer or loss process.
  • The evidence for trophic levels depends on distinguishing energy flow from matter cycling.
  • Trophic levels is clearer when arrows, units and trophic positions match the biological process.
  • Data or diagrams for trophic levels need interpretation as ecosystem transfer evidence.