C4.2 Transfers of energy and matter

Transfers of energy and matter connect sunlight, feeding, trophic levels, decomposers, heat loss and carbon cycling to ecosystem structure, function and sustainability.

Syllabus
First assessment 2025
Topic
C4.2
Level
SL

Learning objectives

C4.2.1Ecosystems as open systems• Ecosystems are open systems exchanging energy and matter with surroundings• Energy flows through ecosystems while matter can enter, leave, and recycleC4.2.2Sunlight as principal energy source• Sunlight is the principal energy source for most ecosystems• Exceptions include caves and deep-ocean vents supported by chemosynthesisC4.2.3Chemical energy flow• Chemical energy flows from producers to consumers through feeding• Energy enters as light or chemical energy and leaves ecosystems as heatC4.2.4Food chains and food webs• Food chains and food webs model feeding relationships in communities• Arrows point in the direction of energy and biomass transferC4.2.5Supply to decomposers• Decomposers obtain energy from carbon compounds in detritus• Dead organisms, faeces, fallen leaves, and shed tissues supply organic matterC4.2.6Autotrophs as self-feeders• Autotrophs synthesize carbon compounds from simple inorganic substances• They use external energy sources to fix carbon and build biomassC4.2.7Energy sources• Photoautotrophs use light captured by photosynthetic pigments• Chemoautotrophs use oxidation of inorganic substances, such as iron or sulfur compoundsC4.2.8Heterotrophs• Heterotrophs obtain carbon compounds from other organisms or organic matter• They use these compounds for respiration and synthesis of their own biomassC4.2.9Energy release• Both autotrophs and heterotrophs release energy by cell respiration• Oxidation of carbon compounds transfers energy to ATP and heatC4.2.10Trophic levels• Trophic levels classify organisms as producers, primary consumers, and higher consumers• Omnivores and decomposers may feed across more than one trophic levelC4.2.11Energy pyramids• Energy pyramids represent energy flow per unit area per unit time• Each bar shows energy available to one trophic levelC4.2.12Energy reductions• Energy availability decreases at each transfer between trophic levels• Losses occur through respiration, heat, egestion, excretion, and uneaten biomassC4.2.13Heat loss• Cell respiration converts some chemical energy to heat in all trophic levels• Heat dissipates to the environment, so energy cannot be recycledC4.2.14Restrictions on trophic levels• Large energy losses restrict food chains to a few trophic levels• Higher trophic levels usually support less biomass and fewer individualsC4.2.15Primary production• Primary production is accumulation of carbon compounds in autotroph biomass• Gross production minus respiration gives net primary productionC4.2.16Secondary production• Secondary production is biomass accumulation by heterotrophs• It depends on food intake, assimilation, respiration losses, and biomass conversionC4.2.17Carbon cycle diagrams• Carbon cycle diagrams show stores as boxes and fluxes as labelled arrows• Include CO₂, photosynthesis, feeding, respiration, decomposition, fossil fuels, and combustionC4.2.18Carbon sinks and sources• Carbon sinks absorb more carbon than they release, such as forests, soils, and oceans• Carbon sources release more carbon than they absorb, such as fossil fuel combustionC4.2.19CO₂ release during combustion• Combustion of biomass, peat, coal, oil, and natural gas releases CO₂• Draining peat and forest fires increase carbon flux to the atmosphereC4.2.20Keeling Curve analysis• The Keeling Curve records atmospheric CO₂ at Mauna Loa since the late 1950s• Long-term rise reflects combustion; annual oscillation reflects Northern Hemisphere photosynthesisC4.2.21Dependence between respiration and photosynthesis• Photosynthesis supplies atmospheric O₂ used in aerobic respiration• Respiration supplies CO₂ used by photosynthesis, linking autotrophs and heterotrophsC4.2.22Recycling of all chemical elements• All chemical elements required by organisms are recycled in ecosystems• Decomposers convert detritus and waste into inorganic nutrients for producers

An Ecosystem Boundary Passes Both Energy and Matter

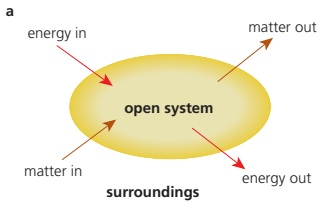
An ecosystem is a community interacting with its abiotic environment. It is an open system because both energy and matter can cross its chosen boundary.

Crossing the boundary Example
energy enters sunlight reaches producers
energy leaves respiratory heat dissipates
matter enters rain, mineral ions, migrating organisms
matter leaves runoff, gases, harvested biomass

A closed system exchanges energy but not matter. Natural ecosystems are not closed, even when much of their matter is recycled internally.

An open system receives and releases both energy and matter across its boundary.

Sunlight Powers Most Ecosystems—Not Every One

sunlight → photosynthetic pigments capture light → chemical energy is stored in carbon compounds → producer biomass supports consumers

Sunlight is the principal energy source for most ecosystems because photoautotrophs form the base of most food webs.

Low-light ecosystem Initial energy source Producer route
deep-ocean hydrothermal vent oxidation of inorganic chemicals chemoautotrophic bacteria or archaea
permanently dark cave organic matter imported from outside, or local chemosynthesis detrital food web or chemoautotrophs

The word most matters: sunlight is the dominant global input, but a food web can begin with chemical energy or with organic matter imported from another ecosystem.

Energy Flows Through; Matter Can Return

Feature Energy Matter
common input sunlight or chemical energy CO₂, water and mineral ions
movement through biota chemical energy in biomass and food atoms in organic molecules
major exit / return heat dissipates to surroundings decomposition returns inorganic forms
recycled by ecosystem? no yes, although matter can also enter or leave

external energy → producer carbon compounds → feeding → ATP and biomass → heat

inorganic matter → producer biomass → feeding and waste → detritus → decomposers → inorganic matter

Energy is conserved, but after it disperses as low-temperature heat it is no longer available to organisms as the chemical-energy input for another trophic transfer.

A Food-Chain Arrow Points from Food to Feeder

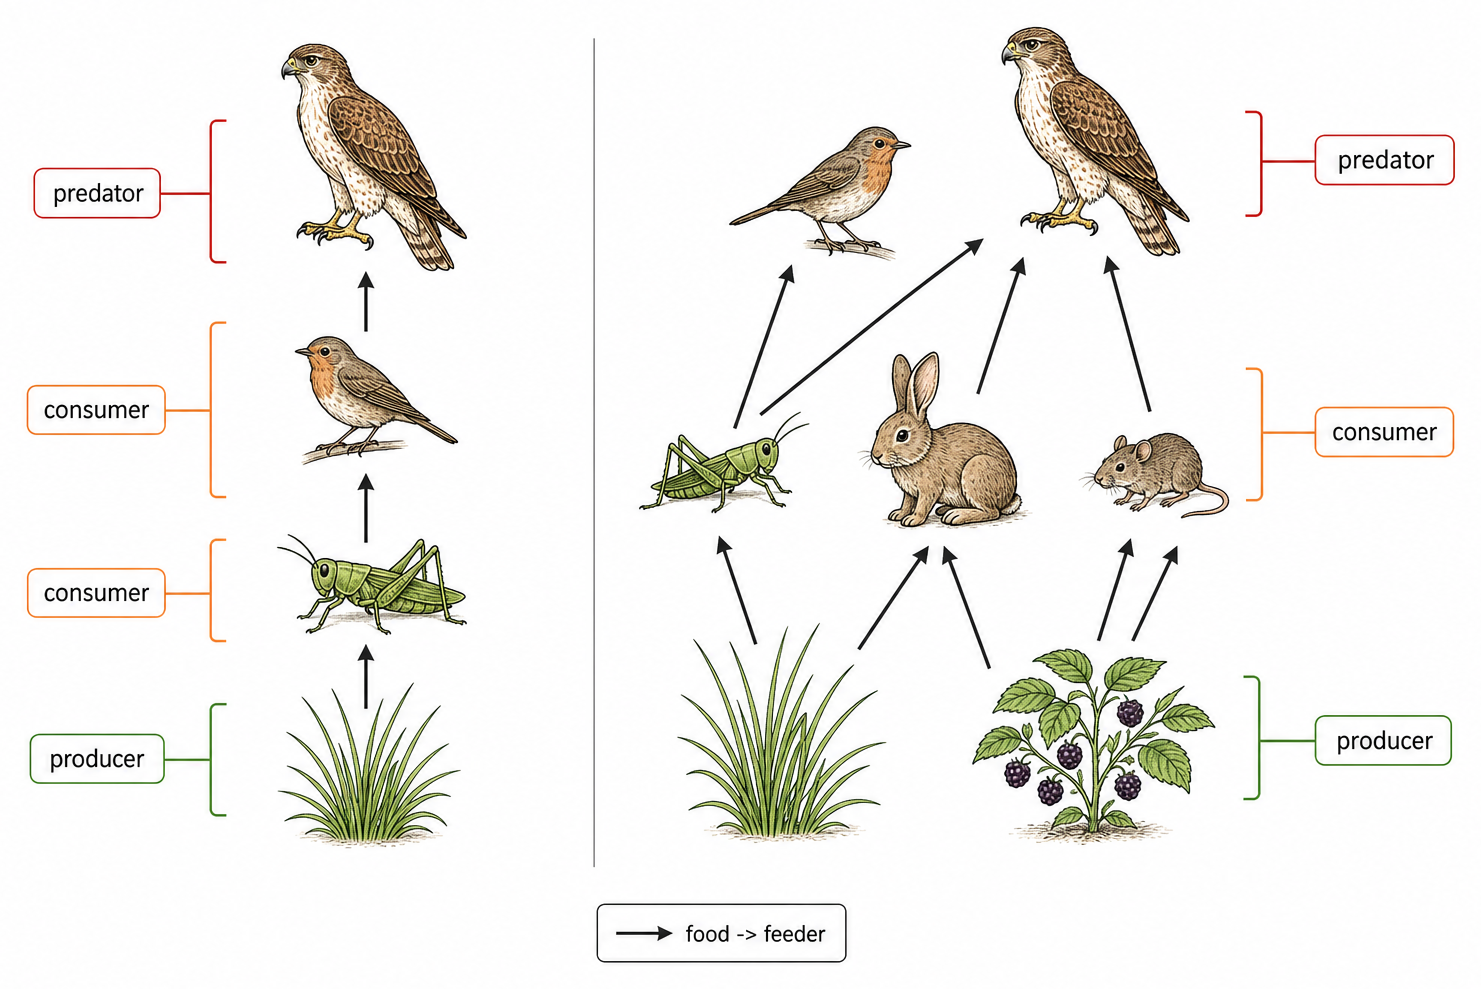
A food-chain arrow shows the direction in which chemical energy and biomass are transferred: from the organism being eaten to the consumer.

grass → grasshopper → robin → hawk means grasshopper feeds on grass, robin feeds on grasshopper, and hawk feeds on robin.

Read each arrow as ‘provides energy to’, not ‘eats’. The arrow therefore points toward the feeder.

A food chain and food web use arrows from each food organism toward the organism that consumes it.

A Food Web Reveals More Than One Dependence

Model What it shows What it hides
food chain one possible transfer sequence alternative foods and indirect effects
food web interconnected chains in a community quantities and interaction strength unless data are added

To predict a change: locate the altered population → follow arrows to its consumers → follow arrows backward to its foods → check whether consumers have alternative pathways.

If one prey declines, its specialist predator loses an energy source. A generalist predator may switch prey, transferring stronger predation pressure to another population.

A food web is qualitative unless arrow widths or accompanying data quantify biomass, energy flow or feeding frequency.

Detritus Feeds Organisms and Returns Elements

Detritus includes dead organisms, shed tissue, fallen leaves and faeces. Its carbon compounds still contain chemical energy.

Organism Action Immediate result
detritivore ingests and fragments detritus smaller particles and faeces
saprotrophic bacterium or fungus secretes enzymes, digests externally and absorbs products carbon for respiration and biomass
decomposer respiration oxidizes absorbed carbon compounds ATP, CO₂, water and heat

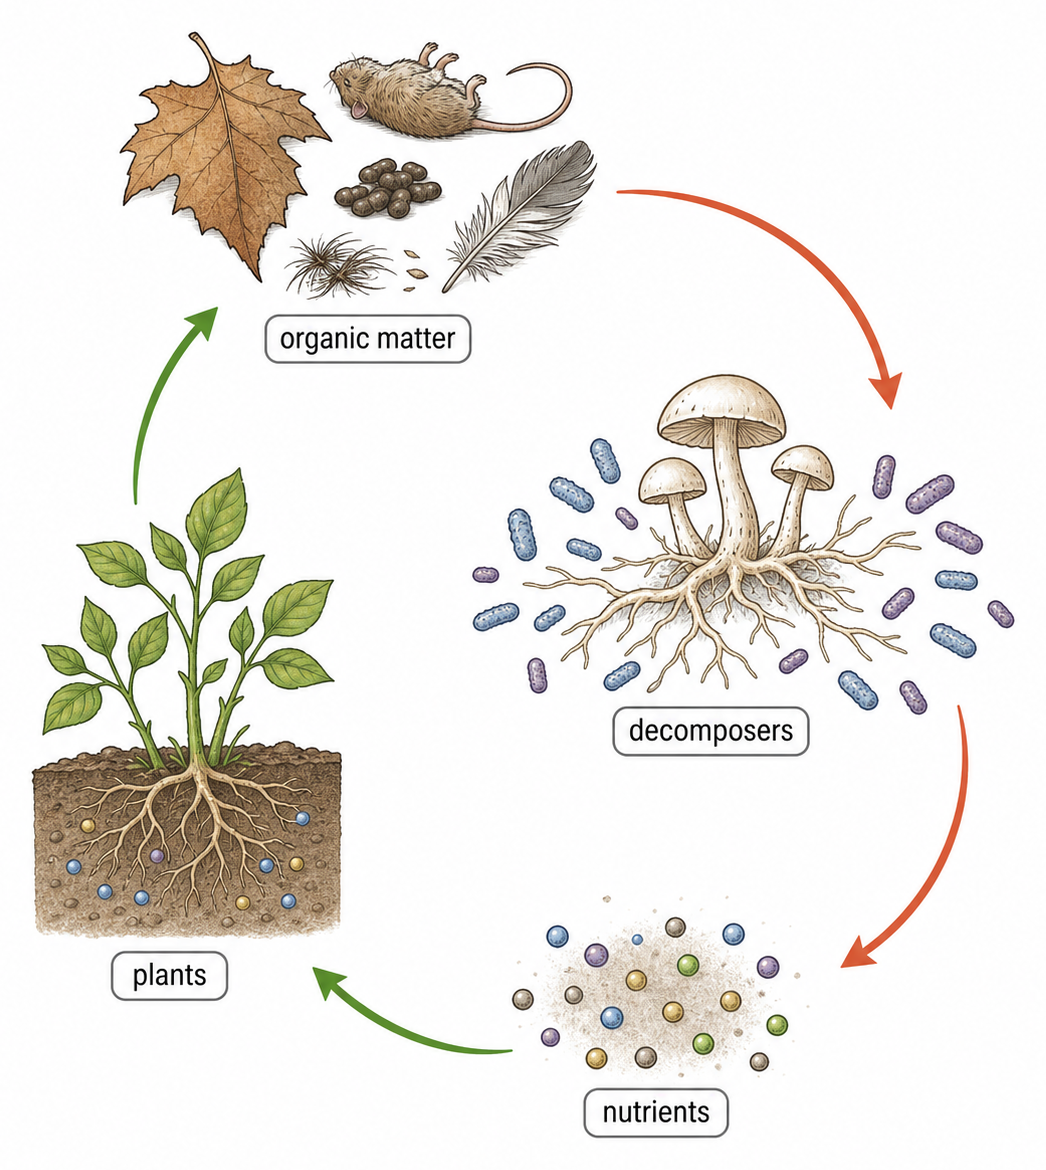
Decomposition releases inorganic molecules and ions into soil, water or air. Producers absorb them, so matter returns even though the detrital chemical energy ultimately leaves as heat.

Dead material and waste pass to decomposers, which release inorganic nutrients that producers can absorb again.

Autotrophs Fix Inorganic Carbon into Biomass

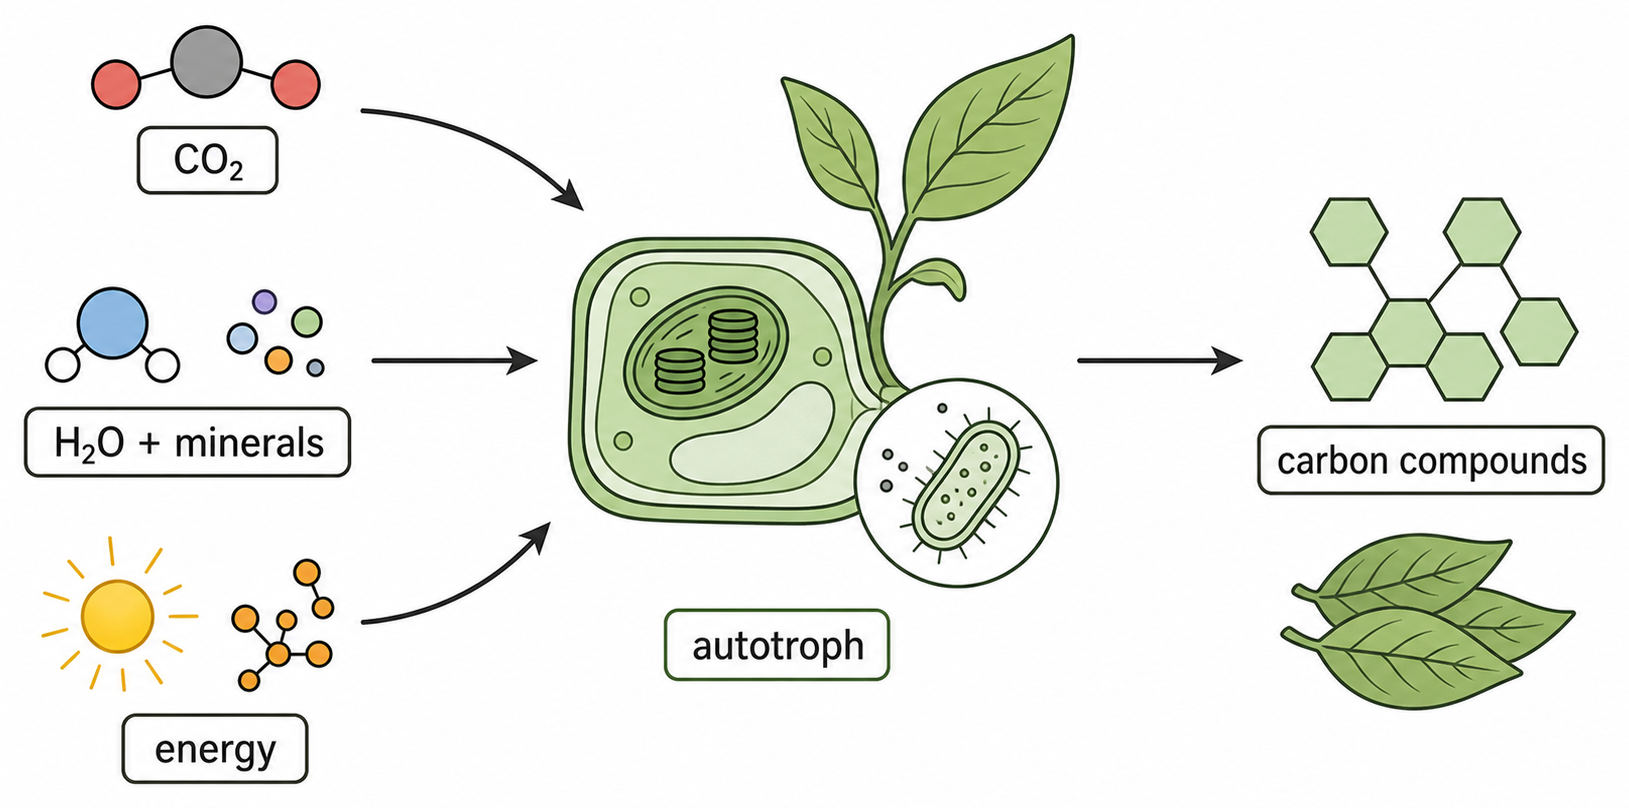
An autotroph uses an external energy source to synthesize carbon compounds from simple inorganic substances. Carbon fixation brings inorganic carbon into organic molecules.

Input type Example Job
carbon source CO₂ supplies carbon atoms
energy source light or oxidation of inorganic substances powers carbon fixation and synthesis
other matter water and mineral ions supplies atoms needed for biomass

‘Self-feeding’ does not mean creating matter or energy. Autotrophs transform external energy and inorganic matter into their own organic biomass.

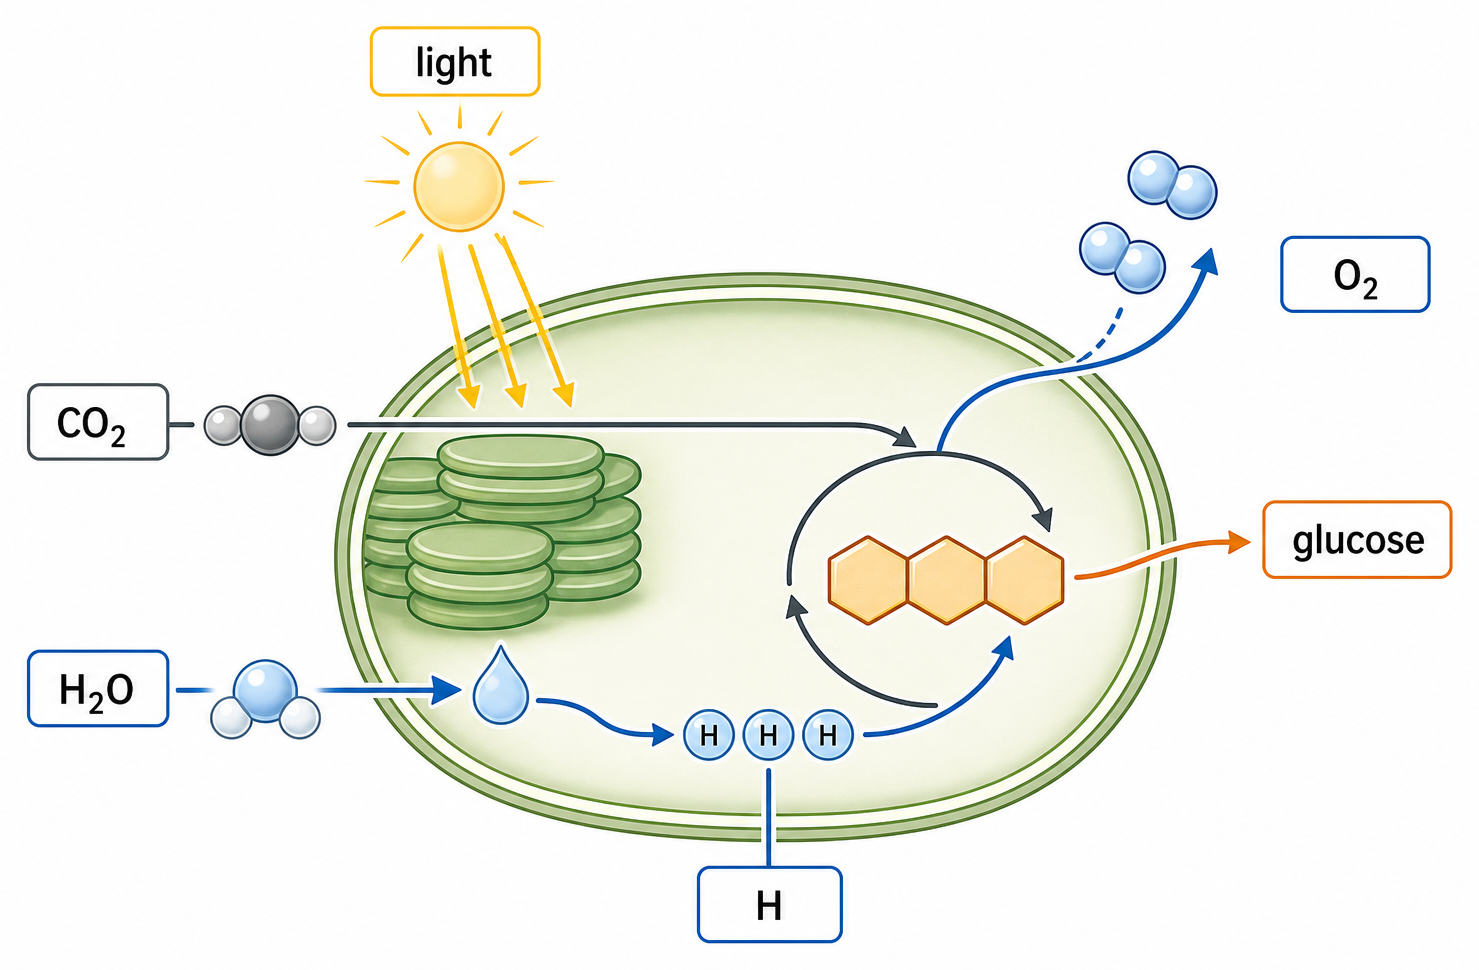
Carbon dioxide, water, mineral ions and an external energy source enter an autotroph, which produces carbon compounds and biomass.

Photoautotrophs and Chemoautotrophs Differ in Energy Source

Producer External energy source Example Shared outcome
photoautotroph light captured by pigments plant, alga, cyanobacterium inorganic carbon fixed into organic molecules
chemoautotroph energy released by oxidation of inorganic substances nitrifying or iron-oxidizing bacterium inorganic carbon fixed into organic molecules

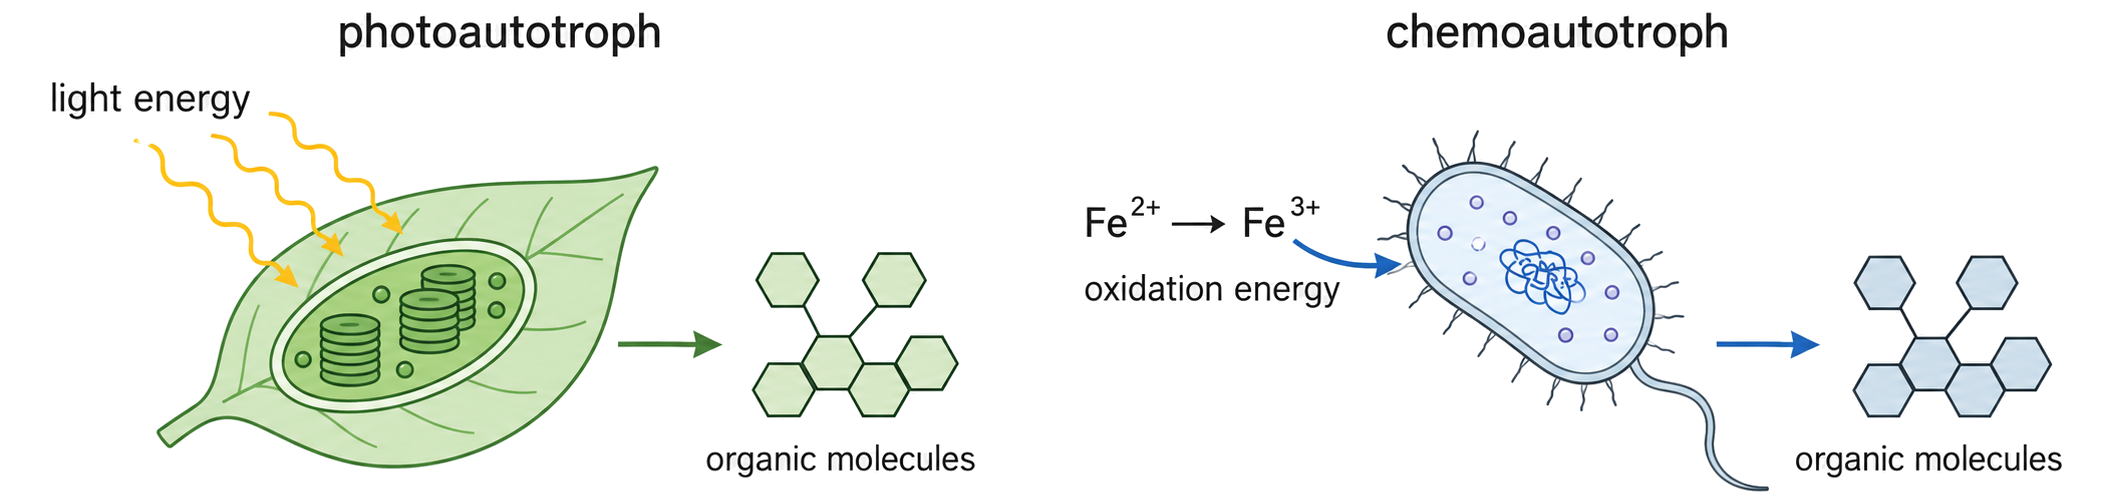
An iron-oxidizing bacterium can obtain energy when Fe²⁺ is oxidized to Fe³⁺. The iron supplies energy through electron transfer; it is not the organism's organic-carbon source.

Both routes are autotrophic because the organism builds carbon compounds from inorganic carbon; only the external energy source differs.

A photoautotroph uses light, while an iron-oxidizing chemoautotroph uses energy from converting iron two-plus ions to iron three-plus ions; both build organic molecules.

Heterotrophs Rebuild Carbon Obtained from Other Organisms

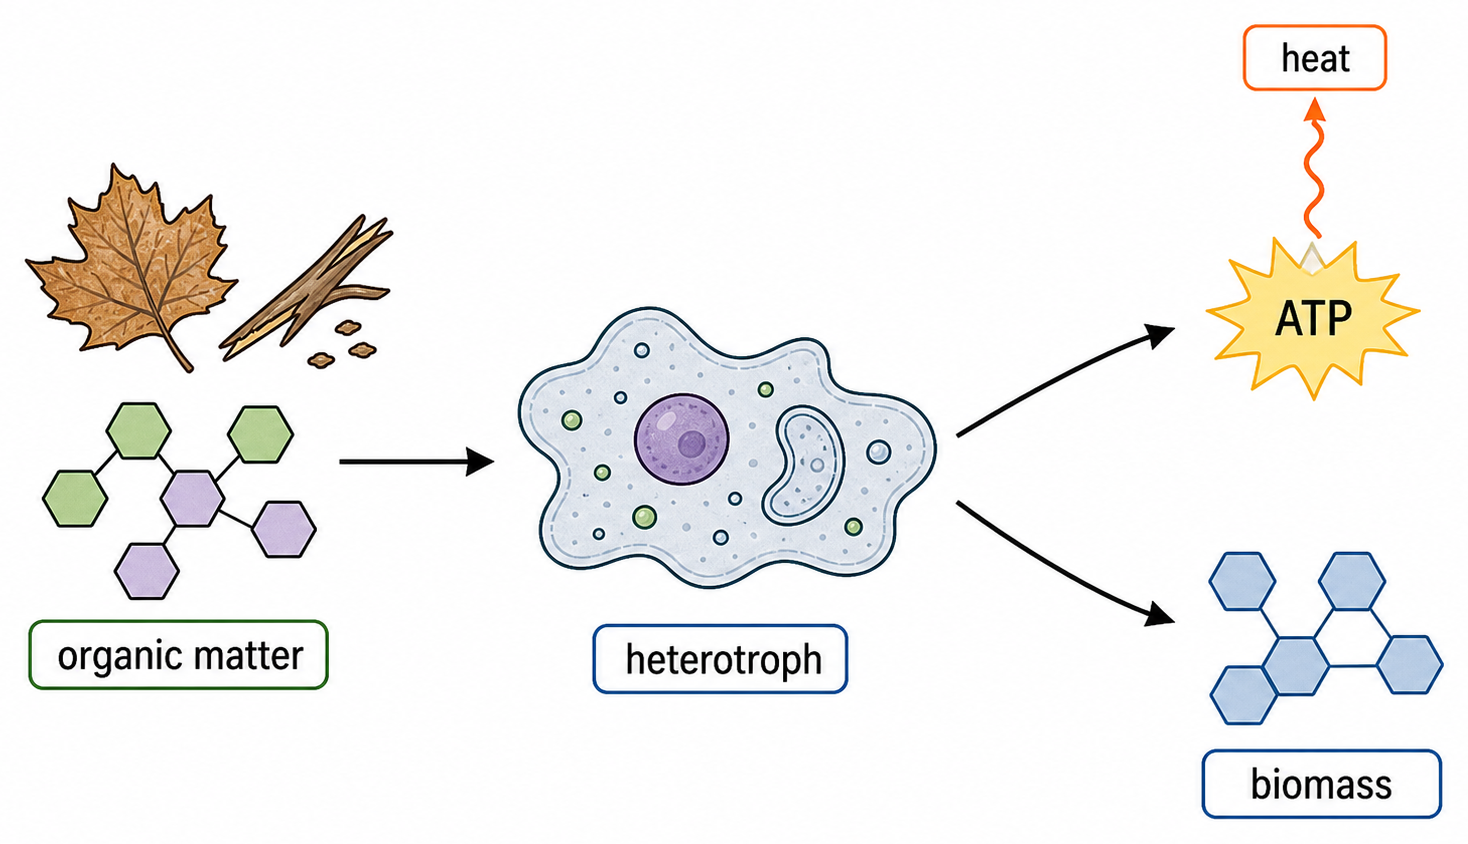
A heterotroph obtains carbon compounds from other organisms or organic matter. It does not fix all the carbon it needs from inorganic carbon.

organic matter → digestion inside a gut or outside the body → small molecules absorbed into cells → assimilation into organism-specific proteins, lipids, polysaccharides and nucleic acids

Heterotroph How organic matter is obtained
consumer ingests living or recently killed organisms
detritivore ingests dead material and waste
saprotroph digests externally and absorbs soluble products
A heterotroph receives organic matter and directs it toward respiration and heat or toward synthesis of its own biomass.

Organisms at Every Trophic Level Respire Carbon Compounds

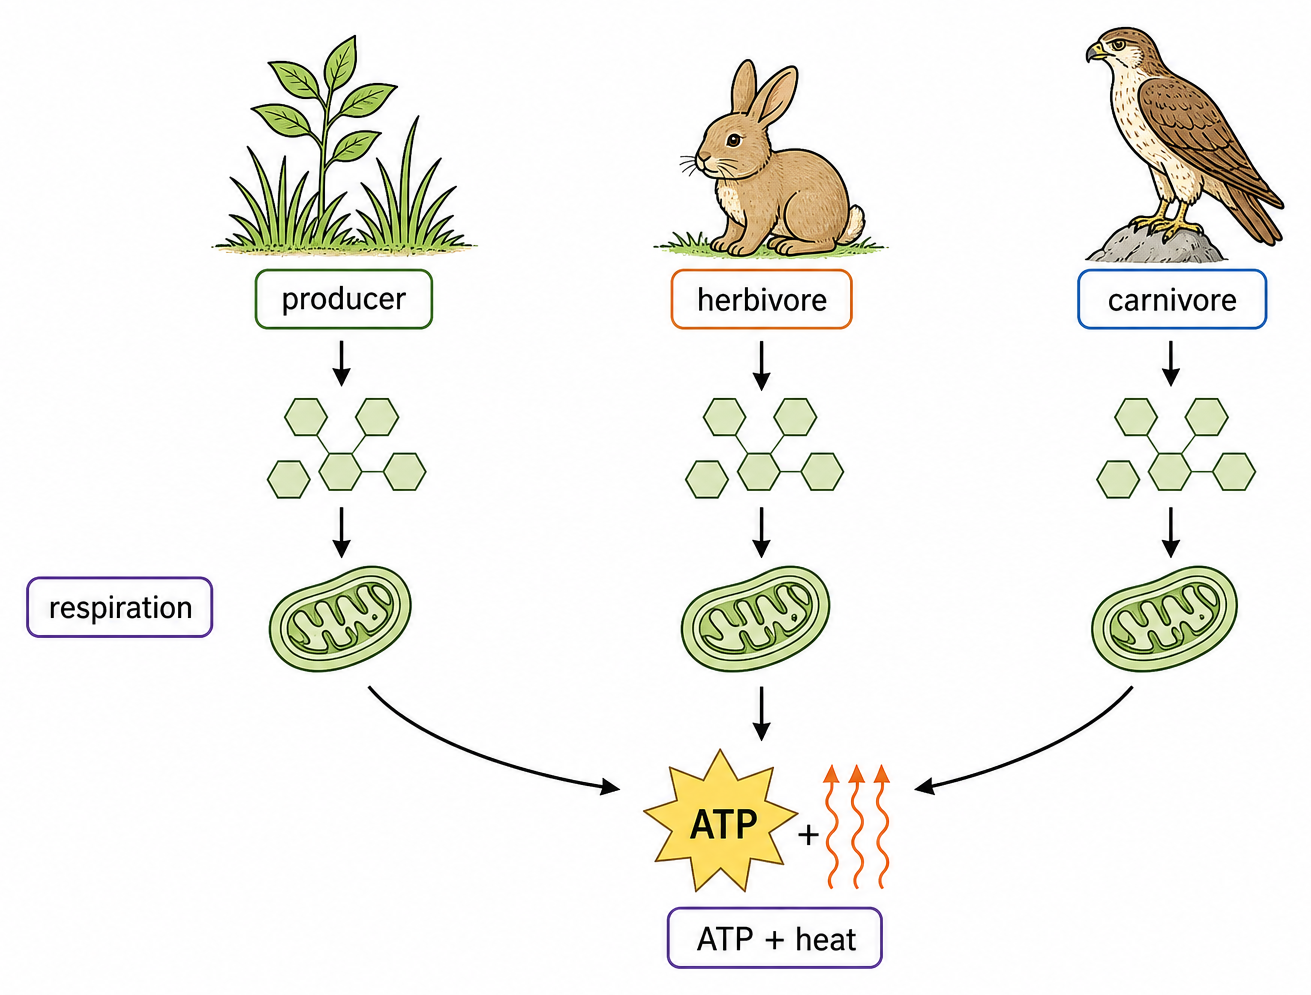
Autotrophs and heterotrophs both oxidize carbon compounds in cell respiration. Energy is transferred to ATP for cellular work, while some becomes heat.

Organism How it first gets carbon compounds What respiration does
autotroph synthesizes them from inorganic carbon releases stored chemical energy
heterotroph obtains them from other organisms releases stored chemical energy

Plants respire as well as photosynthesize. Photosynthesis stores energy in carbon compounds; respiration releases usable energy from those compounds.

A producer, herbivore and carnivore each oxidize carbon compounds in cell respiration, transferring energy to ATP and heat.

Trace One Energy Input and One Matter Pathway

Follow… Start Through organisms End or return
energy sunlight or inorganic oxidation producer biomass → feeding → respiration heat dissipates
carbon CO₂ or organic matter crossing boundary fixation → feeding → waste/death CO₂ from respiration or decay; some enters longer-term stores
mineral element inorganic ion producer uptake → feeding waste/death → decay → inorganic ion

For any arrow, ask: what is moving? In what chemical form? Which process moves it? Does it cross the ecosystem boundary, enter biomass, or return to an inorganic store?

Feeding can transfer energy and matter together, but their later fates differ: usable energy disperses as heat, while atoms can be rearranged and reused.

Trophic Level Depends on the Food Chain Being Traced

Trophic level Feeding position Example in one chain
1 producer grass
2 primary consumer grasshopper eating grass
3 secondary consumer robin eating grasshopper
4 tertiary consumer hawk eating robin

A trophic level is a feeding position in a particular food chain. It describes the transfer being traced, not an unchanging property of a species.

A human eating beans is a primary consumer; the same human eating a herbivorous cow is a secondary consumer. An omnivore can therefore occupy different trophic levels in different chains.

Decomposers receive material from organisms at every trophic level, so forcing them into one fixed level hides the detrital network.

An Energy Pyramid Measures a Rate, Not a Snapshot

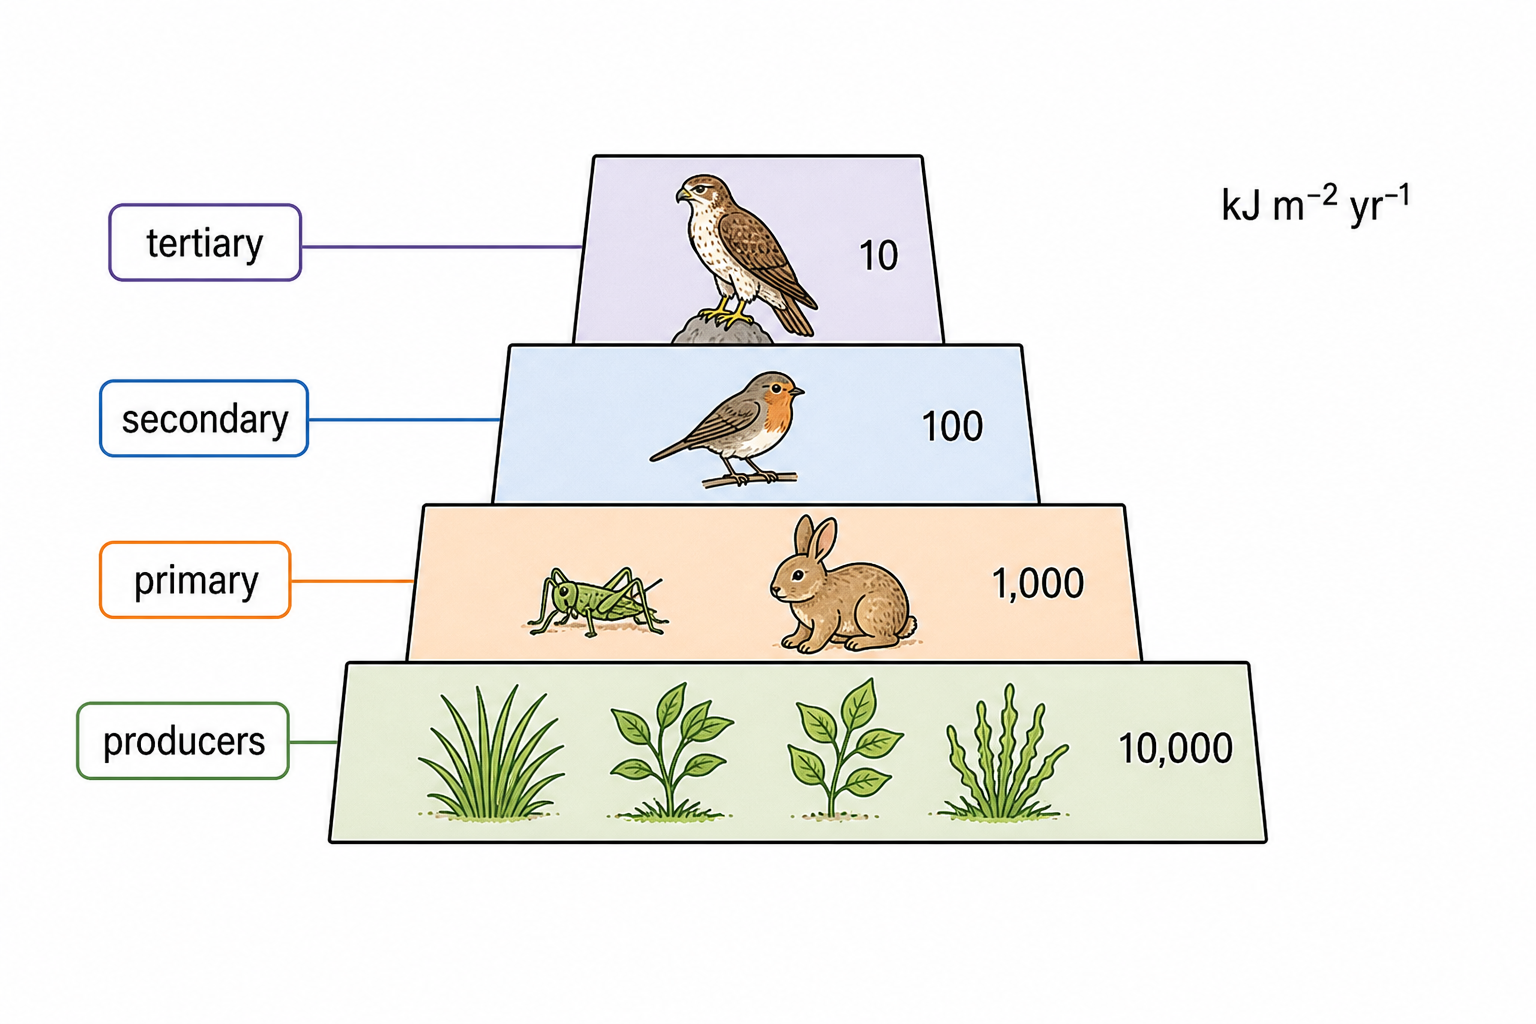
A pyramid of energy shows the energy incorporated into biomass at each trophic level per unit area per unit time, for example kJ m⁻² yr⁻¹.

Use equal-height horizontal bars → centre every bar on the same vertical axis → make width proportional to the measured energy-flow value → place producers at the base.

Pyramid Quantity represented Can be inverted?
energy rate of biomass-energy production no; transfer losses make each higher rate smaller
biomass standing biomass at one time yes
numbers count of organisms at one time yes
A generalized energy pyramid has a wide producer base and progressively narrower primary-, secondary- and tertiary-consumer bars.

Only New Biomass Can Feed the Next Trophic Level

Energy route at one level Available to next grazing level? Destination
biomass never eaten no detritus and decomposers
eaten but not digested no faeces and decomposers
absorbed then excreted no waste pathway
oxidized in respiration no ATP transfer and heat
retained as new biomass yes, if eaten growth and reproduction

energy in existing biomass → fraction ingested → fraction assimilated → fraction left after respiration → new consumer biomass

Transfer efficiency varies with digestibility, metabolic rate and how much biomass is eaten. Carnivore diets are often more digestible than lignified plant tissue; ectotherms often spend less energy maintaining body temperature than endotherms.

‘Lost to the next consumer’ does not always mean lost from the ecosystem immediately. Uneaten biomass and faeces can still supply detritivores and decomposers before respiration releases heat.

Transfer Efficiency Compares Adjacent Energy Budgets

η=EhigherElower×100%\eta=\frac{E_{higher}}{E_{lower}}\times100\%

Trophic level Energy flow
producers 18,000 kJ m⁻² yr⁻¹
primary consumers 2,160 kJ m⁻² yr⁻¹
efficiency (2,160 ÷ 18,000) × 100 = 12%

Here η is transfer efficiency, E higher is the energy-flow value at the next trophic level and E lower is the value at the level supplying it. Both measurements must cover the same area and time interval.

About 10% is a useful rough model, not a fixed biological law. Use the supplied values whenever data are available, and draw bar widths to those values rather than forcing every transfer to exactly 10%.

Respiratory Heat Is Conserved but Not Recycled

carbon-compound oxidation → energy transferred to ATP plus heat → ATP powers cellular work and more heat is released → heat spreads into the surroundings

Energy is not destroyed. It becomes dispersed thermal energy that organisms cannot concentrate back into the chemical bonds required to restart the food chain.

Because usable energy is continually degraded to heat, ecosystems need a continuing external input—usually sunlight—even though atoms can be recycled.

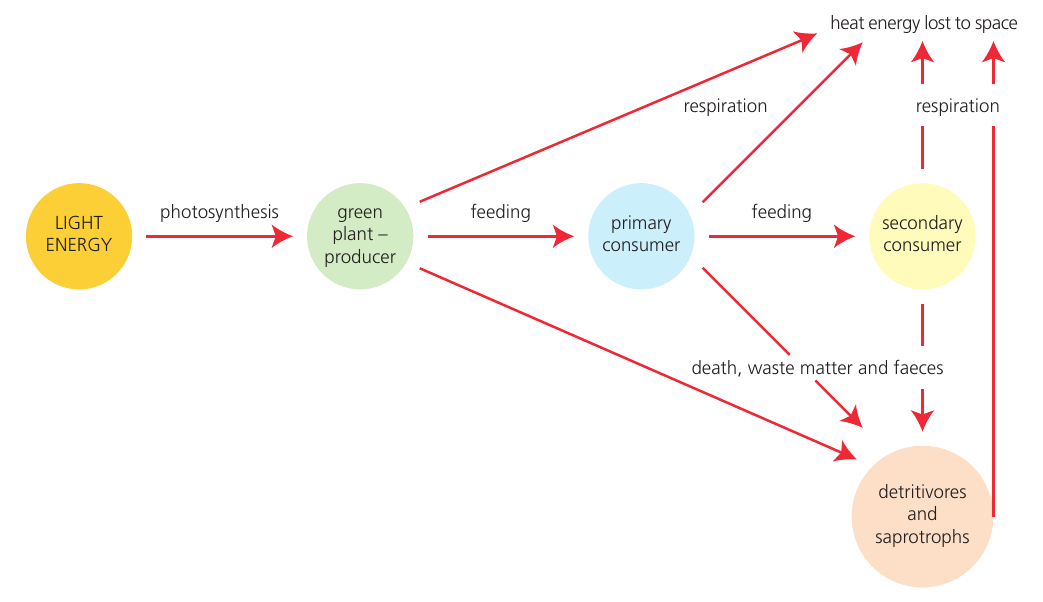
Light energy enters a producer and chemical energy passes through consumers and detritivores, while respiration releases heat from every trophic level.

Repeated Losses Put a Ceiling on Food-Chain Length

producer energy budget → incomplete transfer → smaller primary-consumer budget → another incomplete transfer → still smaller upper-level budget → an additional stable trophic level eventually becomes impossible

Toward the top of a food chain:

  • Energy flow decreases with every incomplete transfer.
  • Less total biomass can usually be supported.
  • Fewer large consumers can usually be supported.
  • A top predator often requires a larger feeding area.

Higher levels do not always contain fewer individual organisms. Body size matters; many small parasites can live on one host. The reliable restriction is the smaller energy budget.

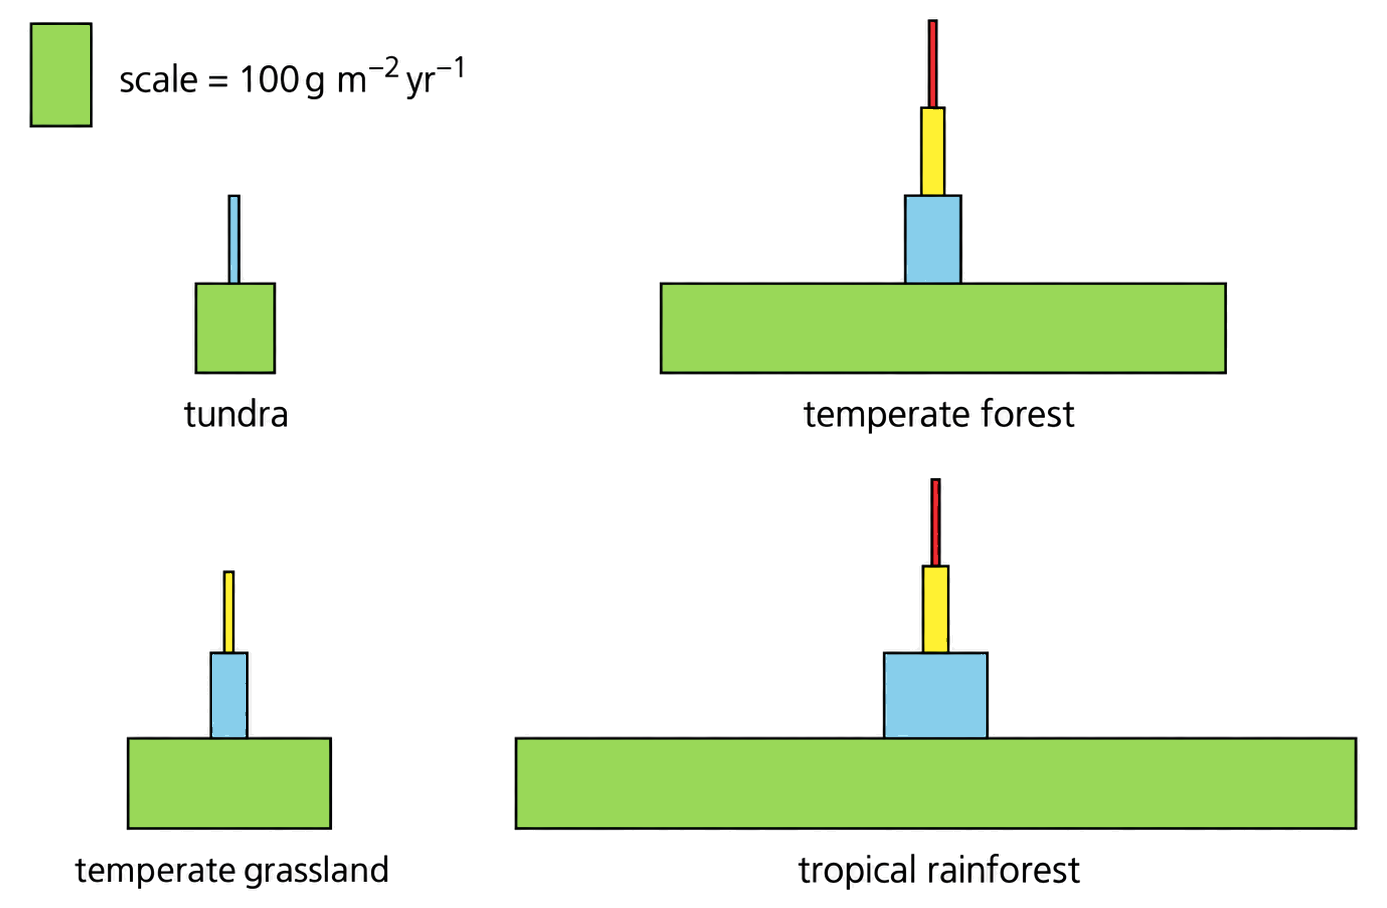
Energy pyramids for tundra, temperate forest, temperate grassland and tropical rainforest show progressively narrower upper trophic levels.
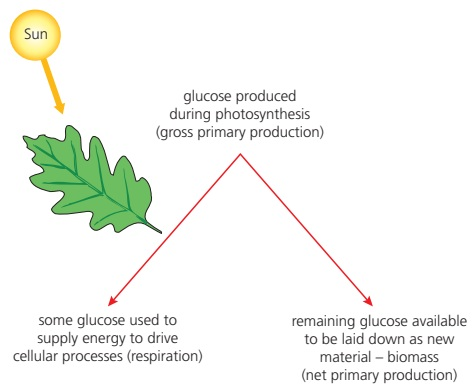
Net Primary Production Is Producer Biomass Left after Respiration

NPP=GPP−RNPP=GPP-R

Quantity Meaning
GPP total rate at which producers fix carbon / store energy by photosynthesis
R producer respiratory loss
NPP rate of new producer biomass accumulation available for growth, reproduction and consumers

If GPP = 2,400 g C m⁻² yr⁻¹ and producer respiration = 1,350 g C m⁻² yr⁻¹, then NPP = 1,050 g C m⁻² yr⁻¹.

Gross primary production is divided between producer respiration and new producer biomass called net primary production.

Climate and Season Length Shape Net Primary Production

NPP falls when a resource or condition restricts new biomass production:

  • Low light: less energy is captured by photosynthesis.
  • Water shortage: stomata close, limiting CO₂ uptake, and growth slows.
  • Low temperature: enzyme-controlled reactions and nutrient cycling slow.
  • Excessive temperature: water loss rises and enzymes may lose function.
  • Short growing season: there are fewer days of positive carbon gain.
Biome Typical NPP explanation
tropical rainforest warm, wet and illuminated through most of the year
temperate forest or grassland seasonal light and temperature shorten production
tundra cold, short growing season and slow nutrient cycling

Higher NPP builds a larger producer energy budget, which can support more biomass and sometimes more trophic levels. Low NPP constrains the whole food web from its base.
NPP is a rate of new biomass production, not the amount of standing biomass visible on one date.

Consumer Production Has Two Loss Checkpoints

GSP=I−FGSP=I-F

NSP=GSP−RNSP=GSP-R

Symbol Meaning
I food energy or biomass ingested
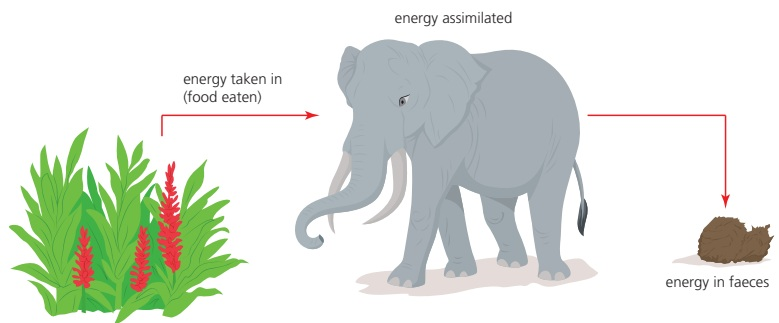
F faecal loss; not assimilated
GSP energy or biomass absorbed by the consumer
R consumer respiratory loss
NSP new consumer biomass available to growth, reproduction and the next trophic level

A caterpillar ingests 900 kJ, loses 360 kJ in faeces and uses 420 kJ in respiration: GSP = 540 kJ and NSP = 120 kJ.

Food energy enters a consumer; some is not assimilated and leaves in faeces, while assimilated energy can support respiration or new biomass.
Follow the Energy Budget from Producer to Consumer Biomass

Stage Calculation or decision What becomes available next?
producer NPP = GPP − producer R new producer biomass
consumer assimilation GSP = ingestion − faecal loss absorbed energy
consumer production NSP = GSP − consumer R new consumer biomass
trophic transfer higher-level energy ÷ lower-level energy × 100 transfer efficiency
Observation First mechanism to test
low NPP light, water, temperature or short season
much food but low GSP low digestibility / large faecal loss
high GSP but low NSP high respiration
short food chain compounded transfer losses leave too little upper-level energy

An energy pyramid narrows because each level keeps only the fraction converted into new biomass. Every other route either feeds the detrital pathway or ultimately dissipates energy as heat.
Carbon-Cycle Diagrams Separate Stores from Fluxes

Diagram feature Meaning Example
box carbon store or reservoir atmospheric CO₂; plant biomass
labelled arrow carbon flux between stores photosynthesis; feeding; respiration
arrowhead direction of carbon transfer atmosphere → producers
number on arrow rate over a stated interval Gt C yr⁻¹

Name the stores first → add biological fluxes → add long-term geological/fossil stores if required → check every arrow has a direction and process label → include atmospheric CO₂.

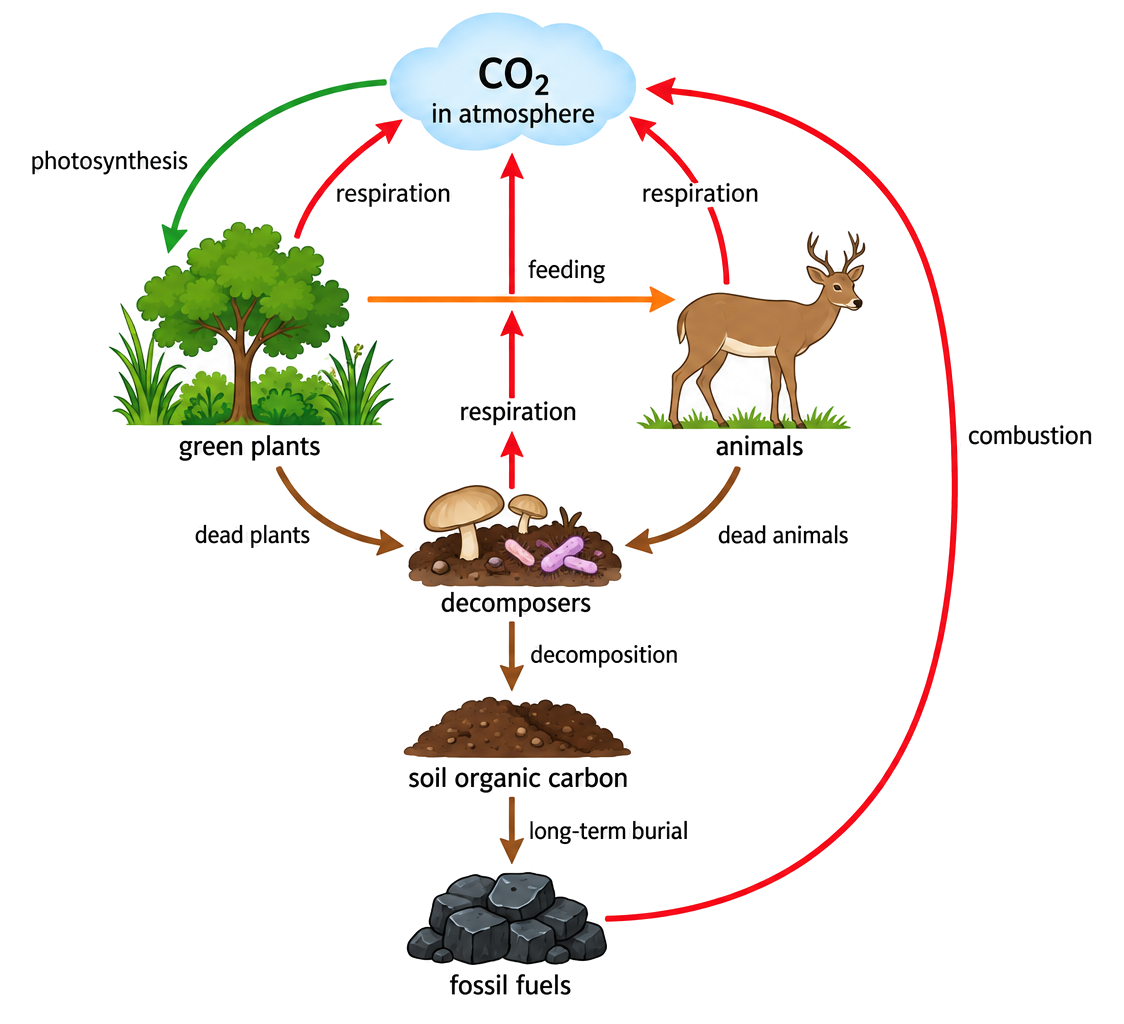
Draw stores as boxes and processes as arrows. A plant, animal or factory picture does not by itself state the carbon store, transfer direction or process.

A simplified carbon cycle links atmospheric carbon dioxide, green plants, animals, decomposers, soil organic carbon and fossil fuels with labelled process arrows.

Biological Fluxes Move Carbon Around the Short Cycle

Flux From To Carbon form change
photosynthesis atmospheric or dissolved CO₂ producer biomass inorganic → organic
feeding one organism's biomass consumer biomass organic → organic
respiration organic carbon in cells atmospheric or dissolved CO₂ organic → inorganic
death and waste living biomass detritus organic → organic
decomposition detritus decomposer biomass and CO₂ / inorganic nutrients organic redistributed and mineralized

CO₂ → photosynthesis → plant carbohydrate → feeding → animal biomass → respiration or death → CO₂ through respiration and decomposition

Producers, consumers and decomposers all respire. The carbon cycle therefore has several arrows returning CO₂, not one ‘animal-only’ respiration arrow.

A cycle diagram shows routes, not necessarily equal rates. Add values or arrow widths only when evidence supplies them.

Sink or Source Depends on the Net Balance

Net balance over a stated interval Classification Store change
carbon in > carbon out sink increases
carbon out > carbon in source decreases
carbon in = carbon out neither net sink nor net source unchanged

ΔC=Cin−Cout\Delta C=C_{in}-C_{out}

Reservoir Can act as a sink when… Can act as a source when…
forest photosynthesis and biomass growth exceed losses respiration, fire, decay or harvest exceed uptake
soil / peat organic inputs exceed decomposition drainage and warming accelerate oxidation
ocean uptake exceeds release warming or circulation shifts favour release

A forest, soil or ocean is not permanently a sink. Classification depends on all relevant fluxes and on the time interval chosen.

Combustion Moves Stored Carbon into Atmospheric CO₂

carbon-rich fuel + O₂ → CO₂ + H₂O + released energy

Fuel Approximate storage timescale before burning Why combustion matters
fresh biomass years to decades rapidly returns recently fixed carbon; regrowth determines later uptake
peat centuries to millennia drainage exposes stored organic carbon to oxidation and fire
coal, oil, natural gas millions of years transfers geologically stored carbon into the active atmosphere-ocean cycle

Fire converts organic carbon in biomass or fuel to atmospheric CO₂ quickly. It can also weaken a sink by killing vegetation that would otherwise remove CO₂ through photosynthesis.

Combustion occurs naturally after lightning, but human fossil-fuel use and deliberate biomass burning have greatly increased the flux to the atmosphere.

The Keeling Baseline Rises When Sources Exceed Sinks

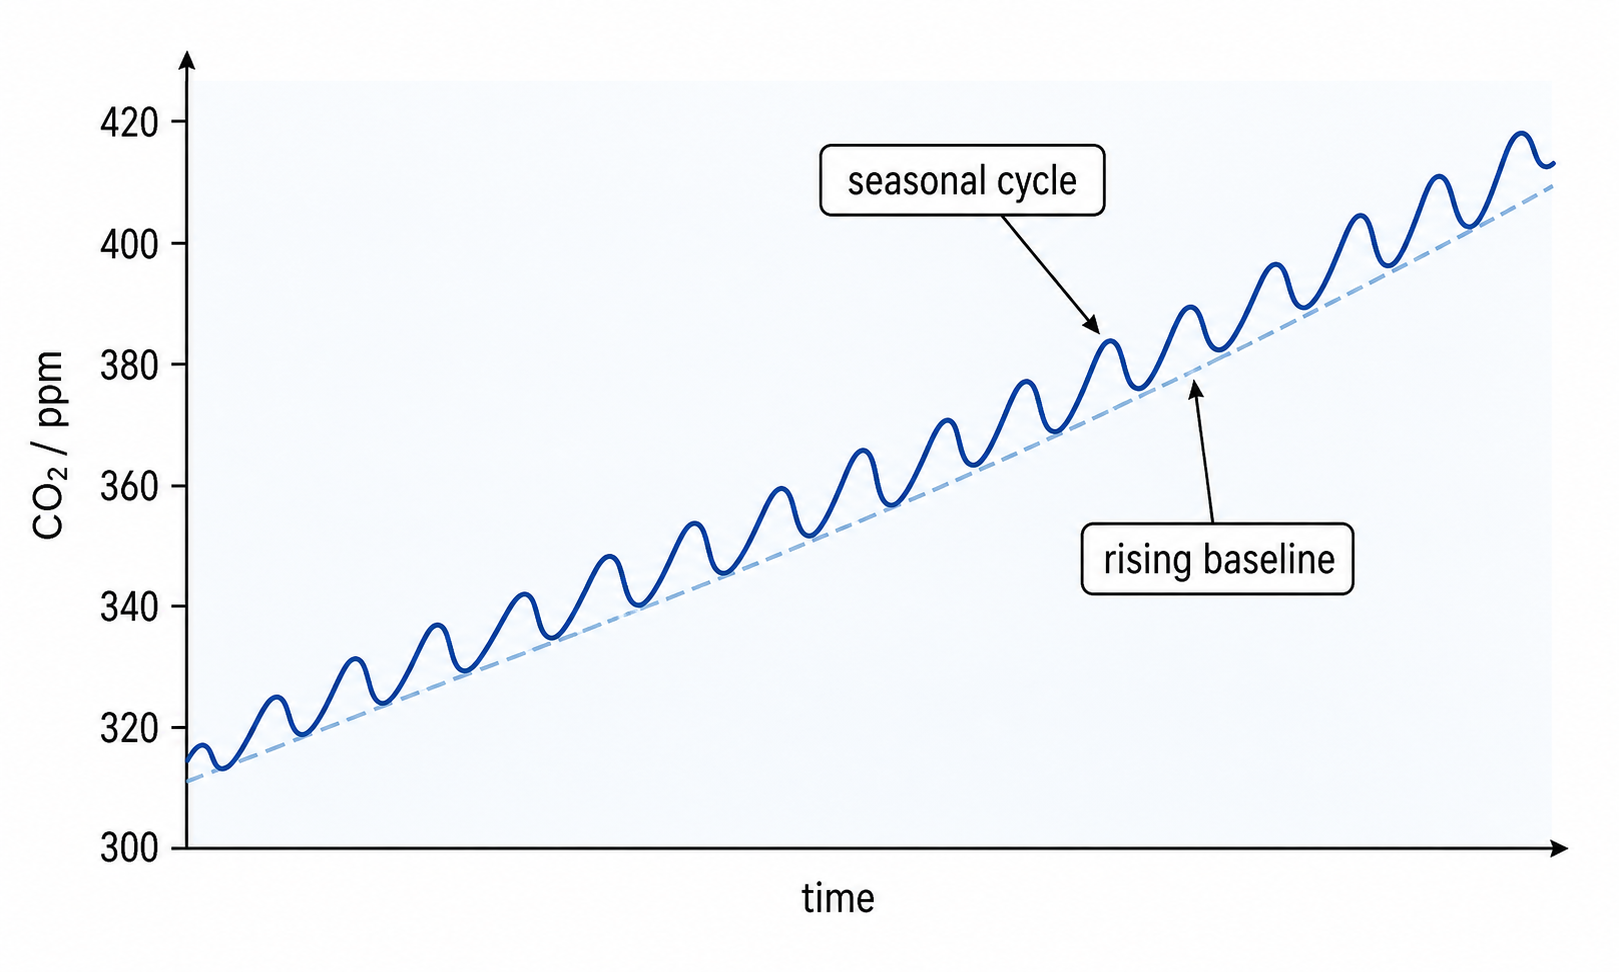
The Keeling Curve is the long-running atmospheric CO₂ record begun at Mauna Loa in the late 1950s. Its rising baseline shows a long-term net gain of CO₂ in the atmosphere.

fossil-fuel combustion + land-use emissions + other sources > uptake by oceans and terrestrial photosynthesis → atmospheric CO₂ accumulates

Graph feature Timescale Main interpretation
rising baseline decades persistent net source to atmosphere
small repeating teeth one year seasonal biological fluxes

The curve records atmospheric concentration. It supports a net-balance conclusion; identifying individual sources requires additional measurements and carbon-cycle evidence.

Atmospheric carbon dioxide rises from about 315 parts per million in 1958 to above 400 parts per million, with a repeated seasonal oscillation around the rising baseline.

Seasonal CO₂ Falls during Northern Summer Growth

Northern Hemisphere season Dominant change in terrestrial biota Atmospheric CO₂ tendency
spring and summer leaf area and photosynthesis increase; uptake exceeds biological release falls
autumn and winter photosynthesis falls while respiration and decomposition continue rises

Northern Hemisphere land vegetation dominates the global seasonal signal because most of Earth's land and terrestrial plant biomass lie north of the equator.

Within each year CO₂ can fall for several months, while each year's average remains above the previous one. Seasonal uptake therefore coexists with the long-term rise.

Do not explain the annual fall by reduced combustion alone. The repeating biological drawdown is driven mainly by photosynthesis during Northern Hemisphere growth.

Photosynthesis and Respiration Exchange Two Atmospheric Gases

Process Main gas input Main gas output Energy role
photosynthesis CO₂ O₂ stores captured energy in carbon compounds
aerobic respiration O₂ CO₂ releases energy from carbon compounds to ATP and heat

photosynthetic organisms replenish atmospheric O₂ used by aerobic respiration ↔ respiration by producers, consumers and decomposers returns CO₂ that photoautotrophs can fix

The processes are linked but are not simple reversals inside one organelle. They use different pathways, enzymes and energy conversions, and both occur in photosynthetic organisms.

Large opposing fluxes can occur at the same time. Atmospheric concentration changes only by the difference between total inputs and outputs.

Every Essential Element Returns through a Biogeochemical Cycle

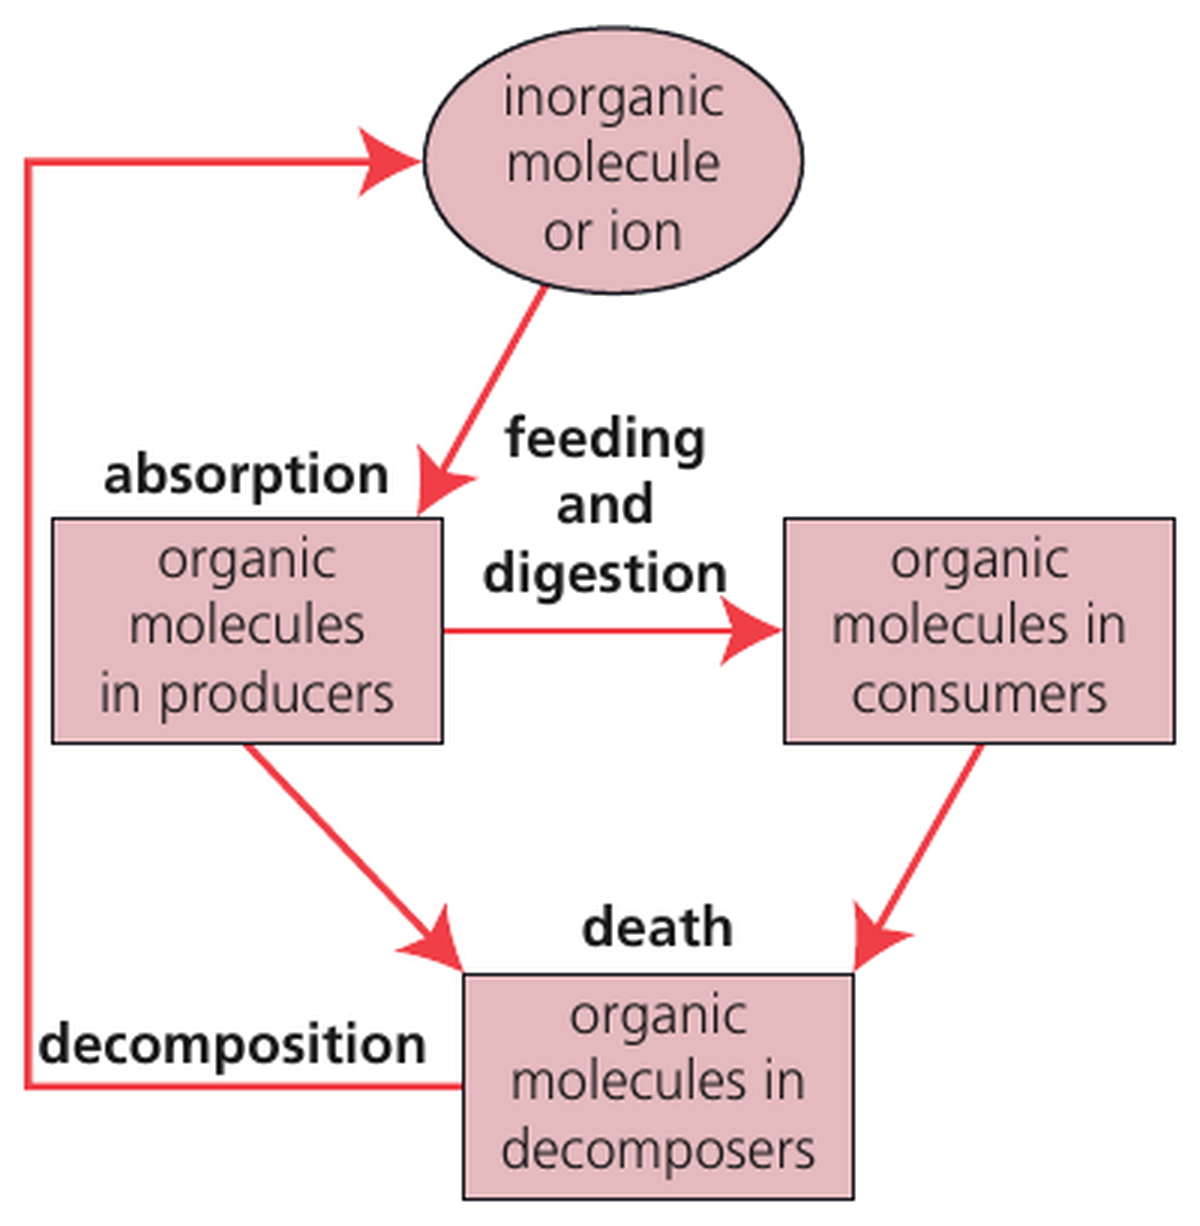
inorganic molecule or ion → producer uptake and assimilation → organic molecules in biomass → feeding → waste or death → detritus and decomposers → inorganic form available again

Carbon is one example. Hydrogen, oxygen, nitrogen, phosphorus, sulfur, calcium, potassium and other required elements are also recycled between organisms and the atmosphere, hydrosphere or lithosphere.

Without decomposers, essential elements would remain locked in dead organic matter and waste. Recycling restores availability; it does not create a new supply of atoms.

Inorganic molecules or ions are absorbed by producers, move to consumers by feeding and digestion, enter decomposers after death, and return to the inorganic environment through decomposition.

Keep Energy, Matter, Stores and Timescales Separate

Question Energy answer Matter / carbon answer
What enters? usually sunlight CO₂, water, ions, organisms and detritus can cross boundaries
What moves through food webs? chemical energy in biomass atoms in organic molecules
What returns? no usable-energy cycle; heat dissipates decomposition and respiration return inorganic forms
What can accumulate? biomass energy temporarily carbon in biomass, soil, peat, ocean or fossil stores
What reveals imbalance? shrinking energy budgets up trophic levels changing store size or atmospheric concentration

Use the correct evidence scale: energy-pyramid data for trophic transfer; GPP/NPP and GSP/NSP budgets for production; labelled store-and-flux diagrams for cycling; the Keeling trend for multi-decade atmospheric accumulation; seasonal teeth for annual biological fluxes.

Matter can be rearranged and reused because atoms remain available in biotic and abiotic stores. Usable energy must be replaced because each biological transfer disperses part of it as heat.

Ecosystems as open systems

6 marks

Describe the movement of energy and nutrients in an ecosystem.

Sunlight as principal energy source

7 marks

Explain how the energy supply in an ecosystem is dependent on sunlight.

Chemical energy flow

7 marks

Describe how populations in communities rely on each other for supplies of energy.

Food chains and food webs

6 marks

Describe what is meant by a food chain and a food web.

Supply to decomposers

2 marks

Detritus accumulates on coral reefs damaged by ocean acidification.
Suggest two possible impacts of an increase in detritus on the organisms in this food web.

Autotrophs as self-feeders

1 mark

Define the term autotroph.

Energy sources

1 mark

Which organisms use oxidation of simple inorganic substances as an energy source?

Heterotrophs exam focus

5 marks

Compare and contrast how different types of heterotrophs obtain the energy that they need to produce ATP.

Energy release

1 mark

State one process that results in the loss of carbon dioxide from a marine organism such as a crustacean or a jellyfish.

Trophic levels

4 marks

Explain, using an example of a food chain, how trophic levels can be deduced.

Energy pyramids

6 marks

Ecologists sometimes display data from an ecosystem using a diagram called a pyramid of energy. Describe what is shown in pyramids of energy.

Energy reductions

3 marks

The efficiency of energy transfer along the various food chains in a food web varies. Suggest reasons for the differences.

Heat loss

1 mark

Plankton are major producers in marine ecosystems. Only a small proportion of the energy harvested by plankton is passed to the primary consumers. Which process in phytoplankton results in the largest loss of energy that could otherwise be utilized by consumers?

Restrictions on trophic levels

1 mark

Outline why the number of trophic levels is limited in a food chain.

Primary production

3 marks

In each forest, there are two or three trial plots per CO2 treatment. The bar chart shows the allocation of carbon from net primary production to different parts of the trees in these trial plots.

Evaluate the evidence from the bar chart that increases in carbon dioxide cause increases in carbon storage in young, developing forests.

Secondary production

1 mark

Calculate how much food would be required to produce 20 kg of boar meat.

kg

Carbon cycle diagrams

9 marks

Living organisms at every trophic level are part of the carbon cycle. Draw a labelled diagram of the carbon cycle to show the processes involved.

Carbon sinks and sources

2 marks

The graph shows long-term fluctuations in atmospheric CO2\mathrm{CO}_{2} concentration of about 80 ppm . The decreases in CO2\mathrm{CO}_{2} concentration are probably due to oceans acting as a sink by holding large quantities of dissolved CO2\mathrm{CO}_{2}.

Identify two other examples of natural sinks that can remove carbon from the carbon cycle and reduce atmospheric CO2\mathrm{CO}_{2} concentration.

CO₂ release during combustion

1 mark

The graph shows how the worldwide use of fossil fuels has increased from 1800 to 2019.

How has the increased combustion of fossil fuels contributed significantly to global warming?

Keeling Curve analysis

1 mark

The graph shows data collected at Mauna Loa, USA, for monthly mean carbon dioxide concentration.

What causes the decreases in monthly mean carbon dioxide concentration each year?

Recycling of all chemical elements

7 marks

Explain how carbon is recycled in a terrestrial ecosystem.