D4.1.8—Modelling selection
Models of selection simplify populations so changes in survival, reproduction or allele frequency can be tested and visualized in evolving populations.
- Syllabus
- First assessment 2025
- Objective
- D4.1.8
- Level
- HL
Models of selection simplify populations so changes in survival, reproduction or allele frequency can be tested and visualized in evolving populations.

Coverage 2025–2025 · Updated 16 Jul 2026
A selection model represents how different survival or reproduction rates alter genotype or allele frequencies through repeated generations.
Set initial frequencies and fitnesses; calculate surviving contributions; normalize the next generation; repeat. The direction depends on assumptions and starting values.
Check which class has the highest reproductive contribution before reading a model’s trend.; separate variation, selection, inheritance and time
If resistant bacteria leave twice as many offspring as susceptible bacteria under antibiotic exposure, the resistant frequency rises over successive cycles. This gives a concrete prediction from the stated population.
A model is not a forecast without its assumptions; migration, mutation and changing pressures can alter the trend. Interpret the result within the stated selection model and evidence limits.
This objective is assessed through multiple choice, commonly using Describe / Explain.
Describe / Explain
Build the answer around this relationship: Models can show how selection changes variant frequencies over generations.
Representative question
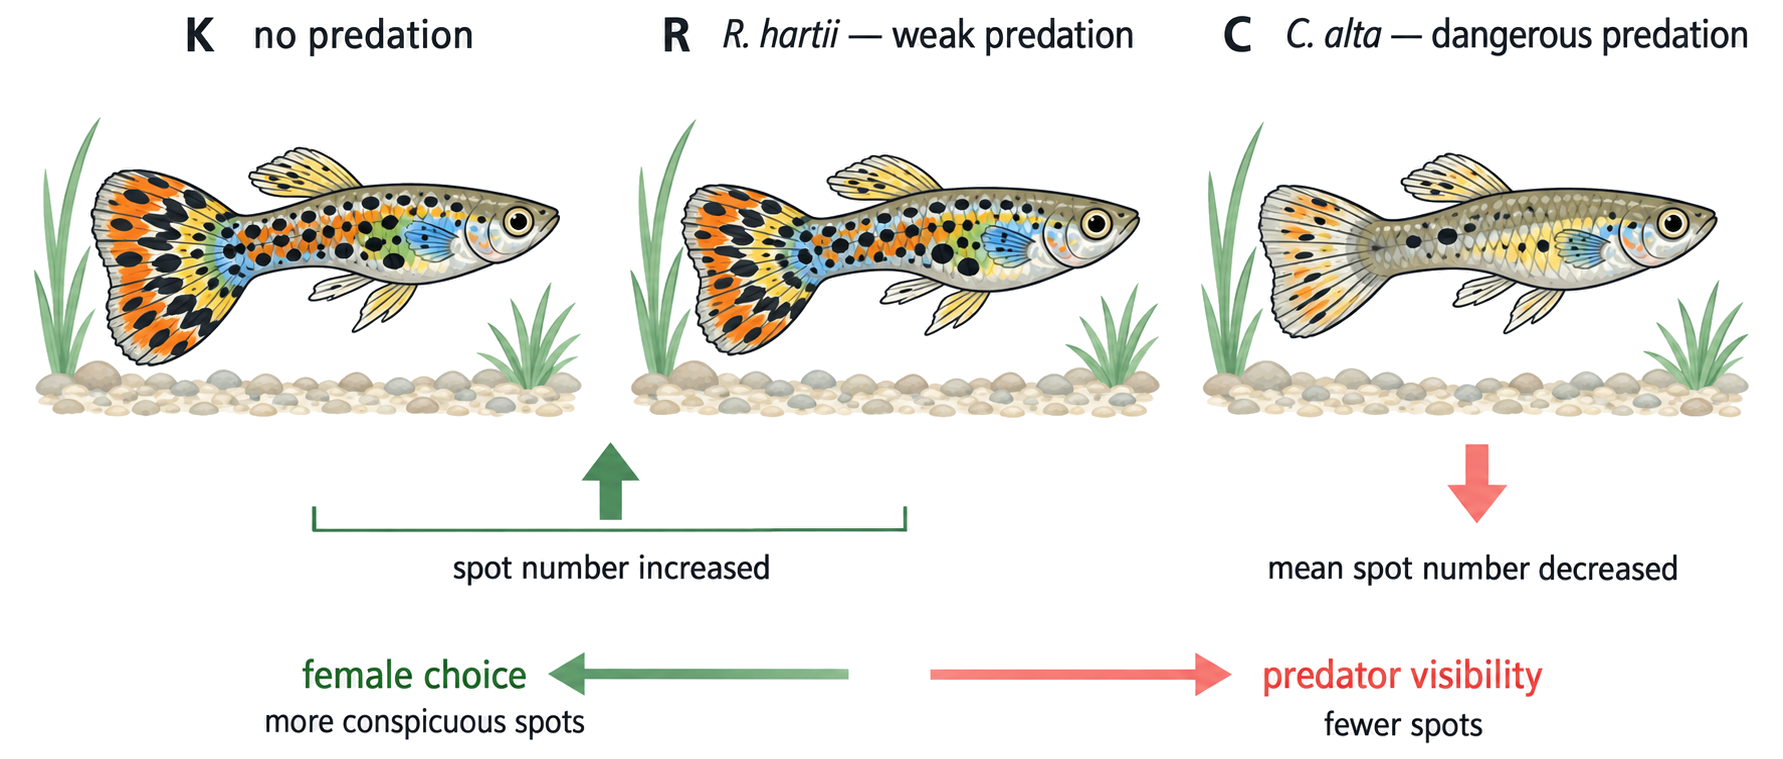
John Endler experimented on populations of guppies (Poecilia reticulata) with different colouration. A male guppy fish is shown with large spots, which makes the fish more attractive to females, but more visible to predators.
The table shows the male colouration of guppy fish and number of predators in three different ponds.
\begin{tabular}{|l|l|l|l|}
\hline & Predator X & Predator Y & Male guppy colouration \\
\hline Pond 1 & 12 & 0 & Large colourful spots \\
\hline Pond 2 & 15 & 0 & Medium colourful spots \\
\hline Pond 3 & 5 & 17 & None/very small drab spots \\
\hline
\end{tabular}
What can be concluded from the data?
There is a positive correlation between numbers of predator X and size of spots.
Predator Y has least influence on colouration.
There is a negative correlation between number of predators and size of spots.
There is no sexual selection.
C
Core D4.1 examples follow the same causal route: heritable variation exists, a selection pressure acts, individuals differ in fitness, and alleles linked to higher reproduction become more common. Endler’s guppies and sexual selection are evidence versions of the same chain.
Core natural-selection exam answers should never stop at “the best adapted survive.” They need the chain: heritable variation exists, a named pressure acts, some individuals have higher fitness, and their alleles become more common over generations. Use this for abiotic pressure, overproduction, sexual selection, and Endler-style data.