Q BankQuestion BankDocsDocuments

D3.2 Inheritance

Inheritance explains how alleles, chromosomes, meiosis, pedigrees, linkage, variation and statistical tests predict genetic outcomes across generations in inheritance problems.

Syllabus
First assessment 2025
Topic
D3.2
Level
HL

Gamete Fusion Restores Diploid Number

Haploid gametes carry one chromosome set; fusion of two gametes makes a diploid zygote with two sets.

Meiosis prevents chromosome doubling; fertilization combines one maternal and one paternal set; the life cycle alternates reduction and restoration. Trace the allele combination through the stated biological mechanism before predicting the result.

Track n through gamete formation; then track fusion and the first embryo cell.; compare the stated alleles and outcome

Human sperm and ova each carry 23 chromosomes; fusion produces a zygote with 46. This gives a concrete prediction from the stated parental information.

Fusion combines two haploid nuclei; it does not duplicate one gamete. Interpret the result within the stated inheritance model and its sample or environmental limits.

Haploid gametes + fusion = diploid

Assessment in practice

1 marks
How it is assessed

This objective is assessed through multiple choice, commonly using Identify.

Command terms

Identify

What earns marks

Build the answer around this relationship: Gametes are haploid so fusion can restore the diploid number.

Representative question

Question 1

[Maximum number: 1]

For what reason do gametes contain only one allele of each gene?

A

To prevent inbreeding in a population

B

Haploid cells contain only one set of chromosomes

C

The two alleles of a gene are separated during mitosis

D

Crossing over will always produce one allele of a gene

Genetic Crosses Predict Offspring Combinations

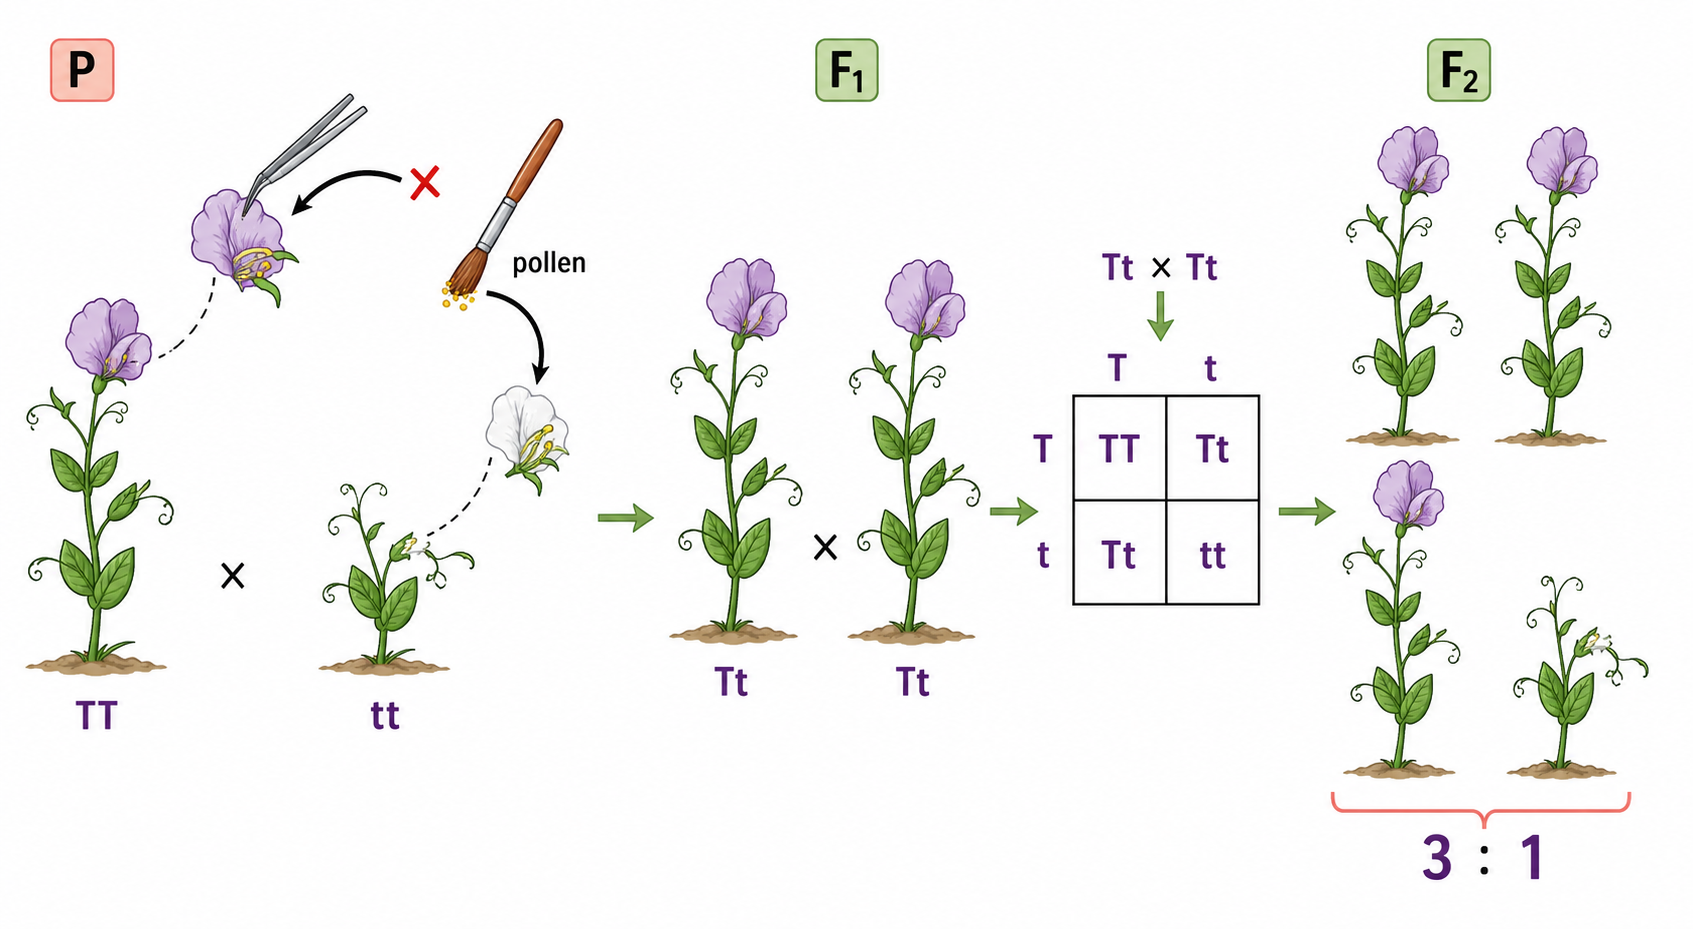
A genetic cross compares parental alleles to predict possible offspring genotypes and phenotypes.

Each parent contributes one allele through a gamete; a Punnett square lists combinations; dominance or another allele rule maps genotype to phenotype. Trace the allele combination through the stated biological mechanism before predicting the result.

Write parental genotypes; list gametes; combine them; interpret the phenotype rule.; compare the stated alleles and outcome

Aa × Aa gives AA, Aa, Aa, aa, so a recessive phenotype is expected in about one quarter. This gives a concrete prediction from the stated parental information.

A ratio is an expectation, not a guarantee in a small family. Interpret the result within the stated inheritance model and its sample or environmental limits.

Genetic crosses in flowering plants

Assessment in practice

1 marks
How it is assessed

This objective is assessed through structured response, commonly using Identify.

Command terms

Identify

What earns marks

Build the answer around this relationship: Parental genotypes determine the gametes available in a cross.

Representative question

Question 1

[Maximum number: 3]

L. purpureus can have purple or white flowers. Two pure-breeding varieties were crossed: HA 4 with white flowers and GL 424 with purple flowers. All of the F1F_{1} plants had purple flowers. The F1F_{1} plants were self-pollinated to produce an F2F_{2} generation. There were 97 plants with purple flowers and 38 plants with white flowers in the F2F_{2} generation.

Using a Punnett grid, explain the results of this cross.

Genotype Is an Allele Combination

A genotype is the allele combination an individual carries at one or more loci.

Alleles arrive in gametes; genotype records inherited information before environment and gene interactions shape the phenotype. Trace the allele combination through the stated biological mechanism before predicting the result.

Name the locus; then distinguish homozygous from heterozygous combinations.; compare the stated alleles and outcome

At a locus with A and a, AA and aa are homozygous while Aa is heterozygous. This gives a concrete prediction from the stated parental information.

Genotype is not the visible trait; different genotypes can share a phenotype. Interpret the result within the stated inheritance model and its sample or environmental limits.

Genotype exam focus

Assessment in practice

1 marks
How it is assessed

This objective is assessed through structured response, commonly using Identify / Distinguish / Define.

Command terms

Identify / Distinguish / Define

What earns marks

Build the answer around this relationship: A genotype records the alleles an organism carries.

Representative question

Question 1

[Maximum number: 1]

Define the term genotype.

Phenotype Combines Genes and Environment

A phenotype is an expressed trait produced by genotype interacting with environmental conditions.

Gene products influence development; nutrition, temperature and light can modify expression or function; one genotype can yield different outcomes. Trace the allele combination through the stated biological mechanism before predicting the result.

Separate inherited alleles from the conditions in which they are expressed.; compare the stated alleles and outcome

The same hydrangea genotype can produce different flower colours when soil pH changes pigment chemistry. This gives a concrete prediction from the stated parental information.

Environmental influence does not make genes irrelevant. Interpret the result within the stated inheritance model and its sample or environmental limits.

Phenotype exam focus

Assessment in practice

2 marks
How it is assessed

This objective is assessed through structured response, commonly using Identify.

Command terms

Identify

What earns marks

Build the answer around this relationship: Phenotype means the expressed or observable characteristic.

Representative question

Question 1

[Maximum number: 2]

Identify the phenotypes of each part of the phenotypic ratio.

\begin{tabular}{|l|l|}
\hline Ratio & Phenotypes \\
\hline 9 & \\
\hline 3 & \\
\hline 3 & \\
\hline 1 & \\
\hline
\end{tabular}

Dominance Masks a Recessive Allele

A dominant allele affects the phenotype in a heterozygote; the recessive phenotype appears only when no dominant allele is present in the model.

One expressed allele can provide enough product; a recessive allele can remain hidden in a heterozygote and still be inherited. Trace the allele combination through the stated biological mechanism before predicting the result.

Read genotype first: AA and Aa show the dominant phenotype; aa is recessive.; compare the stated alleles and outcome

Two carriers Aa × Aa can have an aa child even though neither parent shows the trait. This gives a concrete prediction from the stated parental information.

Dominant does not mean common, stronger, or advantageous. Interpret the result within the stated inheritance model and its sample or environmental limits.

Dominant and recessive alleles

Assessment in practice

1–2 marks
How it is assessed

This objective is assessed through structured response, commonly using Identify / Explain / Deduce.

Command terms

Identify / Explain / Deduce

What earns marks

Build the answer around this relationship: Dominant alleles are expressed in heterozygotes.

Representative question

Question 1

[Maximum number: 4]

Many genetic diseases are due to recessive alleles of autosomal genes that code for an enzyme. Using a Punnett grid, explain how parents who do not show signs of such a disease can produce a child with the disease.

Plasticity Lets One Genotype Respond Differently

Phenotypic plasticity is the ability of one genotype to produce different phenotypes in different environments.

Environmental signals alter development, physiology or expression; plasticity can help under changing conditions but has limits and costs. Trace the allele combination through the stated biological mechanism before predicting the result.

Compare the same genotype across environments before attributing a difference to alleles.; compare the stated alleles and outcome

One plant genotype may form broad shade leaves and smaller sun leaves. This gives a concrete prediction from the stated parental information.

Plasticity is not a new mutation and has limits. Interpret the result within the stated inheritance model and its sample or environmental limits.

Phenotypic plasticity

Assessment in practice

1 marks
How it is assessed

This objective is assessed through multiple choice.

What earns marks

Build the answer around this relationship: One genotype can produce different phenotypes in different environments.

Representative question

Question 1

[Maximum number: 1]

Scientists incubated larvae of the moth Utetheisa ornatrix at either 15C15^{\circ} \mathrm{C} or 22C22^{\circ} \mathrm{C} until they hatched. They found the hatched moths had different wing colour patterns due to phenotypic plasticity.

Moth from larvae incubated at \(15^{\circ

Moth from larvae incubated at \(22^{\circ

Which of the following explains the observed differences in wing colour?

A

Colder temperatures induce mutations in genes for wing colour.

B

The expression of genes for wing colour is affected by temperature.

C

A mutation makes moths less visible to predators in cold climates.

D

Wing colour is the result of polygenic inheritance.

PKU Links Allele, Metabolism and Diet

Phenylketonuria results when reduced phenylalanine hydroxylase activity lets phenylalanine accumulate; diet can reduce severity.

A recessive genotype lowers enzyme function; conversion to tyrosine is disrupted; restricting dietary phenylalanine reduces substrate load. Trace the allele combination through the stated biological mechanism before predicting the result.

Trace allele; enzyme activity; metabolite level; intervention; phenotype.; compare the stated alleles and outcome

A child with two disease alleles follows a low-phenylalanine diet, keeping blood levels safer. This gives a concrete prediction from the stated parental information.

Diet changes the phenotype but not the inherited alleles. Interpret the result within the stated inheritance model and its sample or environmental limits.

Phenylketonuria (PKU)

Assessment in practice

2–3 marks
How it is assessed

This objective is assessed through essay response, commonly using Explain / Outline.

Command terms

Explain / Outline

What earns marks

Build the answer around this relationship: PKU is usually autosomal recessive, so carriers can be unaffected.

Representative question

Question 1

[Maximum number: 4]

Discuss the causes and treatments of phenylketonuria.

SNPs and Multiple Alleles Create Variation

A SNP is a common one-base DNA difference; multiple alleles are variants of one locus present in a population.

A base change may affect coding, regulation or nothing observable; a diploid person carries at most two alleles even when a population has many. Trace the allele combination through the stated biological mechanism before predicting the result.

Separate population allele variety from the two alleles in one individual.; compare the stated alleles and outcome

The ABO locus has three common alleles, while one person may carry only IA and IB. This gives a concrete prediction from the stated parental information.

A SNP is not automatically harmful or visible. Interpret the result within the stated inheritance model and its sample or environmental limits.

SNPs and multiple alleles

Assessment in practice

1 marks
How it is assessed

This objective is assessed through multiple choice, commonly using Identify.

Command terms

Identify

What earns marks

Build the answer around this relationship: An SNP is variation at a single nucleotide position.

Representative question

Question 1

[Maximum number: 1]

Which statement defines alleles?

A

They are the different forms of a gene that have the same effect on the phenotype.

B

They are the similar forms of a gene in different positions of a chromosome.

C

They are the various forms of a gene with slight differences in their base sequences.

D

They are the different forms of a gene coding for identical polypeptide chains.

ABO Blood Groups Use Codominance

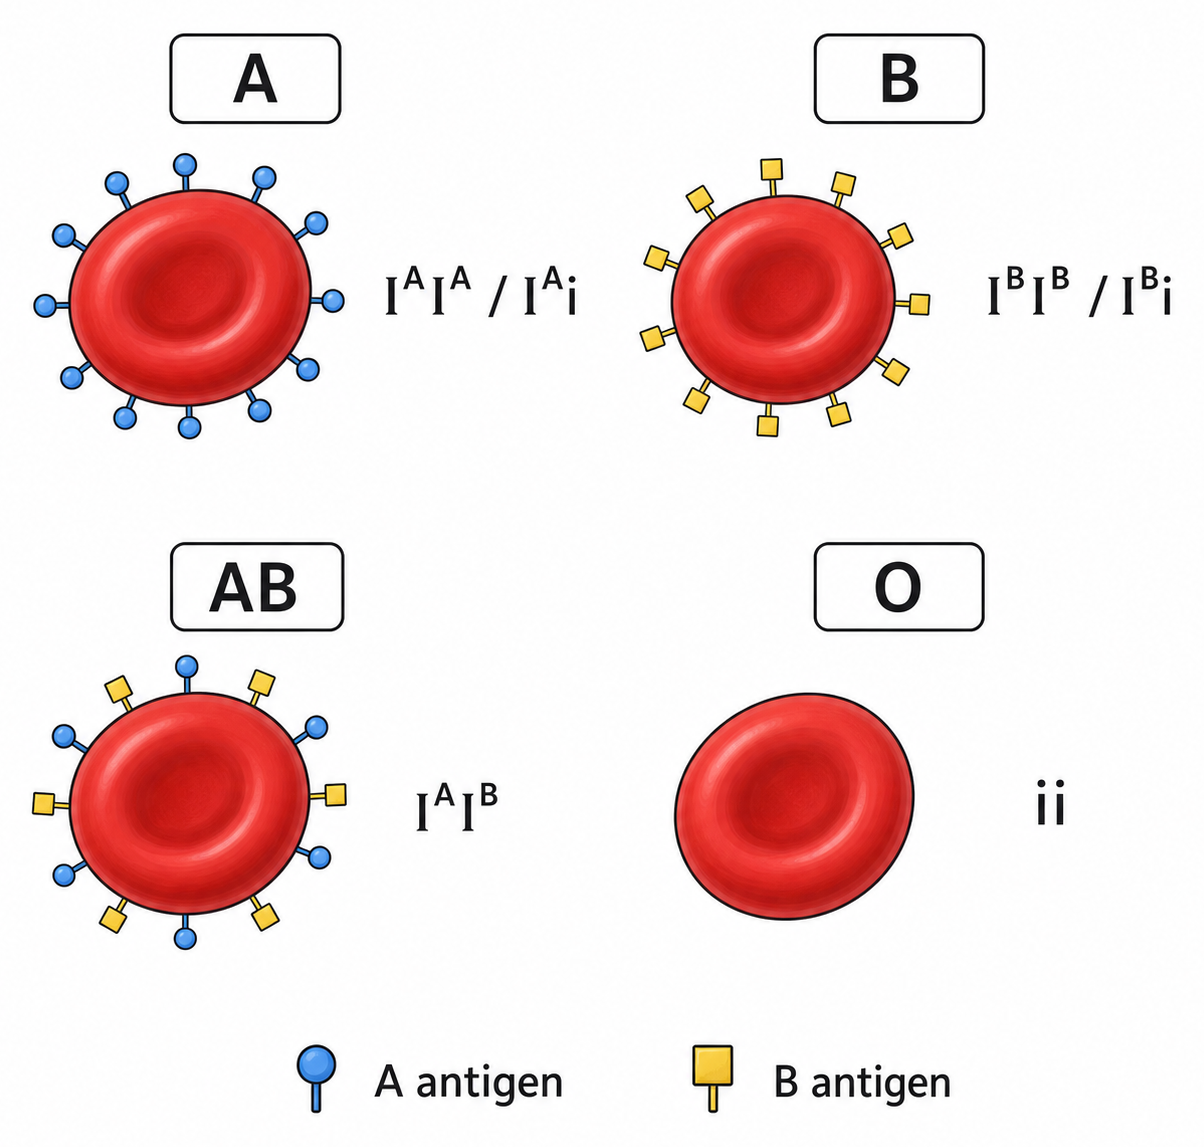
ABO phenotype is determined by IA, IB and i: IA and IB are codominant, while i is recessive to either.

IA makes A antigen; IB makes B; i makes neither; IAIB therefore displays both antigens. Trace the allele combination through the stated biological mechanism before predicting the result.

List the two alleles; apply dominance; identify antigens and phenotype.; compare the stated alleles and outcome

IAi × IBi can produce AB, A, B or O offspring. This gives a concrete prediction from the stated parental information.

Blood type requires alleles from both parents. Interpret the result within the stated inheritance model and its sample or environmental limits.

ABO blood groups

Assessment in practice

1 marks
How it is assessed

This objective is assessed through structured response, commonly using Describe / State / Identify.

Command terms

Describe / State / Identify / Outline

What earns marks

Build the answer around this relationship: IA and IB are codominant in blood group AB.

Representative question

Question 1

[Maximum number: 9]

Describe the inheritance of ABO blood groups.

Incomplete Dominance Differs from Codominance

Incomplete dominance gives an intermediate heterozygote; codominance expresses both allelic products in the heterozygote.

The distinction concerns how products appear; it is not one allele being stronger or DNA blending into a new allele. Trace the allele combination through the stated biological mechanism before predicting the result.

Ask whether the heterozygote is intermediate or shows both distinct products.; compare the stated alleles and outcome

Red × white snapdragons can give pink; IAIB blood cells show both A and B antigens. This gives a concrete prediction from the stated parental information.

An intermediate appearance does not merge the alleles. Interpret the result within the stated inheritance model and its sample or environmental limits.

Incomplete dominance and codominance

Assessment in practice

1 marks
How it is assessed

This objective is assessed through multiple choice, commonly using Identify / Describe.

Command terms

Identify / Describe

What earns marks

Build the answer around this relationship: Incomplete dominance produces an intermediate heterozygote phenotype.

Representative question

Question 1

[Maximum number: 1]

A Mirabilis jalapa plant with red flowers was crossed with one with white flowers. All plants in the F1 generation had pink flowers. What phenotype ratio would be expected in the F2 generation?

A

100 % pink

B

50 % red and 50 % white

C

25 % white, 50 % pink and 25 % red

D

75 % red and 25 % white

Sex Determination Uses a Simplified Chromosome Model

In the simplified human model, XX and XY are associated with female and male pathways, with Y-linked SRY initiating testes development.

SRY can trigger testes; testes hormones influence differentiation; chromosome combination is an initiating signal, not a complete developmental description. Trace the allele combination through the stated biological mechanism before predicting the result.

Trace chromosome combination; SRY; gonad; hormone effects.; compare the stated alleles and outcome

SRY expression on a Y chromosome begins testis development and changes the hormonal pathway. This gives a concrete prediction from the stated parental information.

The model does not define gender identity or every variation in sex development. Interpret the result within the stated inheritance model and its sample or environmental limits.

Sex determination

Assessment in practice

1 marks
How it is assessed

This objective is assessed through structured response, commonly using Identify / Explain.

Command terms

Identify / Explain

What earns marks

Build the answer around this relationship: Eggs normally contribute an X chromosome.

Representative question

Question 1

[Maximum number: 4]

Distinguish between autosomes and sex chromosomes in humans.

Haemophilia Shows X-Linked Recessive Inheritance

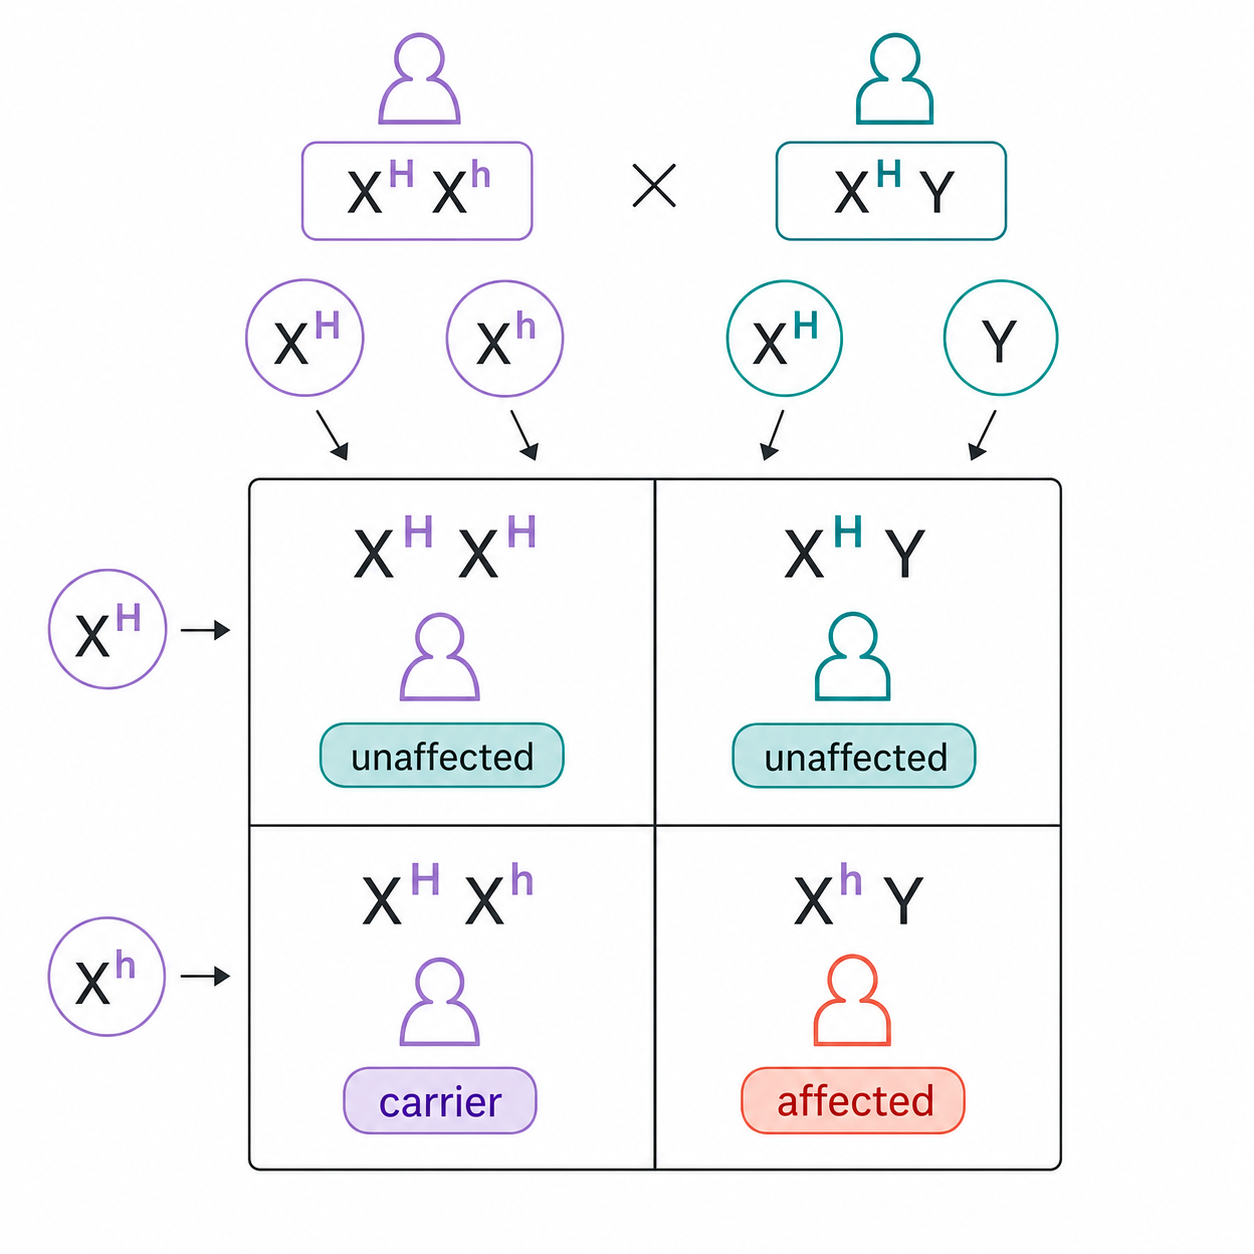
Haemophilia alleles on the X chromosome reduce a clotting factor; the recessive pattern makes affected XY individuals more common.

An XY individual has one X allele; an XX individual may have a second functional allele; a carrier mother can pass the allele to sons or daughters. Trace the allele combination through the stated biological mechanism before predicting the result.

Write X-linked genotypes and track which parent supplies each X.; compare the stated alleles and outcome

Carrier mother XH Xh and unaffected father XH Y can have an affected son Xh Y. This gives a concrete prediction from the stated parental information.

Probabilities describe a model, not one guaranteed child. Interpret the result within the stated inheritance model and its sample or environmental limits.

Haemophilia exam focus

Assessment in practice

1–3 marks
How it is assessed

This objective is assessed through structured response, commonly using Identify / Deduce / Explain.

Command terms

Identify / Deduce / Explain / Outline / State / Predict

What earns marks

Build the answer around this relationship: Males express an X-linked recessive allele if it is on their single X chromosome.

Representative question

Question 1

[Maximum number: 8]

Explain how males inherit hemophilia and how females can become carriers for the condition.

Pedigrees Turn Family Patterns into Evidence

A pedigree uses standard symbols and affected-status patterns to infer likely genotypes and inheritance modes.

Squares and circles show sexes; shading marks the trait; generations and unaffected carriers test dominant, recessive or sex-linked explanations. Trace the allele combination through the stated biological mechanism before predicting the result.

Start with the pattern; propose genotypes; reject models needing impossible transmissions.; compare the stated alleles and outcome

Two unaffected parents with an affected child of either sex make an autosomal recessive model plausible. This gives a concrete prediction from the stated parental information.

A pedigree rarely proves one model without penetrance and sample assumptions. Interpret the result within the stated inheritance model and its sample or environmental limits.

Pedigree charts

Assessment in practice

1 marks
How it is assessed

This objective is assessed through structured response, commonly using Identify / Deduce / Determine.

Command terms

Identify / Deduce / Determine / Draw / Calculate / State / Explain

What earns marks

Build the answer around this relationship: Pedigrees use affected and unaffected relatives to infer hidden genotypes.

Representative question

Question 1

[Maximum number: 2]

Explain how the pedigree chart shows that the dominant allele causing PKD is not on the X chromosome.

Continuous Variation Forms a Range

Continuous variation produces many intermediate values because multiple genes and environment influence the trait.

Polygenic effects add small contributions; nutrition and other conditions shift outcomes; populations show a distribution rather than a few classes. Trace the allele combination through the stated biological mechanism before predicting the result.

Look for a measurable range and ask whether many genes and environment contribute.; compare the stated alleles and outcome

Human height forms a broad range, and nutrition can shift an individual’s height. This gives a concrete prediction from the stated parental information.

A smooth distribution can still have a strong genetic component. Interpret the result within the stated inheritance model and its sample or environmental limits.

Continuous variation

Assessment in practice

1–3 marks
How it is assessed

This objective is assessed through structured response, commonly using Identify / State / Outline.

Command terms

Identify / State / Outline / Distinguish / Explain

What earns marks

Build the answer around this relationship: Continuous variation shows a range rather than separate phenotype classes.

Representative question

Question 1

[Maximum number: 7]

Explain the reasons for variation in human height.

Box Plots Compare Data Distributions

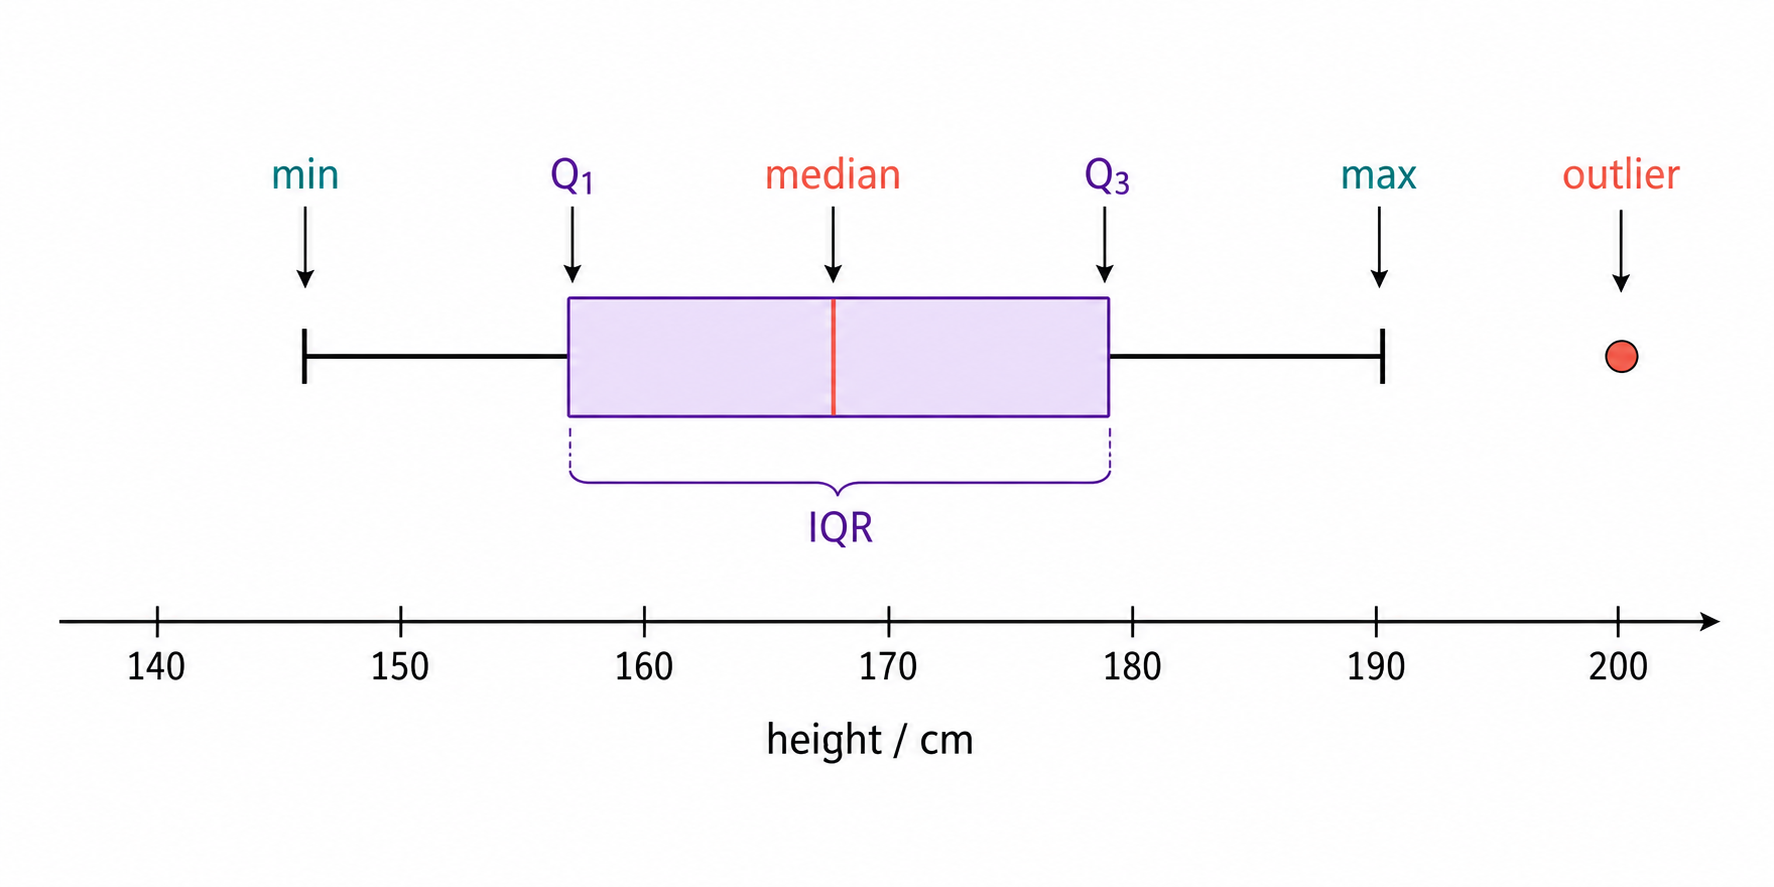
A box-and-whisker plot summarizes a dataset with median, quartiles, spread and possible outliers.

The median marks centre; the box spans the middle 50%; whiskers follow a stated rule; centre and spread should be compared together. Trace the allele combination through the stated biological mechanism before predicting the result.

Read the legend; compare medians, interquartile ranges and outliers on the same scale.; compare the stated alleles and outcome

If A has median 12 and B median 9, A is higher in centre; a wider A box means greater middle spread. This gives a concrete prediction from the stated parental information.

Whisker endpoints are not automatically outliers. Interpret the result within the stated inheritance model and its sample or environmental limits.

Box-and-whisker plots

Assessment in practice

1 marks
How it is assessed

This objective is assessed through data analysis, commonly using State / Determine / Deduce.

Command terms

State / Determine / Deduce

What earns marks

Build the answer around this relationship: The median is the central line, not the mean.

Representative question

Question 1

[Maximum number: 3]

Using the data, deduce whether the incidence of CHF or the incidence of anemia has a greater effect on the blood hepcidin concentration.

Retrieve the Core Inheritance Route

Core D3.2 is secure when the student can move from allele rules into predictions and evidence: gametes form genotypes, genotypes can produce phenotypes, different dominance patterns need different notation, and pedigrees or plots require evidence-based interpretation.

  • haploid gametes carry one allele and fertilization restores a diploid genotype
  • dominance, codominance, incomplete dominance, environment, and plasticity affect the observed trait
  • PKU, ABO, sex determination, and haemophilia use different inheritance rules and notation
  • pedigrees infer inheritance patterns and box plots summarize continuous variation

Solve Core Inheritance Questions

Core inheritance exam questions reward disciplined reasoning. First identify the inheritance rule, then write the correct notation or evidence, then state the phenotype, ratio, or conclusion. This prevents the common mistake of writing definitions without solving the genetic problem.

  • Use allele and genotype notation correctly for monohybrid, ABO, PKU, haemophilia, and sex-determination contexts.
  • Connect genotype, dominance pattern, environment, or plasticity to phenotype.
  • Use pedigree or box-plot evidence to justify an inheritance or variation conclusion.

Segregation and Assortment Set Gamete Probabilities

HL only

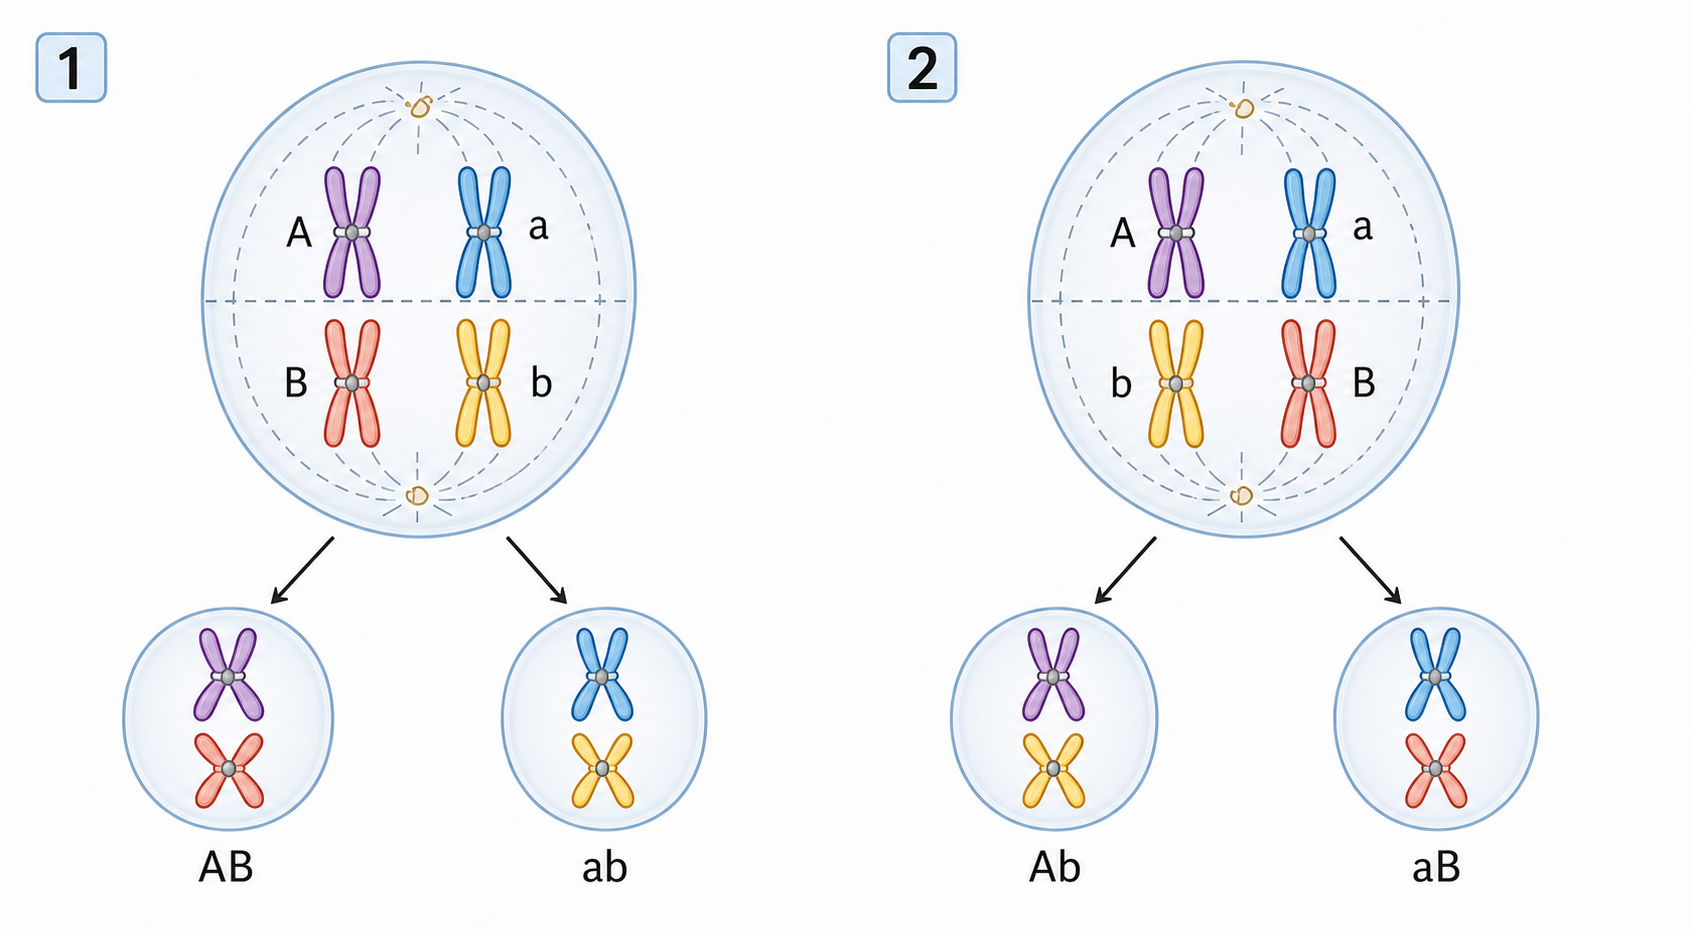
Segregation separates alleles at a locus; independent assortment treats unlinked chromosome pairs as separate probability choices.

Homologues separate so each gamete receives one allele; different chromosome orientations combine alleles when loci are unlinked. Trace the allele combination through the stated biological mechanism before predicting the result.

Choose one allele per locus; multiply probabilities only when linkage is not expected.; compare the stated alleles and outcome

An AaBb parent can produce AB, Ab, aB and ab gametes equally in the unlinked model. This gives a concrete prediction from the stated parental information.

Linked loci do not assort independently. Interpret the result within the stated inheritance model and its sample or environmental limits.

Segregation and independent assortment

HL only

Assessment in practice

1–6 marks
How it is assessed

This objective is assessed through structured response, commonly using Outline / Determine / Identify.

Command terms

Outline / Determine / Identify

What earns marks

Build the answer around this relationship: Segregation gives each gamete one allele from each pair.

Representative question

Question 1

[Maximum number: 6]

Outline the relationship between Mendel's law of independent assortment and meiosis.

Dihybrid Crosses Combine Two Rules

HL only

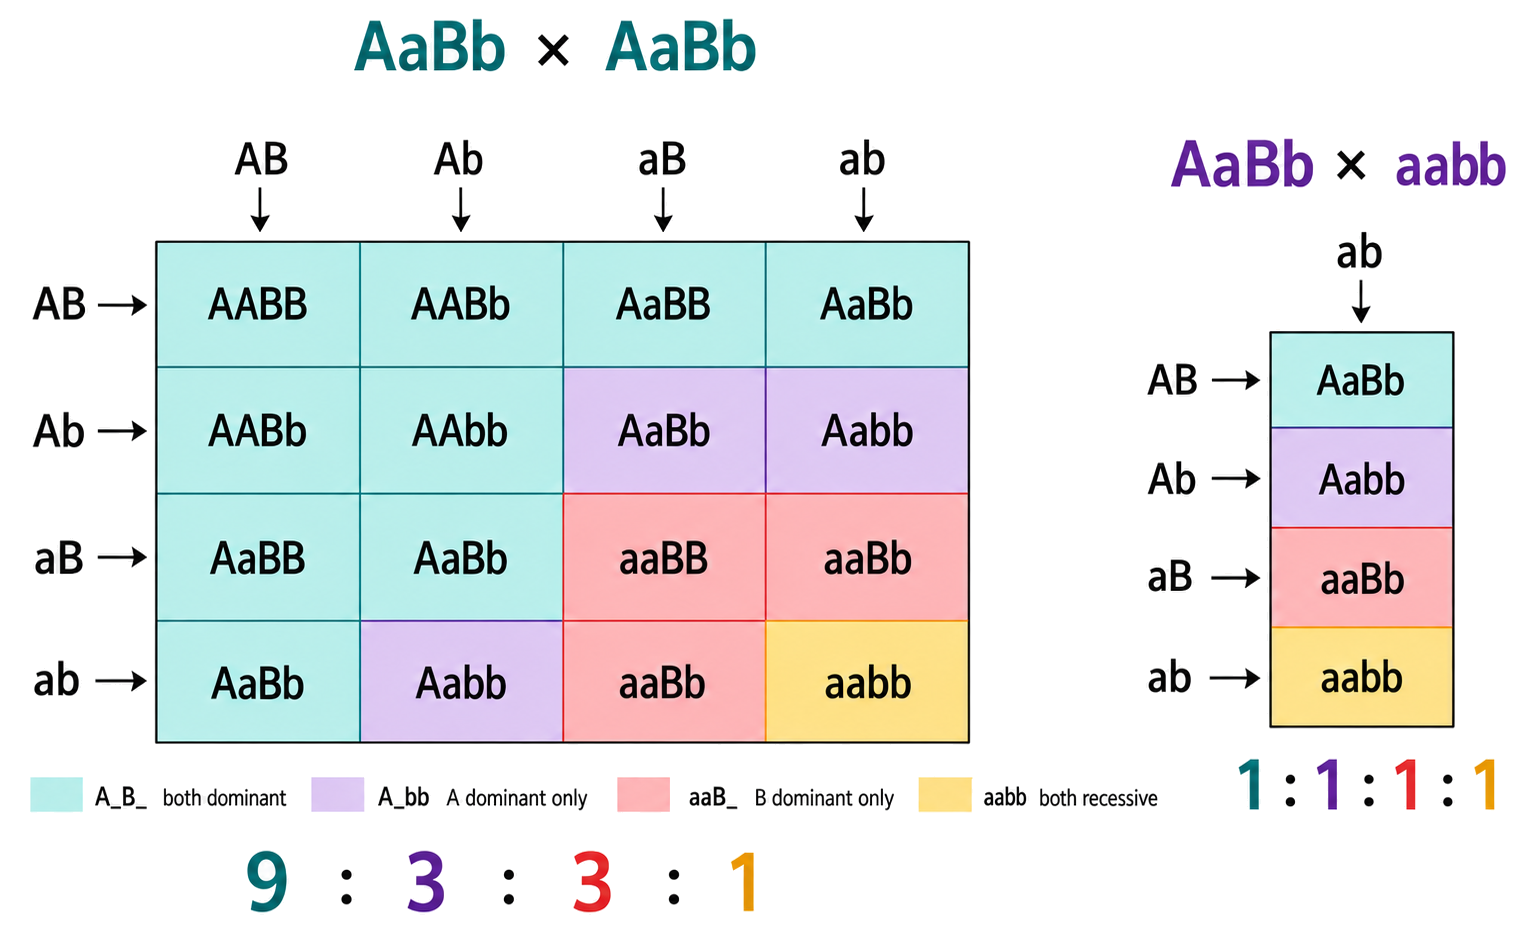
A dihybrid cross predicts offspring for two loci by combining possible gametes and allele interactions.

For unlinked genes, product rules combine single-locus probabilities; 9:3:3:1 requires complete dominance and other assumptions. Trace the allele combination through the stated biological mechanism before predicting the result.

Solve each locus; combine probabilities; check linkage and dominance assumptions.; compare the stated alleles and outcome

AaBb × AaBb gives 9:3:3:1 only under the standard unlinked complete-dominance model. This gives a concrete prediction from the stated parental information.

The ratio changes with linkage, epistasis, viability or sample size. Interpret the result within the stated inheritance model and its sample or environmental limits.

Dihybrid crosses

HL only

Assessment in practice

1–2 marks
How it is assessed

This objective is assessed through structured response, commonly using Determine / Identify / State.

Command terms

Determine / Identify / State / Explain / Predict

What earns marks

Build the answer around this relationship: A dihybrid cross follows two genes simultaneously.

Representative question

Question 1

[Maximum number: 3]

The expected ratio of phenotypes in the offspring of a cross between a plant with narrow, yellow leaves and a plant heterozygous for the genes for leaf width and colour is 1: 1: 1: 1.

Justify this expected ratio using a Punnett grid or other diagram.

A Gene Locus Is a Chromosomal Position

HL only

A gene locus is the fixed chromosomal position occupied by a gene; alleles are alternative DNA versions there.

Homologues carry corresponding loci, allowing maternal and paternal alleles to be compared; locus position is distinct from sequence. Trace the allele combination through the stated biological mechanism before predicting the result.

Mark the locus on both homologues before naming alleles.; compare the stated alleles and outcome

ABO alleles occupy the same locus on the homologous pair although their sequences differ. This gives a concrete prediction from the stated parental information.

Same locus does not mean same allele. Interpret the result within the stated inheritance model and its sample or environmental limits.

Linked Genes Travel Together More Often

HL only

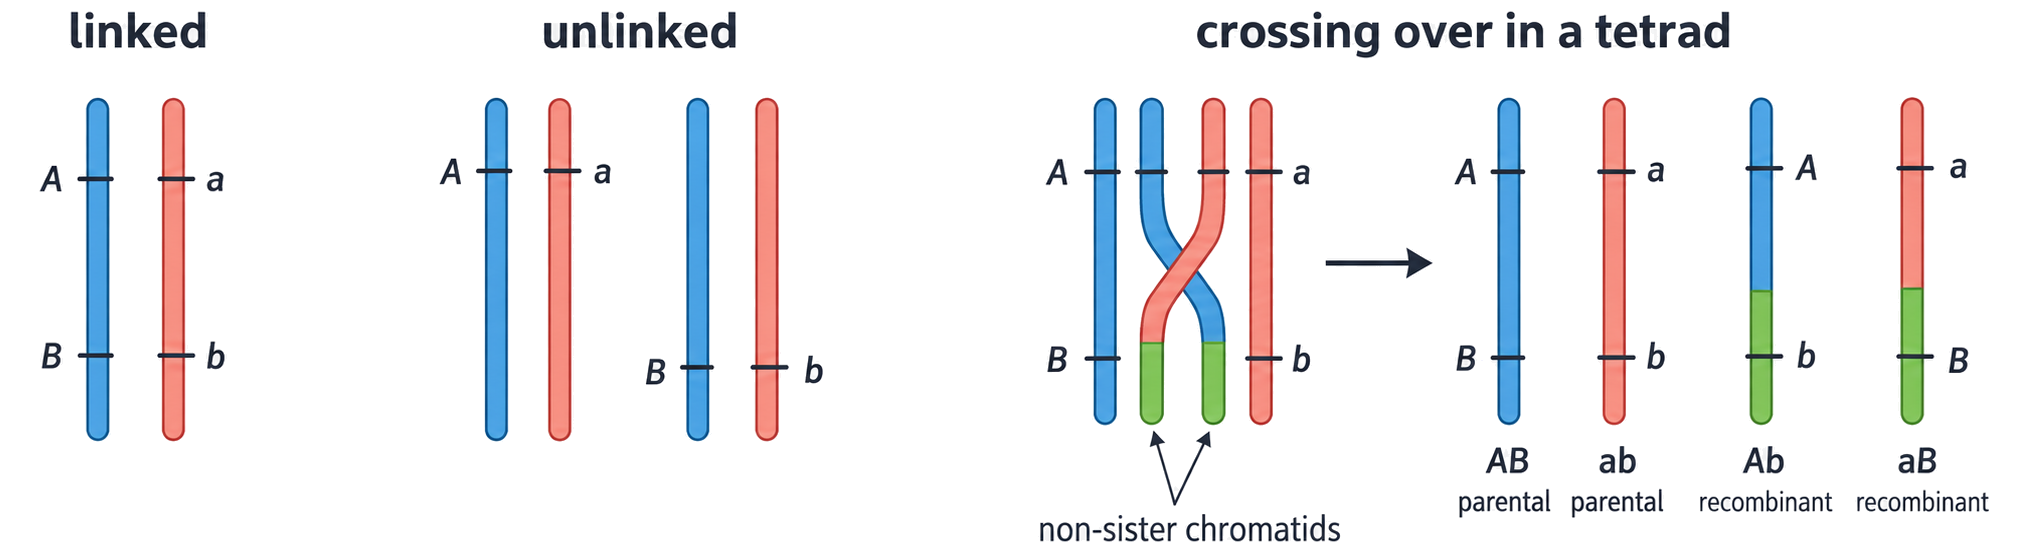
Autosomal genes close together on one chromosome are linked and tend to be inherited together because crossing over between them is less frequent.

Recombination probability rises with distance; linked pairs therefore produce more parental than recombinant gametes when close. Trace the allele combination through the stated biological mechanism before predicting the result.

Compare parental and recombinant classes; an excess of parental types suggests linkage.; compare the stated alleles and outcome

If AB and ab are parental, crossing over can create Ab and aB, but parental classes remain more common. This gives a concrete prediction from the stated parental information.

Linkage is not absolute; crossing over can separate loci. Interpret the result within the stated inheritance model and its sample or environmental limits.

Autosomal gene linkage

HL only

Assessment in practice

1–2 marks
How it is assessed

This objective is assessed through structured response, commonly using Identify / Define / Compare.

Command terms

Identify / Define / Compare / Explain / Distinguish / Outline

What earns marks

Build the answer around this relationship: Linked autosomal genes are on the same non-sex chromosome.

Representative question

Question 1

[Maximum number: 3]

Outline how it can be shown that the genes for shell base colour (Cc) and presence or absence of bands (Bb) are linked.

Recombinants Reveal Crossing Over

HL only

Recombinant gametes carry allele combinations different from parental arrangements because homologues exchanged segments.

A crossover changes which alleles travel together; recombinant frequency estimates how often this occurs and indicates relative map distance. Trace the allele combination through the stated biological mechanism before predicting the result.

Identify parental classes; count new combinations; calculate their proportion if required.; compare the stated alleles and outcome

With 100 offspring, 18 recombinant gives an estimated frequency of 18%, subject to sampling uncertainty. This gives a concrete prediction from the stated parental information.

The simple mapping frequency cannot exceed 50%. Interpret the result within the stated inheritance model and its sample or environmental limits.

Recombinants exam focus

HL only

Assessment in practice

1 marks
How it is assessed

This objective is assessed through multiple choice, commonly using Deduce / Identify.

Command terms

Deduce / Identify

What earns marks

Build the answer around this relationship: Recombinants differ from parental allele combinations.

Representative question

Question 1

[Maximum number: 1]

An individual is heterozygous for two linked genes ABab\frac{\mathrm{AB}}{\overline{\mathrm{ab}}}.

To investigate the frequency of crossing over, a test cross is carried out between the individual and another that is homozygous recessive for both genes. What are the possible recombinants in the offspring of this cross?

A

Abab\frac{\mathrm{Ab}}{\mathrm{ab}} and Abab\frac{\mathrm{Ab}}{\mathrm{ab}}

B

ABab\frac{\mathrm{AB}}{\mathrm{ab}} and AbaB\frac{\mathrm{Ab}}{\mathrm{aB}}

C

Abab\frac{\mathrm{Ab}}{\mathrm{ab}} and aBab\frac{\mathrm{aB}}{\mathrm{ab}}

D

AAaa\frac{\mathrm{AA}}{\mathrm{aa}} and BBbb\frac{\mathrm{BB}}{\mathrm{bb}}

Chi-Squared Tests an Expected Ratio

HL only

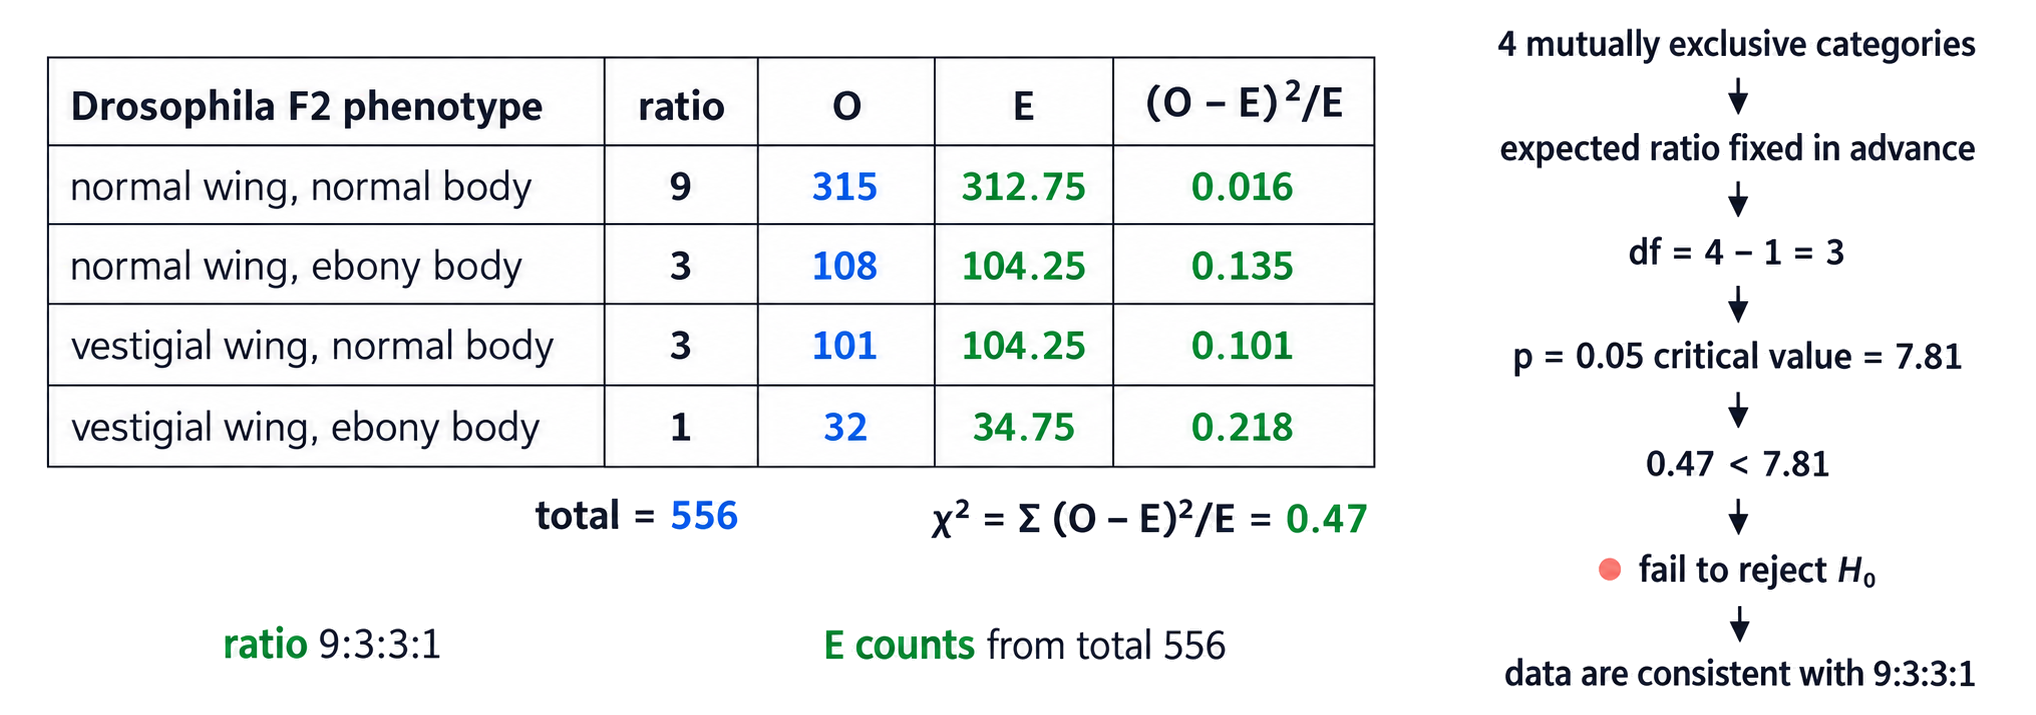
A chi-squared goodness-of-fit test compares observed counts with expected counts to judge whether deviations exceed sampling variation.

For each category calculate (observed−expected)²/expected; sum; use degrees of freedom and a critical value to test the null model. Trace the allele combination through the stated biological mechanism before predicting the result.

State the null; calculate χ²; choose degrees of freedom; make a threshold-based conclusion.; compare the stated alleles and outcome

A predicted 75:25 cross observed as 82:18 can be tested for a chance deviation. This gives a concrete prediction from the stated parental information.

A non-significant result does not prove the model, and significance does not identify the cause. Interpret the result within the stated inheritance model and its sample or environmental limits.

Chi-squared test

HL only

Assessment in practice

1–2 marks
How it is assessed

This objective is assessed through structured response.

What earns marks

Build the answer around this relationship: Chi-squared compares observed counts with expected counts.

Representative question

Question 1

[Maximum number: 2]

The chi-squared value was calculated as shown. Deduce, with reasons, whether the observed ratio differed significantly from the expected Mendelian ratio.

c2=Σ( Observed  Expected )2 Expected =1002.6c^{2}=\Sigma \frac{(\text { Observed }- \text { Expected })^{2}}{\text { Expected }}=1002.6

\begin{tabular}{|l|l|l|l|l|l|l|l|l|l|l|l|}
\hline & \multicolumn{11}{|c|}{Probability} \\
\hline Degrees of freedom & 0.995 & 0.975 & 0.20 & 0.10 & 0.05 & 0.025 & 0.02 & 0.01 & 0.005 & 0.002 & 0.001 \\
\hline 1 & 0.00004 & 0.001 & 1.642 & 2.706 & 3.841 & 5.024 & 5.412 & 6.635 & 7.879 & 9.550 & 10.828 \\
\hline 2 & 0.010 & 0.051 & 3.219 & 4.605 & 5.991 & 7.378 & 7.824 & 9.210 & 10.597 & 12.429 & 13.816 \\
\hline 3 & 0.072 & 0.216 & 4.642 & 6.251 & 7.815 & 9.348 & 9.837 & 11.345 & 12.838 & 14.796 & 16.266 \\
\hline 4 & 0.207 & 0.484 & 5.989 & 7.779 & 9.488 & 11.143 & 11.668 & 13.277 & 14.860 & 16.924 & 18.467 \\
\hline 5 & 0.412 & 0.831 & 7.289 & 9.236 & 11.070 & 12.833 & 13.388 & 15.086 & 16.750 & 18.907 & 20.515 \\
\hline 6 & 0.676 & 1.237 & 8.558 & 10.645 & 12.592 & 14.449 & 15.033 & 16.812 & 18.548 & 20.791 & 22.458 \\
\hline 7 & 0.989 & 1.690 & 9.803 & 12.017 & 14.067 & 16.013 & 16.622 & 18.475 & 20.278 & 22.601 & 24.322 \\
\hline
\end{tabular}

Retrieve the HL Inheritance Route

HL only

HL D3.2 is secure when chromosome behaviour explains the ratios: segregation and independent assortment produce unlinked dihybrid expectations, gene loci explain linkage, recombinants reveal crossing over, and chi-squared decides whether observed counts fit the expected model.

  • homologous chromosomes separate and random bivalent orientation assort unlinked genes
  • unlinked autosomal genes can produce 9:3:3:1 or 1:1:1:1 ratios
  • linked genes give more parental types and fewer recombinants after crossing over
  • observed counts are compared with expected ratios using df and p = 0.05

Solve HL Linkage and Chi-Squared Questions

HL only

HL inheritance transfer is about deciding whether the expected ratio should be Mendelian or linked, then testing the evidence. Start from meiosis and gene location, predict gametes or ratios, identify parental and recombinant classes, and use chi-squared when observed counts need a statistical conclusion.

  • Explain segregation and independent assortment from meiosis before using dihybrid ratios.
  • Use gene loci, linkage, crossing over, and recombinant frequency to interpret offspring classes.
  • Apply chi-squared with observed/expected values, degrees of freedom, p = 0.05, and a null-hypothesis conclusion.
ConceptIB Biology HL