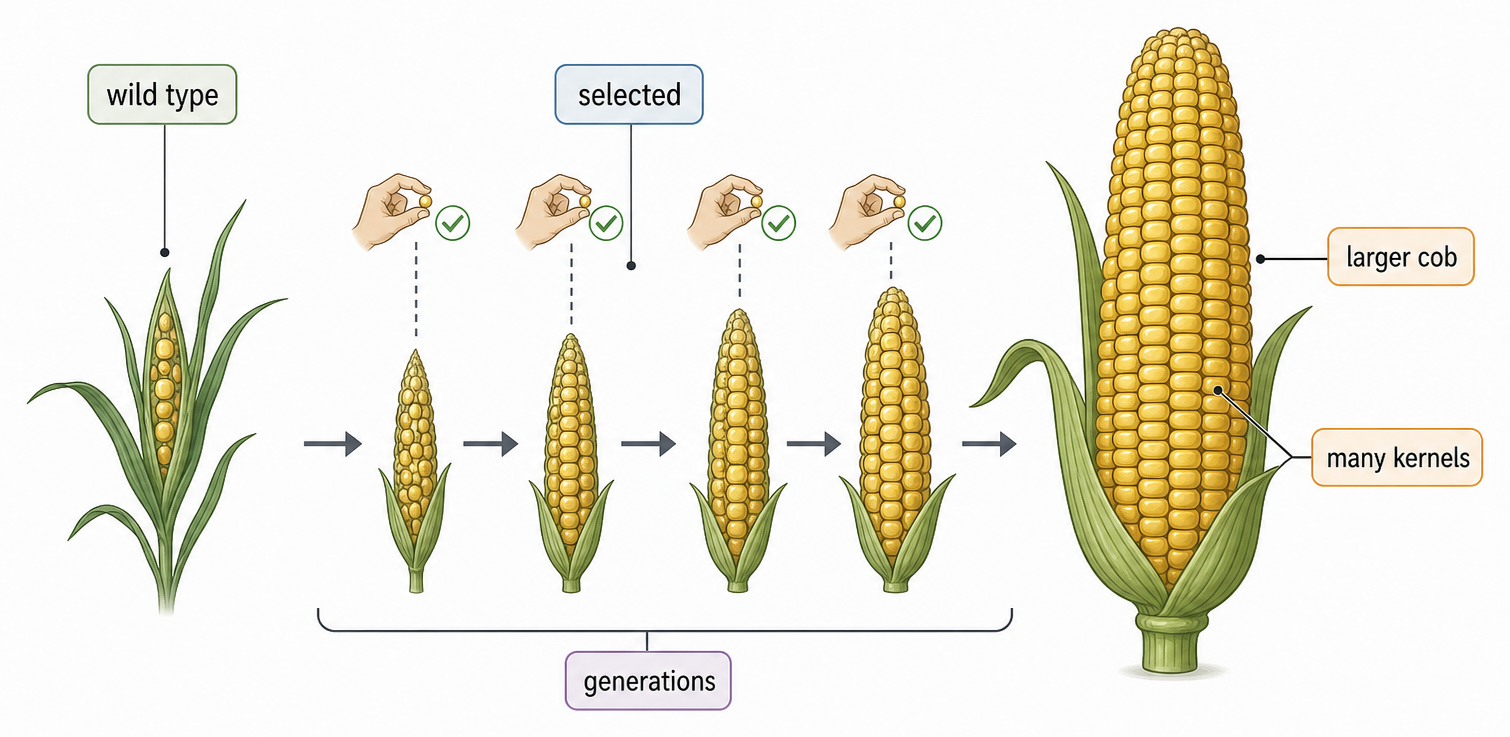
Natural selection explains how heritable variation, selection pressures, differential survival, reproduction and allele-frequency changes drive evolutionary adaptation in populations in evolving populations.
Syllabus
First assessment 2025
Topic
D4.1
Level
HL
Natural Selection Changes Populations Through Unequal Reproductive Success
Natural selection is differential survival and reproduction caused by heritable differences among individuals. Across generations, alleles associated with greater reproductive contribution can become more frequent.
Individuals in a population vary.
Some variation is heritable.
The environment creates selection pressures.
Heritable variants cause differences in survival or mating success.
Individuals leave different numbers of surviving offspring.
Allele frequencies change across generations.
Individuals are selected; populations evolve. An individual does not genetically adapt because it needs to—the frequency of inherited variants changes in descendants.
Mutation Creates New Alleles; Germ-Line Location Makes Them Heritable
Mutation location
What can inherit it?
Evolutionary consequence
germ-line cell or its precursor
gametes and potentially offspring
can add a new allele to the population gene pool
somatic cell
descendant cells within that individual
normally ends when the individual dies
Mutation is random with respect to what the organism needs. Selection is non-random in the sense that existing variants leave different numbers of offspring in a particular environment.
A new allele may be harmful, neutral or advantageous depending on phenotype and environment; mutation does not mean automatically beneficial or harmful.
Sexual Reproduction Rearranges Existing Alleles into New Genotypes
Process
Source of new combination
crossing over
homologous chromosomes exchange DNA between non-sister chromatids
independent assortment
maternal and paternal homologs enter gametes in varied combinations
random fertilization
one of many possible sperm fuses with one of many possible eggs
Sexual reproduction usually reshuffles existing alleles; mutation is the ultimate source of a completely new allele.
Recombination does not guarantee a better offspring. It creates varied genotypes on which environmental selection pressures can act.
Overproduction Makes Reproductive Success Unequal When Resources Are Limited
potential offspring production exceeds the number the environment can support → food, space, light, territories or mates become limiting → many individuals die or fail to reproduce → variants differ in representation among the offspring that breed
Competition type
Who competes?
Why it matters for selection
intraspecific
members of the same species
they share a niche and compete for very similar resources and mates
interspecific
members of different species
overlapping resource use can also change survival and reproduction
A roughly stable population size does not mean every offspring survives. High offspring production can be balanced by high pre-reproductive mortality.
Abiotic Conditions Select Existing Variants Without Regard to Population Density
Abiotic factor
Variant that could be favoured in one context
drought
lower water loss or deeper roots
salinity
ion exclusion or salt tolerance
temperature
enzymes and membranes that function at local extremes
light
leaf form or pigment investment suited to the light regime
pH
proteins and transport systems stable at local pH
A density-independent pressure can affect survival regardless of how crowded the population is, although its total impact may still differ among places and times.
The environment does not cause organisms to develop the needed inherited trait. It changes which already varying individuals contribute most to the next generation.
Fitness Means Alleles Reaching Future Generations, Not Strength or Longevity Alone
Individual outcome
Contribution to evolutionary fitness
survives but produces no surviving offspring
little or none
reproduces early and offspring later breed
high contribution
wins mates but offspring have low survival
mating success may not become high lifetime fitness
Fitness is relative to a particular environment. A phenotype advantageous during drought may be neutral or costly when water is abundant.
Better adapted does not mean perfect. Selection compares variants currently present and is constrained by trade-offs, ancestry and chance.
Only Heritable Differences Can Accumulate Across Generations
Feature
Acquired change
Heritable variant
origin
arises during one individual’s lifetime through use, injury or environment
encoded in inherited genetic or transmissible biological information
inheritance
usually not copied into gamete DNA
can be passed through gametes
population effect
ends with the individual
can change frequency across generations
Selection can act on a phenotype, but evolutionary change follows only when differences affecting reproductive success are heritable. Ordinary muscle gain or a scar is not inherited as a new DNA sequence.
Peppered-Moth Frequencies Changed When Camouflage Changed Survival
The population already contained pale and melanic heritable forms.
Soot darkened resting surfaces and reduced pale lichen cover in industrial areas.
Birds more often detected the less-camouflaged form.
Better-camouflaged moths survived and reproduced at a higher rate.
The allele associated with that form increased locally across generations.
When air pollution later declined and lichens returned, the direction of the camouflage advantage could reverse. Fitness belongs to a phenotype–environment relationship, not permanently to one colour.
Sexual Selection Rewards Traits That Increase Access to Mates
Route
Selection event
Example trait
mate choice
one sex preferentially mates with particular partners
bright plumage or complex courtship display
mating competition
individuals compete directly or indirectly for access
body size, weapons, territories or dominance behavior
heritable variation in display or competition trait → unequal mating success → unequal offspring contribution → associated alleles increase
Persistent differences in selected traits between sexes can produce sexual dimorphism, such as bright displaying males and more cryptic females.
A Mating Advantage Can Persist Despite a Survival Cost
Effect of an exaggerated ornament
Possible fitness consequence
more visible or energetically costly
lower survival through predation or resource cost
attractive display or honest condition signal
greater chance of mating
species-specific courtship signal
mating isolation from other populations
The trait can spread when its gain in reproductive success exceeds its survival cost. Fitness integrates the whole route to descendants, not survival alone.
Sexual selection names the pressure—competition for mates or mate choice—rather than competition for food or escape from predators.
A Selection Experiment Must Manipulate Pressure and Measure Reproductive Consequences
Design element
Selection experiment question
independent variable
which pressure is deliberately changed?
dependent variable
which phenotype, survival or mating outcome is measured?
controls
which habitat, starting population and observation conditions stay comparable?
replication
are multiple populations exposed to each treatment?
time
are enough generations observed for frequency change?
Random assignment and controlled treatments make a causal claim stronger; repeated measurements reveal whether a pattern persists rather than reflecting one generation of chance.
A simulation or enclosure simplifies nature. Its value depends on whether the manipulated pressure and measured fitness components represent the biological system.
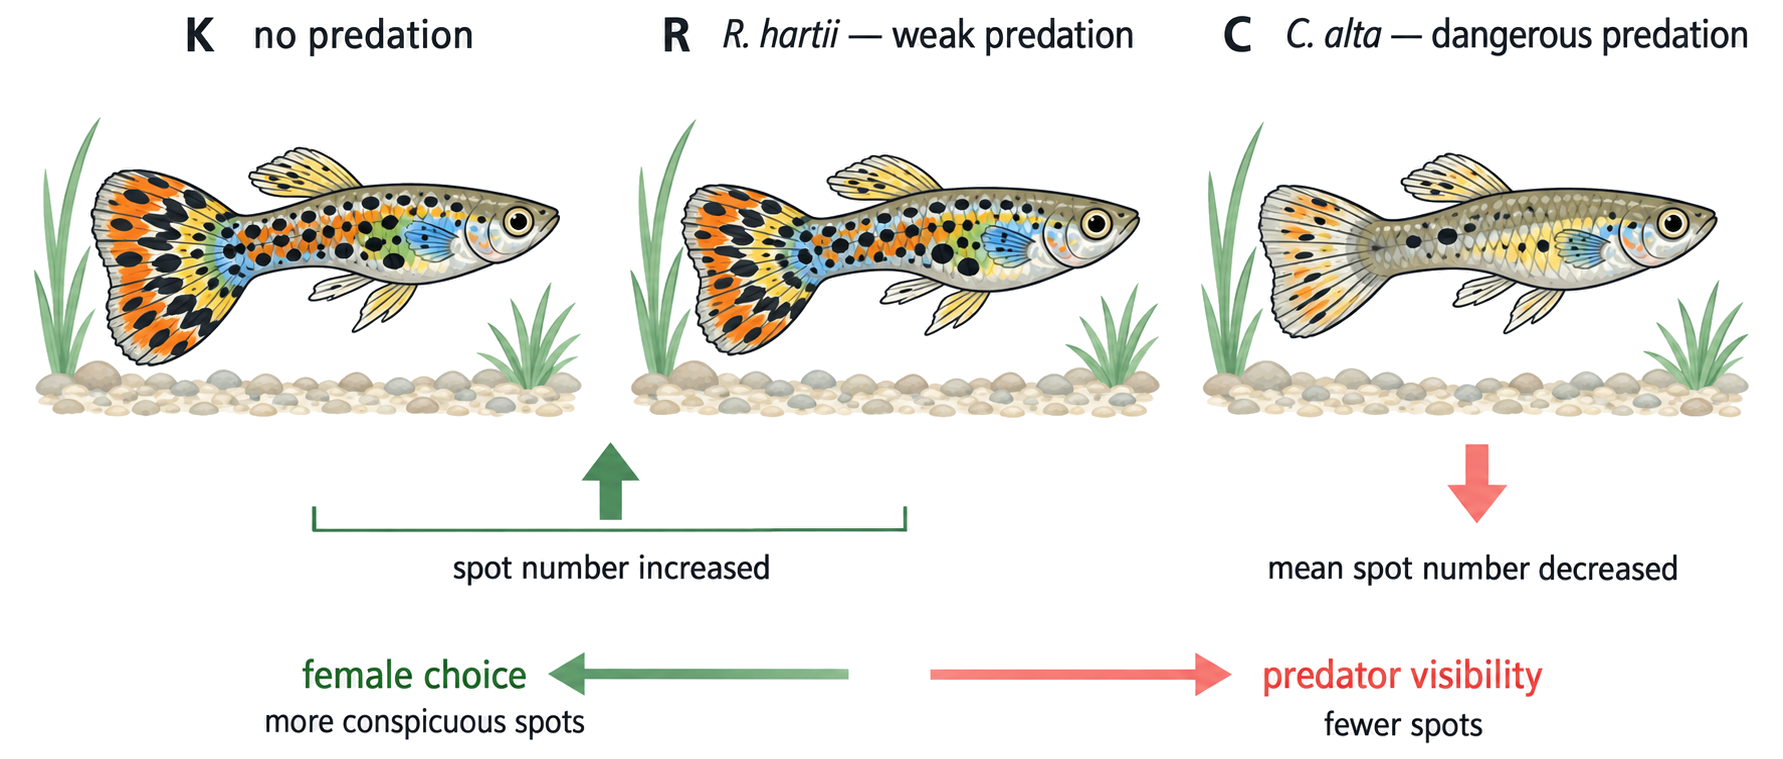
Endler Separated Predation Strength from Gravel Background
Treatment
Predator pressure
Prediction for male spots
K
none
female choice can favour conspicuous males
R
weak, Rivulus hartii
sexual selection remains influential
C
dangerous, Crenicichla alta
conspicuous males suffer stronger predation
Fine and coarse gravel were crossed with predator treatments. Under predation, spot size matching the substrate can improve camouflage; without strong predation, contrast can improve visibility to females.
Guppies were allowed to breed, predator treatments were imposed, and spot number and size were measured over later generations in replicated ponds.
Endler’s Guppies Reveal a Trade-off Between Predation and Mate Choice
Evidence
Interpretation
spots increased before strong predators were added
female choice favored conspicuous males
mean spot number fell with C. alta
dangerous predators selected against conspicuous males
weak-predator field transplants became more colorful over 15 generations
reduced predation allowed sexual selection to dominate
spot size tracked gravel under predation
background matching improved camouflage
Natural and sexual selection acted on the same heritable color traits in opposing directions. The observed phenotype reflected the balance of those pressures, not one universal best color.
Natural Selection Connects Variation, Environment and Reproduction Across Generations
mutation creates alleles + sexual reproduction reshuffles them → offspring vary → limited resources and abiotic or biotic pressures produce unequal survival and mating → heritable variants reach offspring unequally → population trait and allele frequencies change
Claim to test
Evidence needed
adaptation occurred by selection
heritable variation plus unequal reproductive contribution across generations
sexual selection acted
trait differences predict mating success
environmental pressure caused change
controlled manipulation or strong comparative evidence links pressure to fitness
population evolved
heritable trait or allele frequency changed, not merely one individual
Avoid purpose-driven language. Populations do not create useful mutations on demand; selection filters inherited variation already produced by mutation and recombination.
A Gene Pool Contains Every Allele Available to an Interbreeding Population
HL only
A gene pool is the complete set of genes and their alleles in an interbreeding population. Individuals carry samples of that pool; gametes sample alleles again for the next generation.
Level
What is counted?
diploid individual
two allele copies at one autosomal locus
population
all allele copies carried by all breeding individuals
allele frequency
proportion of all locus copies that are a specified allele
When allele frequencies change from one generation to another, the gene pool is changing—this is population-level evolutionary change even before a new species appears.
Allele Frequency Counts Allele Copies, Not Individuals
HL only
For allele A in a diploid population:
f(A)=2Ntotal2NAA+NAa
Genotype
Individuals
A copies contributed
AA
30
60
Aa
50
50
aa
20
0
total
100
110 of 200 copies
f(A) = 110/200 = 0.55; therefore f(a) = 0.45. Heterozygotes contribute one copy of each allele, not two copies of the dominant allele.
Isolation Lets Population Gene Pools Diverge
HL only
A barrier reduces or stops gene flow between populations.
Mutation, selection and genetic drift act separately in each gene pool.
Different environments can favor different inherited variants.
Allele frequencies diverge across generations.
Accumulated genetic and reproductive differences may eventually contribute to speciation.
Force
Directional expectation
gene flow
tends to make populations more similar
different local selection
can make populations diverge predictably
drift in small populations
can make frequencies diverge by chance
mutation
introduces new alleles independently
Geographic allele-frequency databases can reveal divergence, but the pattern alone does not identify which force caused it; sampling and population definition must also be checked.
Neo-Darwinism Connects Darwin’s Selection to Mendelian Alleles
HL only
mutation supplies new alleles → meiosis and fertilization create genotypes → genotypes influence heritable phenotypes → selection acts through individual survival and reproduction → allele frequencies change in the population gene pool
Darwinian description
Genetic description
individuals vary
individuals carry different alleles and genotypes
some leave more offspring
alleles are transmitted unequally
population becomes adapted
advantageous inherited variants rise in frequency
Selection is not the only force that changes allele frequency. Mutation, migration and genetic drift also alter gene pools, though not necessarily because one phenotype has higher fitness.
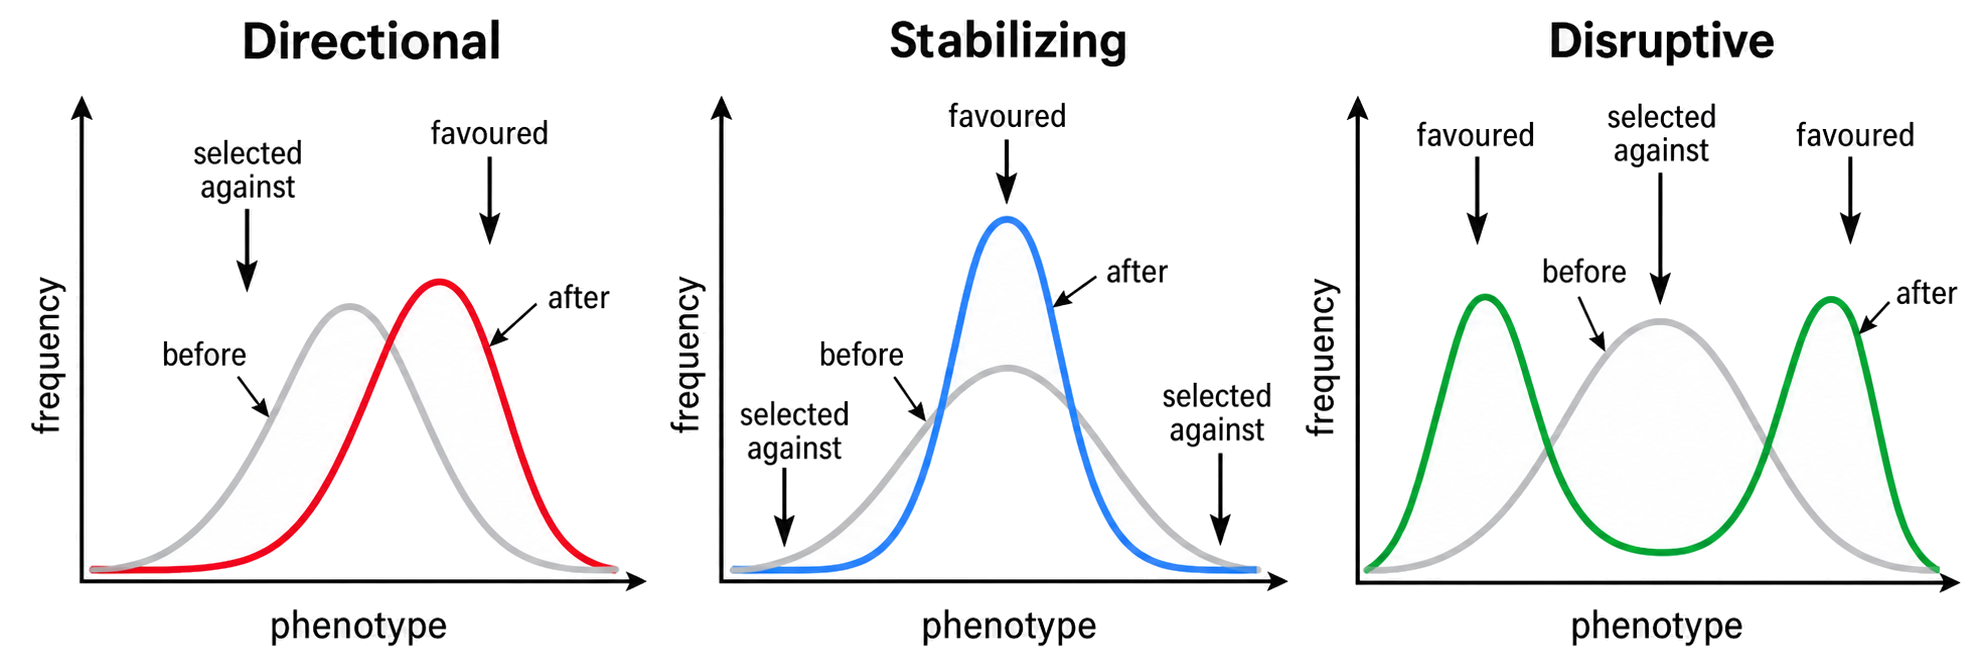
Three Selection Modes Differ in Which Phenotypes Have Highest Fitness
HL only
Mode
Highest fitness
Distribution after selection
directional
one extreme
mean shifts toward that extreme
stabilizing
intermediate
variance narrows around the existing mean
disruptive
both extremes
intermediates decline; distribution can become bimodal
The graphs describe phenotype distributions, but evolutionary change ultimately requires associated heritable alleles or allele combinations to change frequency.
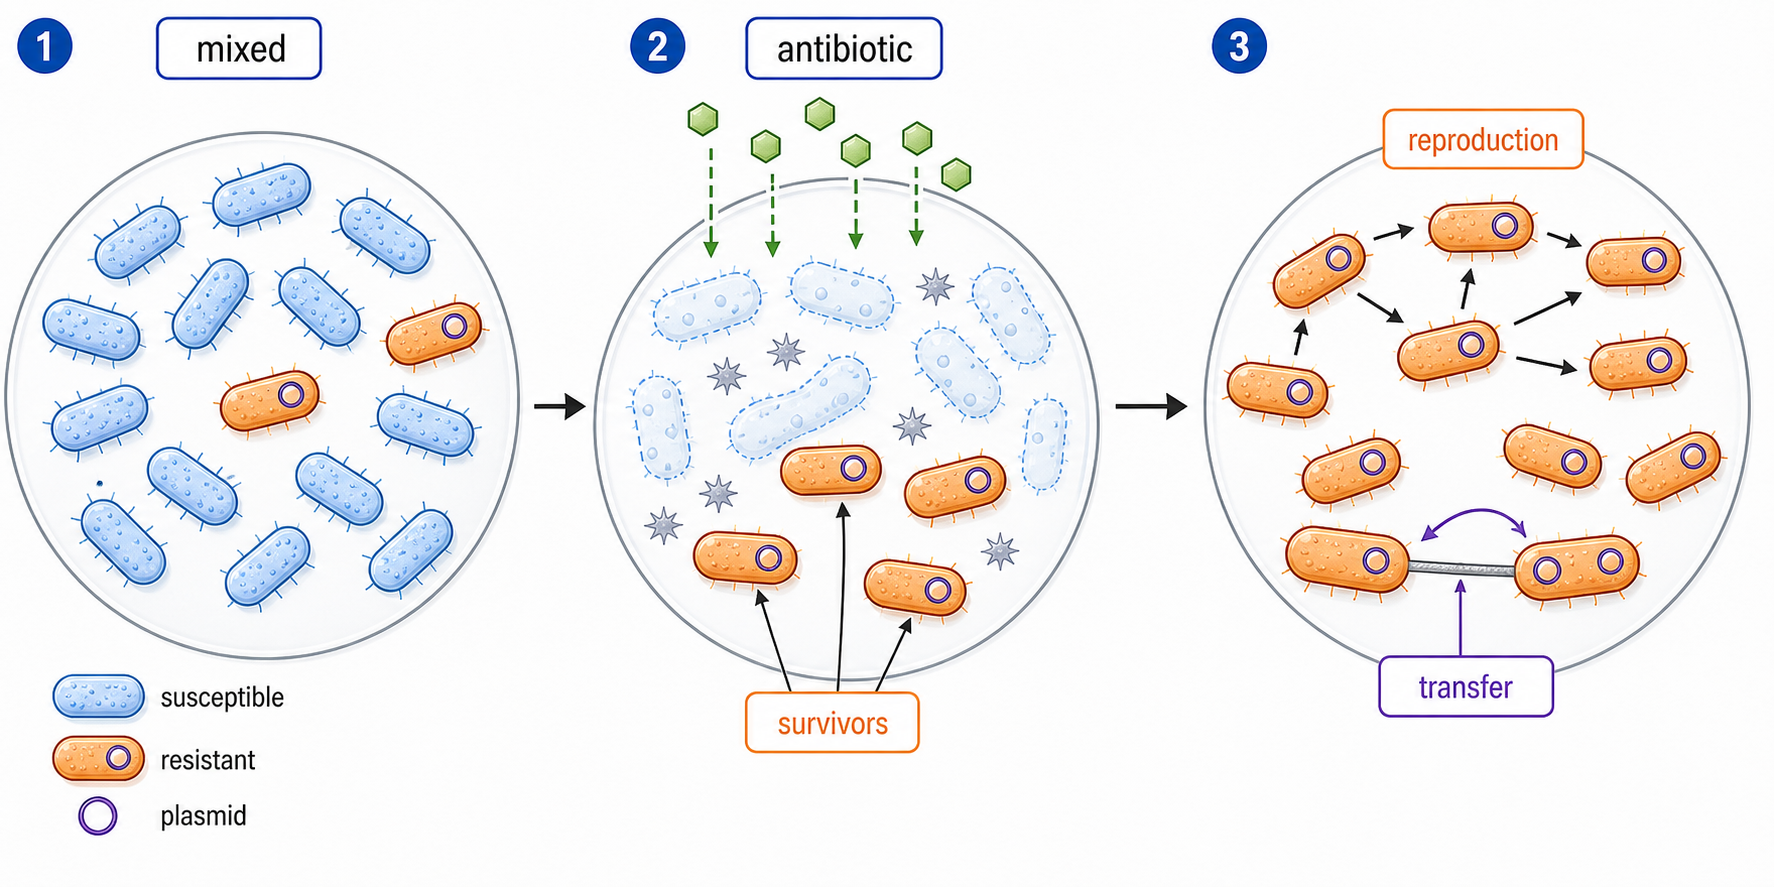
Antibiotics Cause Directional Selection of Resistant Bacteria
HL only
Resistance variation exists before or arises independently of treatment.
The antibiotic kills susceptible bacteria more effectively.
Resistant survivors reproduce and contribute a larger fraction of the next population.
Resistance alleles rise in frequency; plasmid transfer can spread them between cells.
The antibiotic does not teach individual bacteria to become resistant. It changes the survival difference between pre-existing or newly mutated variants.
Stabilizing Selection Removes Both Extremes Around an Intermediate Optimum
HL only
Birth-weight region
Selective disadvantage can arise from
very low
immature organs, low reserves and greater heat loss
intermediate
lowest mortality under the measured historical conditions
very high
delivery complications and associated maternal or fetal risks
When both extremes leave fewer surviving offspring, intermediate phenotypes contribute more. The mean may remain similar while the distribution narrows.
Human birth weight is affected by genes and environment. Historical hospital data show selection on the phenotype, but do not make every difference genetic or define one universal optimum.
Disruptive Selection Favors Both Extremes over Intermediates
HL only
environment contains two contrasting opportunities → individuals near either phenotypic extreme exploit one successfully → intermediate phenotype fits neither well → both extremes contribute more offspring → a bimodal distribution can develop
Yearling male plumage
Territorial outcome proposed in the study
dull brown
may be tolerated as non-threatening and gain territory
bright blue
may be avoided as a strong rival and gain territory
intermediate
attacked more often and gains poorer territory
Disruptive selection can increase divergence, but two peaks do not by themselves prove speciation. Reproductive isolation and continued genetic divergence are additional requirements.
Hardy–Weinberg Separates Allele Frequencies from Genotype Frequencies
HL only
Symbol
Meaning for two alleles A and a
p
frequency of A
q
frequency of a
p²
expected frequency of AA
2pq
expected frequency of Aa
q²
expected frequency of aa
p+q=1
p2+2pq+q2=1
p and q are allele frequencies; p², 2pq and q² are genotype frequencies. The equations do not require p to represent the dominant allele.
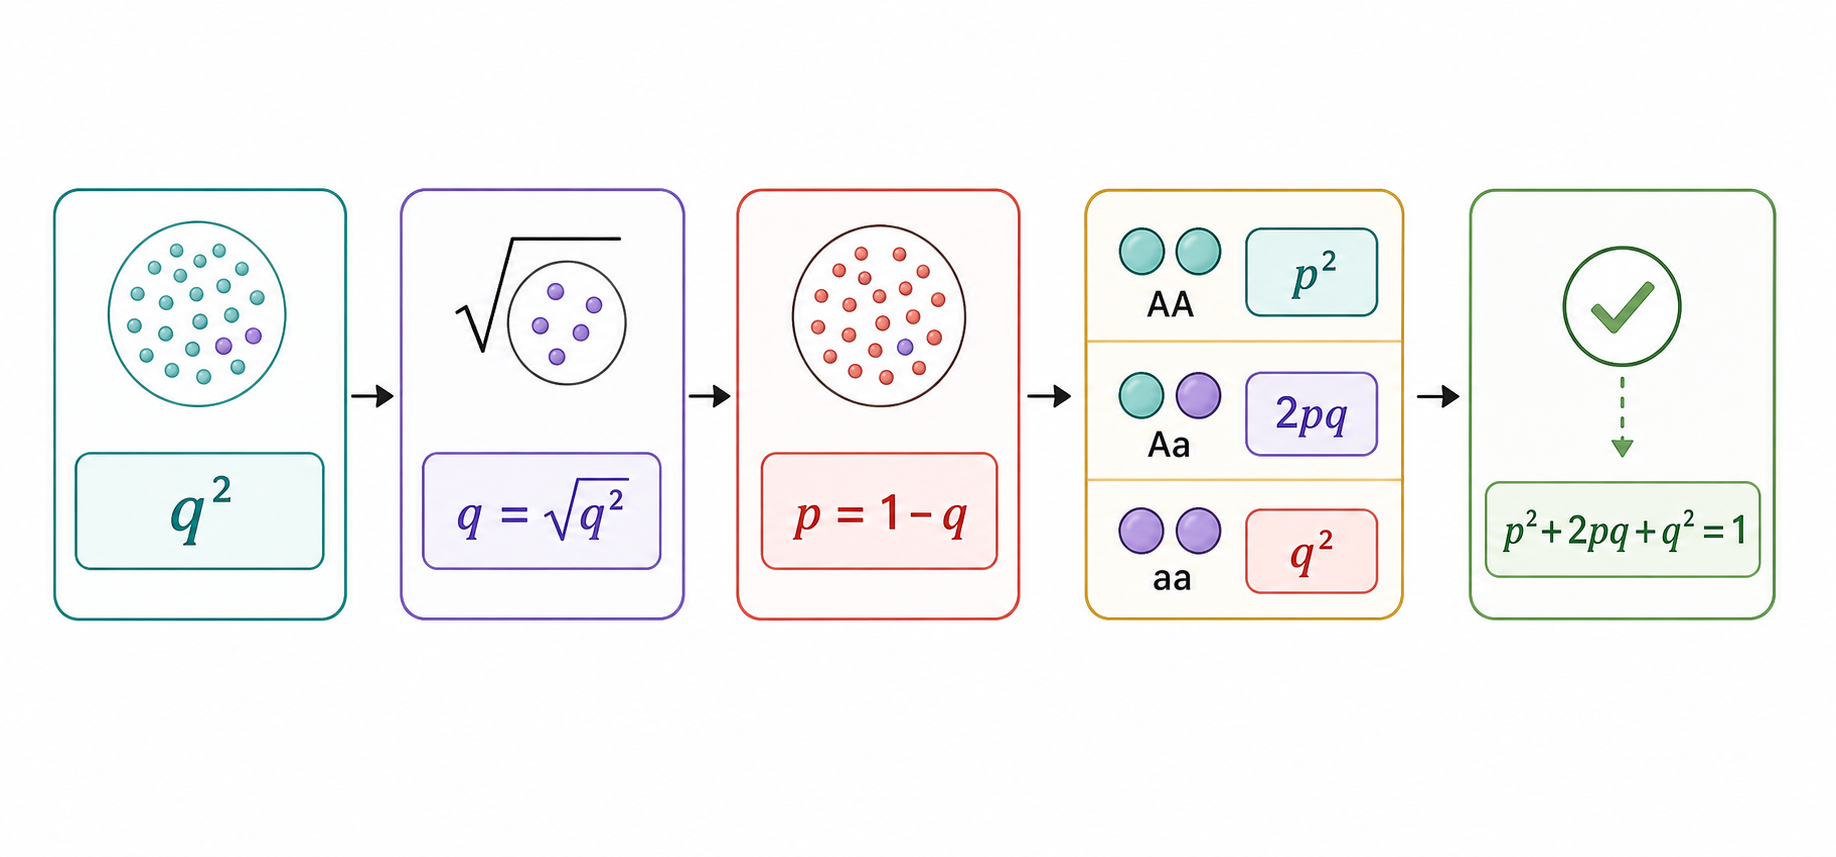
A Recessive Phenotype Reveals q², Not q
HL only
Convert the recessive phenotype count to a frequency; under complete dominance this is q².
Calculate q = √q².
Calculate p = 1 − q.
Calculate expected genotype frequencies p², 2pq and q².
Check that the three genotype frequencies sum to 1.
This inference is valid only when the population and locus satisfy the Hardy–Weinberg model and the recessive phenotype identifies homozygous recessives accurately.
Worked Hardy–Weinberg Example: 35% Recessive Phenotype
HL only
Quantity
Calculation
Result
q²
observed non-taster frequency
0.35
q
√0.35
0.592
p
1 − 0.592
0.408
p²
0.408²
0.166
2pq
2 × 0.408 × 0.592
0.483
check
0.166 + 0.483 + 0.350
0.999 ≈ 1
In 200 people, expected counts are approximately 33 homozygous dominant, 97 heterozygous and 70 homozygous recessive after multiplying each frequency by 200.
Keep extra digits until the final answer. Early rounding makes the genotype frequencies fail to sum closely to 1.
Hardy–Weinberg Equilibrium Requires Forces of Change to Be Absent
HL only
Condition
Change prevented in the model
very large population
random genetic drift is negligible
random mating
genotype pairing is not biased
no selection
genotypes contribute equally
no mutation
alleles do not convert into new states
no migration
no alleles enter or leave through gene flow
Under these conditions, random mating produces p²:2pq:q² genotype frequencies and allele frequencies remain stable across generations.
The model is an ideal baseline, not a claim that real populations satisfy every condition perfectly.
Departure from Hardy–Weinberg Identifies a Question, Not a Single Cause
HL only
Estimate allele frequencies from the population sample.
Use p², 2pq and q² to calculate expected genotype frequencies and counts.
Compare expected with observed genotype counts using an appropriate statistical test.
If the departure exceeds sampling expectation, investigate which assumptions are violated.
Possible violation
Additional evidence to seek
selection
survival or reproduction differs by genotype
non-random mating
mate pairs differ from random expectation
migration
immigrants carry different allele frequencies
drift
small population and random change
mutation
documented new allele conversion
A deviation does not by itself prove natural selection. Several forces, population structure, genotyping error or sampling can produce the pattern.
Artificial Selection Repeats Human Choice of Heritable Parents
HL only
Choose a target phenotype that has heritable variation.
Select parents showing the desired value.
Breed them and measure offspring.
Retain offspring with the strongest desired phenotype.
Repeat across generations so associated alleles become more frequent.
Rapid improvement can reduce genetic diversity and bring linked harmful alleles or correlated traits along with the selected phenotype.
Artificial and Natural Selection Differ in Selector, Not in Inheritance
HL only
Feature
Artificial selection
Natural selection
source of reproductive advantage
human breeder chooses parents
environmental survival and mating pressures
variation required
heritable variation
heritable variation
population result
chosen alleles change frequency
alleles linked to higher fitness change frequency
guaranteed organismal benefit
no; target serves human goal
no universal benefit; adaptation is environment-specific
Antibiotic resistance is usually natural selection caused by a human-created pressure, not artificial selection: humans do not deliberately choose resistant bacteria as breeding parents.
Both processes reveal the same inheritance principle—repeated unequal reproduction changes a population over generations.
Population Genetics Measures How Selection and Other Forces Change Gene Pools
HL only
count allele copies in the gene pool → establish p and q → use Hardy–Weinberg as a no-change expectation → compare observed genotype or allele frequencies across generations → use phenotype, fitness and population evidence to identify selection or another evolutionary force
Pattern or action
First model to examine
mean shifts toward one extreme
directional selection
variance narrows around intermediate values
stabilizing selection
both extremes rise and intermediates fall
disruptive selection
observed genotypes differ from p²:2pq:q²
one or more equilibrium assumptions may be violated
humans repeatedly choose parents
artificial selection
Keep description, calculation and cause separate. A changed distribution describes an outcome; allele counts quantify evolution; causal claims require evidence about inheritance, survival, mating, migration, drift or deliberate breeding.
Natural selection as mechanism
[ 8 ]
Explain how evolution may happen in response to environmental change with evidence from examples.
Roles of mutation and sexual reproduction
[ 8 ]
Explain how sexual reproduction can eventually lead to evolution in offspring.
Overproduction and competition
[ 4 ]
Outline how overpopulation of a species in a given environment may lead to evolution.
Abiotic factors as selection pressures
[ 2 ]
Explain how natural selection is influenced by changes in the environment.
Differences in adaptation, survival, reproduction
[ 1 ]
In a natural population, what is a feature of individuals that are better adapted?
Traits must be heritable
[ 1 ]
What is required for natural selection to occur?
I. Acquired characteristics II. Advantageous characteristics III. Genetic variation
Sexual selection
[ 6 ]
Explain what is meant by exaggerated traits and how they may develop in males of a species.
Modelling selection
[ 1 ]
John Endler experimented on populations of guppies (Poecilia reticulata) with different colouration. A male guppy fish is shown with large spots, which makes the fish more attractive to females, but more visible to predators.
The table shows the male colouration of guppy fish and number of predators in three different ponds.
Predator X
Predator Y
Male guppy colouration
Pond 1
12
0
Large colourful spots
Pond 2
15
0
Medium colourful spots
Pond 3
5
17
None/very small drab spots
What can be concluded from the data?
Gene pool concept
HL only
[ 3 ]
Discuss how the isolation of populations due to the fragmentation of forests could lead to changes in gene pools.
Allele frequencies
HL only
[ 1 ]
Define allele frequency.
Changes in allele frequency
HL only
[ 4 ]
If a wild population of cats contained both curled ears and normal ears, explain how the proportion of these two phenotypes could change in the population.
Types of selection
HL only
[ 2 ]
Phenotypic variation allows natural selection within populations. Compare and contrast directional and disruptive selection.
Hardy-Weinberg equation
HL only
[ 3 ]
Discuss the use of the Hardy-Weinberg equation in population genetics studies.
Hardy-Weinberg conditions
HL only
[ 2 ]
State two assumptions made when using the Hardy-Weinberg equation. 1.