(a)
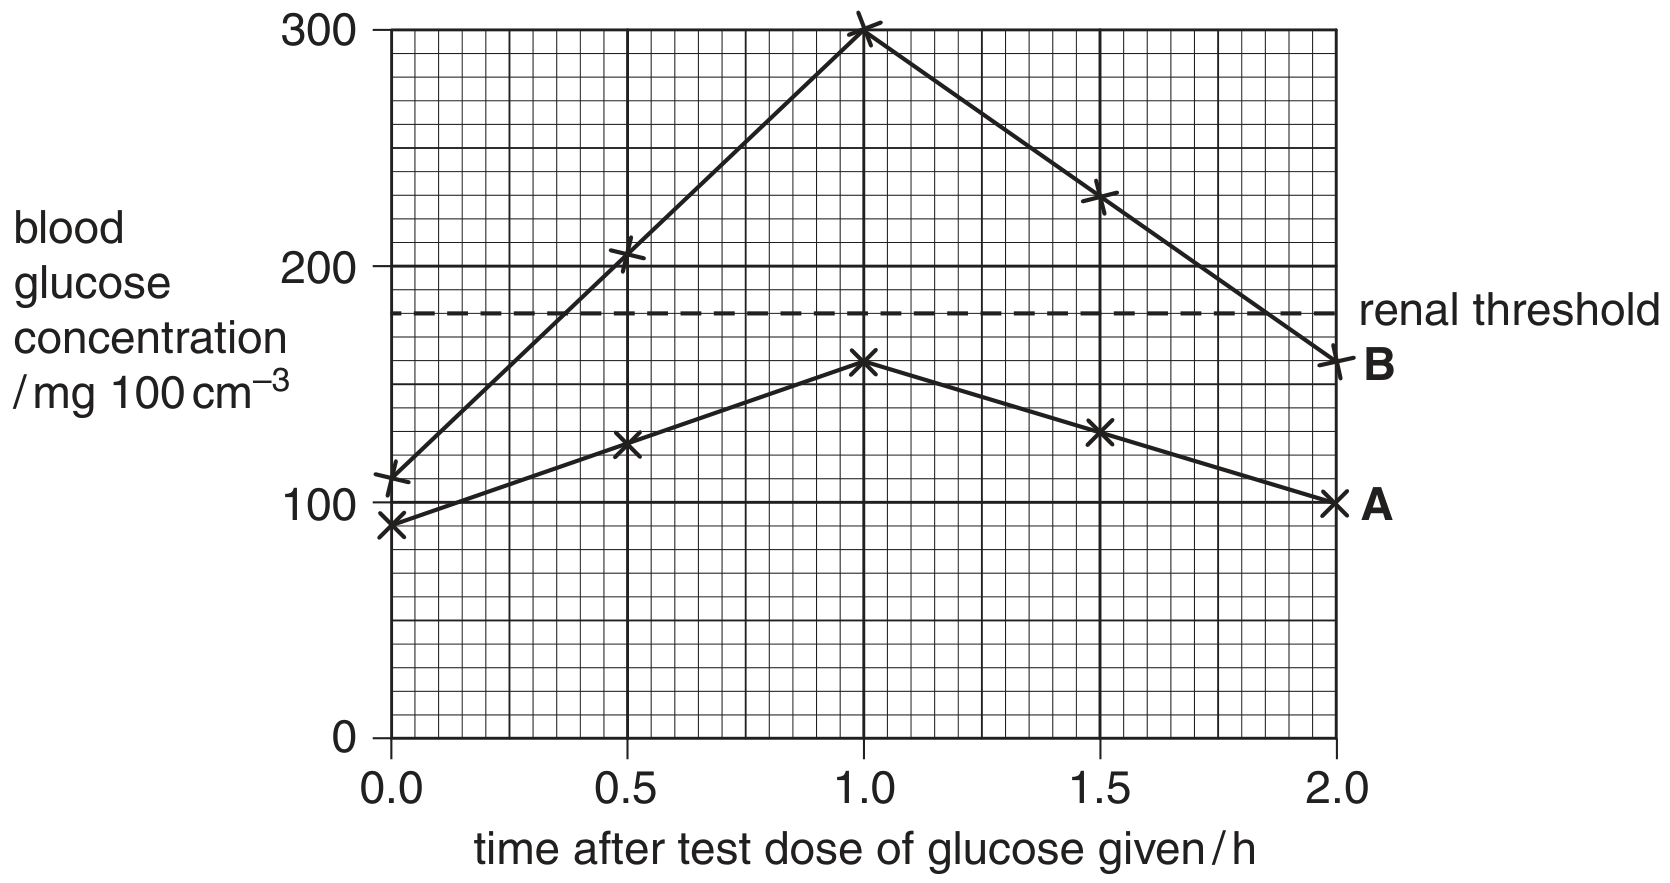
Two young men, subjects A and B, were each given a standardised test dose of glucose after fasting.
- The blood glucose concentration of each subject was then measured immediately and at 30 minute intervals for two hours.
- Samples of their urine were taken and tested at the same time intervals. The colour change of each test strip was compared with the colour chart and recorded as -, +, ++ or +++.
The results of the investigation are shown in Fig. 2.2.
Results of urine tests:
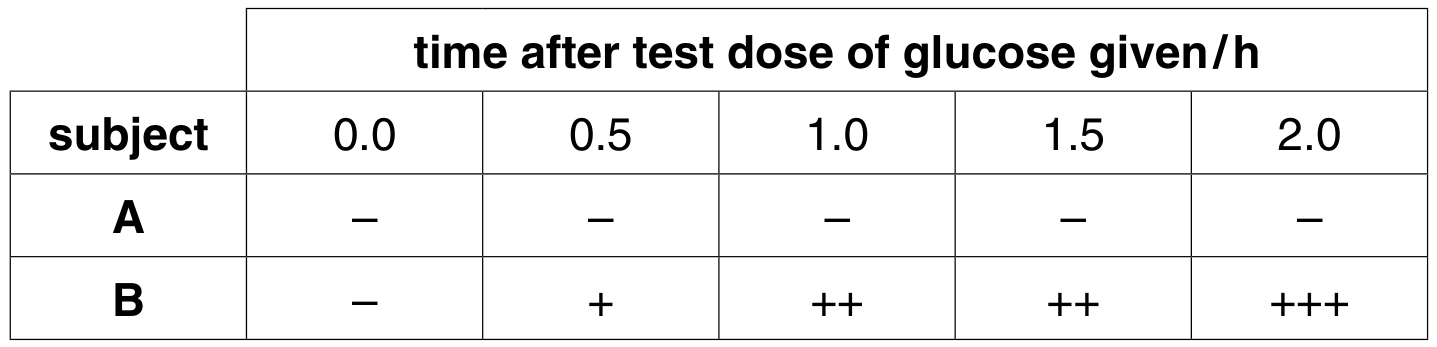
Fig. 2.2
With reference to Fig. 2.2:
[ 4 ]
(i)
explain the differences between the blood glucose concentrations of A and B
[ 4 ]