EduNinja
[Maximum number: 2]

Fig. 1.1 shows a snow leopard, Panthera uncia. The habitat of the snow leopard is the high mountains of Central Asia.
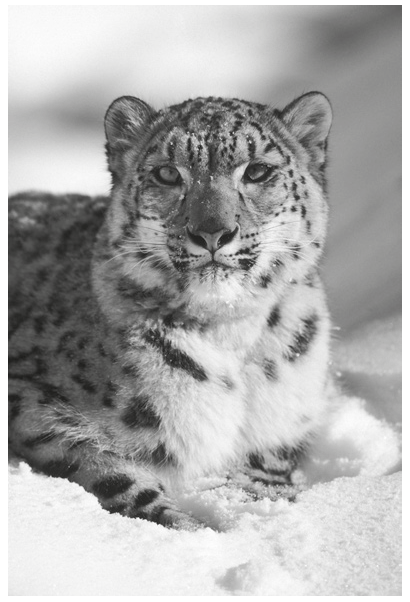
Fig. 1.1

Fig. 1.1

Snow leopards usually live and hunt alone. Their main prey is grazing herbivores, such as wild sheep and wild goats. They will also hunt domesticated animals and livestock.

The number of snow leopards has decreased dramatically in the last 40 years.

(a)

State how a decrease in the number of snow leopards will affect the genetic diversity of the species.

Outline the possible future consequences of this change in genetic diversity.

[ 2 ]
[Maximum number: 1]

The St. Lawrence river in Canada has been identified as an area with very high biodiversity.

(a)

The St. Lawrence river is rich in species of aquatic mammals, especially whales.

In spring, thousands of whales swim from the Atlantic ocean up the St. Lawrence river. Thirteen different species of whale have been recorded. One of these is the blue whale, Balaenoptera musculus.

Fig. 1.1 is a diagram of a blue whale.

Fig. 1.1

Fig. 1.1

Photographs of blue whales are analysed by computer so that individual whales can be identified and population abundance can be estimated. Each blue whale is different in colour and in the shape of dorsal fin. Different whales also have different patterns of scarring.

[ 1 ]
(i)

State the two sources of phenotypic variation in the blue whale population.

[ 1 ]
[Maximum number: 4]

Steelhead trout, Oncorhynchus mykiss, are fish that live in streams in North America.
To increase the number of steelhead trout, captive breeding has occurred since 1992. Fish eggs and sperm are mixed and the young fish grow in large tanks of aerated water for the first year of their lives. Most are then released into the wild, however a few male and female fish are kept to become the parents of the next generation of captive-bred fish.

Each tank may hold up to 50000 fish. The young captive fish are fed processed food. Some young fish are unable to survive these conditions and a proportion die. Death is usually the result of poor wound-healing after accidents due to overcrowding and due to the spread of diseases.

(a)
(i)

Name the expected pattern of variation in wound-healing ability in a population of fish.

[ 1 ]
(b)

Suggest and explain three ways in which the tank environment may make the phenotype of a captive fish different from a wild fish.

Two groups of fish were bred and grown in the same environment and were then compared to see if they showed differences in gene expression.

The two groups of fish came from:
- eggs and sperm from parent fish that had always lived in the wild
- eggs and sperm from parent fish that had been bred in captivity.

Results from microarray analysis showed that the offspring of the wild and captive-bred fish differed in the expression of over 700 genes.

[ 3 ]
[Maximum number: 4]

Phenotypic variation exists in many forms.

(a)

Some examples of phenotypic variation in plants and animals are described in Table 2.1.

Complete Table 2.1 by stating whether the cause of variation for each described example is likely to be due to:
- genetic factors, VG\mathrm{V}_{\mathrm{G}}
- environmental factors, VE\mathrm{V}_{\mathrm{E}}
- a combination of genetic and environmental factors, VG+VE\mathrm{V}_{\mathrm{G}}+\mathrm{V}_{\mathrm{E}}.

Table 2.1

Table 2.1

[ 3 ]
(b)

Name a spontaneous, random event occurring in cells that can be a source of phenotypic variation.

[ 1 ]
[Maximum number: 2]

When preparing infertile women for in-vitro fertilisation (IVF), it is necessary to stimulate the growth and maturation of several ovarian follicles. This is done by giving daily injections of the glycoprotein hormone, follicle stimulating hormone (FSH).

Each molecule of FSH has quaternary structure and consists of two different polypeptide chains, α\alpha and β\beta.

(a)

The effectiveness of r-hFSH was compared with that of u-hFSH. Women starting IVF treatment were randomly divided into two groups and given either r-hFSH or u-hFSH.

The differences between the two groups of women after FSH treatment are shown in Table 2.1.

Table 2.1

Table 2.1

[ 2 ]
(i)

The probability of the results for the mean number of mature follicles per woman occurring by chance is <0.002.

Explain what is meant by this probability.

[ 2 ]
[Maximum number: 5]

The IUCN Red List provides information about the conservation status of species throughout the world, including the American badger, Taxidea taxus, and the black-footed ferret, Mustela nigripes.

Fig. 2.1 shows an American badger and Fig. 2.2 shows a black-footed ferret.

Fig. 2.1

Fig. 2.1

Fig. 2.2

Fig. 2.2

Fig. 2.3 shows the IUCN conservation status of the American badger and the black-footed ferret in 1987 and in 2013.

Fig. 2.3

Fig. 2.3

(a)

Black-footed ferrets were released at three different locations in the wild at different times. Each population was established from captive-bred animals.

Fig. 2.4 shows the population sizes of black-footed ferrets at the three release locations.

Fig. 2.4 shows the population sizes of black-footed ferrets at the three release locations.

[ 5 ]
(i)

Describe the patterns of population growth at the three locations where black-footed ferrets were released.

Table 2.1 shows information about the gene pool of the populations of black-footed ferrets and the leg sizes of the black-footed ferrets at each release location in 2004.

All three populations were started by animals from the same captive population. In this original captive population, 100 % of the genes surveyed showed polymorphism, that is, they had more than one allele. The mean number of alleles per gene locus was two.

The population at the South Dakota location in 2004 maintained the same level of genetic variation and leg size data as the original captive population, but the populations in Wyoming and Arizona showed changes.

Table 2.1

Table 2.1

[ 3 ]
(ii)

Use Table 2.1 to describe how the gene pools and leg sizes of the Wyoming and Arizona black-footed ferret populations have changed, compared to the original captive population.

[ 2 ]
[Maximum number: 4]

The interpupillary distance (IPD) is the distance in millimetres between the centres of the pupils of the eyes. Fig. 2.1 shows how IPD is measured.

Fig. 2.1

Fig. 2.1

IPD is one example of a characteristic of human facial structure that shows variation.
Fig. 2.2 shows the pattern of variation in IPD in a large sample of adults.

Fig. 2.2

Fig. 2.2

(a)
(i)

Name the type of variation shown in Fig. 2.2.

[ 1 ]
(ii)

Suggest and explain how genes and the environment contribute to variation in IPD in humans.

[ 3 ]
[Maximum number: 2]

The stickleback fish, Gasterosteus aculeatus, has two distinct forms, the saltwater form and the freshwater form. The larger, freshwater form is thought to have evolved from the smaller, saltwater form. Both forms have armour plating on each side of the body. The plates are made of bone and contain a high proportion of calcium.

The ectodysplasin gene, EDA, codes for a protein involved in the development of armour plates. The EDA gene has two alleles, low armour and high armour.

Three main morphs of armour plating have been described.
Complete morph armour plating:
- is found mainly in the saltwater form
- has many plates from head to tail to cover most of the body
- provides defence against large, predatory fish
- limits the growth of the fish.

Partial morph armour plating:
- is found mainly in the freshwater form
- has a reduced number of plates to cover only part of the body.

Low morph armour plating:
- is found mainly in the freshwater form
- has very few, undeveloped plates and no body cover.

(a)

Explain why the variation in armour plating in stickleback fish can be described as discontinuous.

[ 2 ]
[Maximum number: 3]

Variation exists in populations of a species and this may provide the opportunity for evolution to occur.

(a)

Phenotypic variation exists in many forms and has a number of possible causes.

Describe the main factors that are the cause of phenotypic variation.

[ 3 ]
[Maximum number: 6]

Domestic goats are small, herbivorous animals that provide milk for human use. This is an important source of food for people in rural South Africa.

Three Northern European goat varieties (breeds) have been imported to South Africa because they have higher milk yields than the native South African goats.

Table 2.1 compares the mean daily milk yields of these three breeds of Northern European goat in three locations, Northern Europe, Barbados and South Africa.

Table 2.1

Table 2.1

(a)

Native South African goats have a mean daily milk yield of 0.25 kg .

Calculate how many times greater the mean daily milk yield will be if a native South African goat is replaced by the Northern European goat breed that gives maximum yield.

Show your working and write your answer to two significant figures.
answer

[ 2 ]
(b)
(i)

Explain how the data in Table 2.1 support the claim that some of the variation in mean daily milk yield in goats is due to genetic causes.

[ 2 ]
(ii)

The climate, vegetation and availability of veterinary care for goats in Northern Europe, Barbados and South Africa are different.

Explain how Table 2.1 shows that environmental factors can cause variation in mean daily milk yield in goats.

[ 2 ]
0