EduNinja
[Maximum number: 2]

Fig. 1.1 is a summary of energy flow in a forest ecosystem. The width of the arrows is proportional to the energy that flows between each component in the ecosystem.
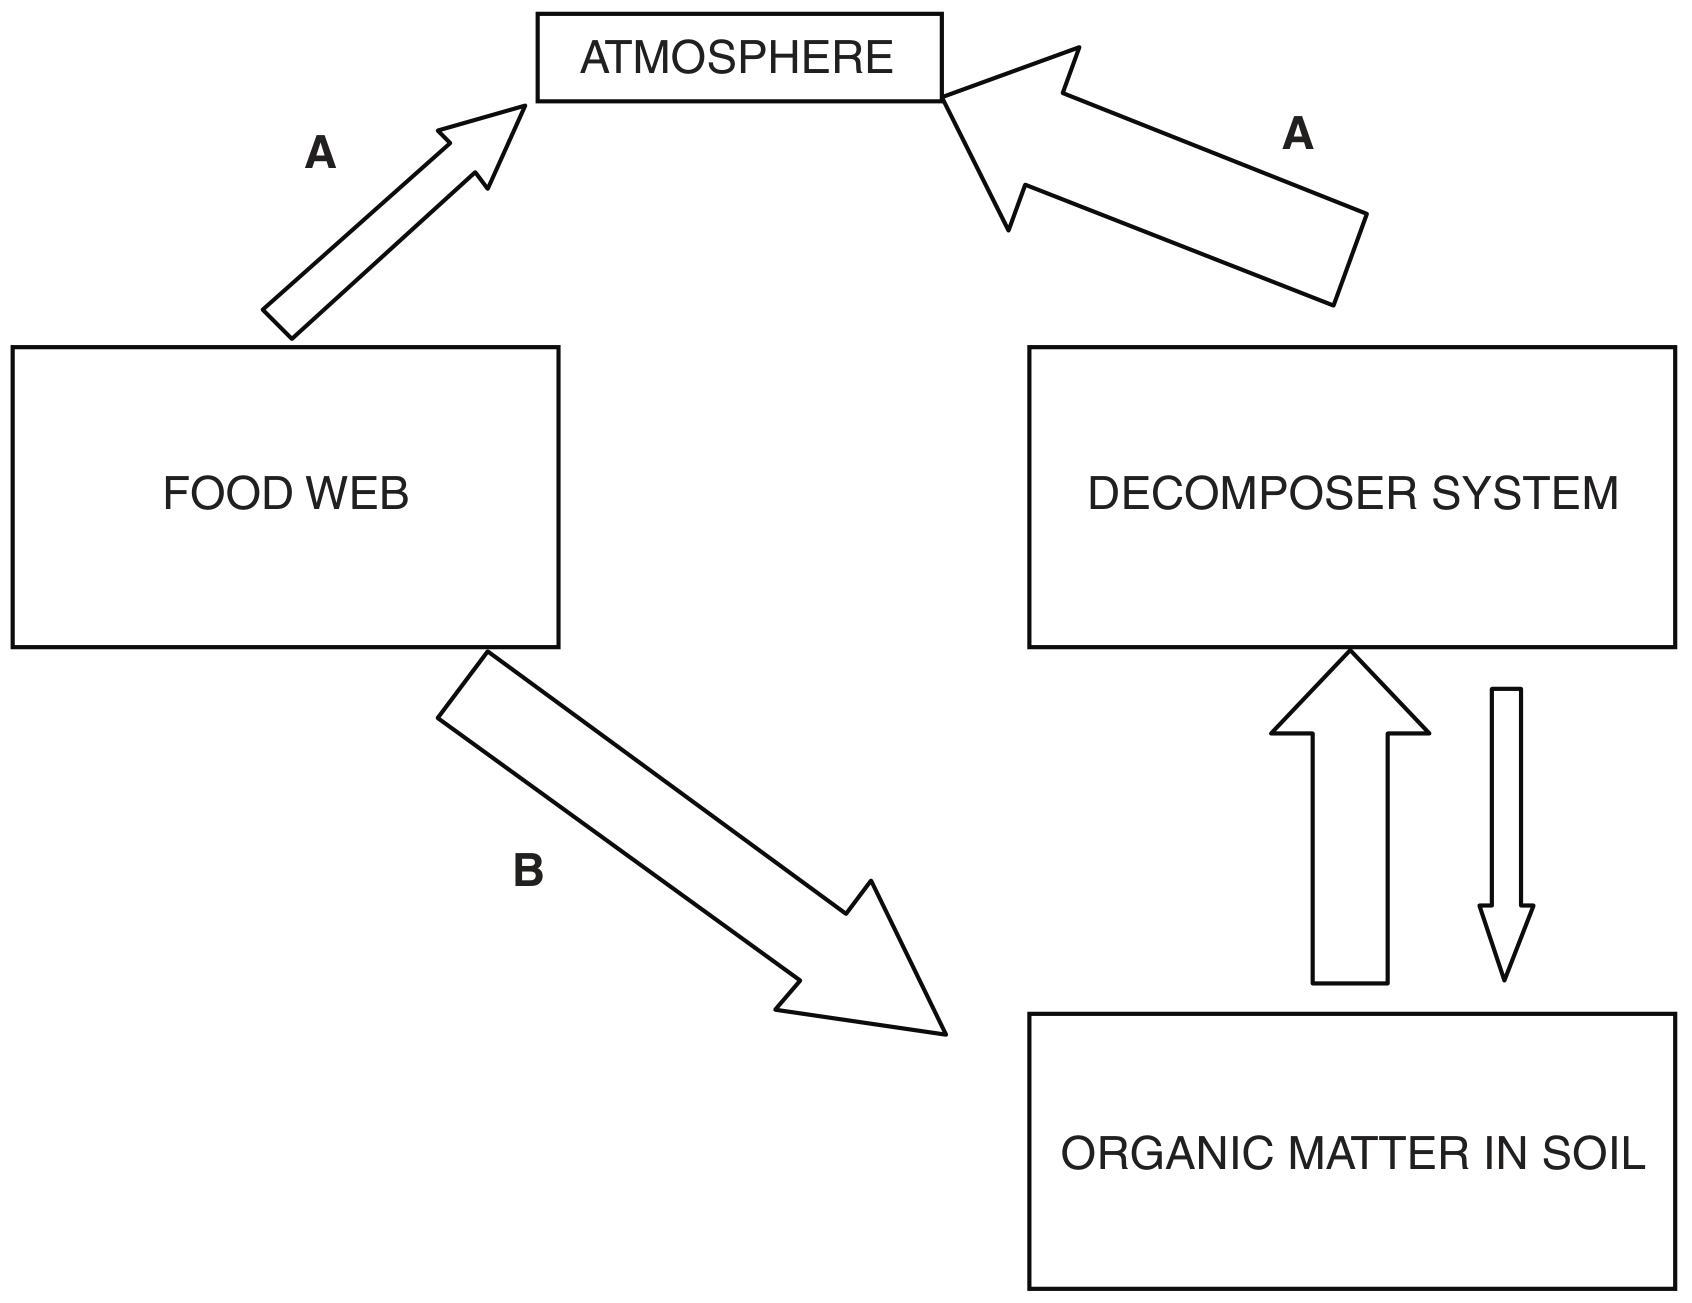
Fig. 1.1

Fig. 1.1

(a)

Add an arrow to Fig. 1.1 to show where the ecosystem receives its initial input of energy.

[ 1 ]
(b)

State one type of organism that is a member of the decomposer system.

[ 1 ]
(a)

Complete the passage with the most appropriate term.

Within each ecosystem there is a of organisms that interact with each other and with their environment. Each species fills a particular within the ecosystem. Feeding relationships in food webs are an example of the interactions species have with each other. In old field ecosystems in North America, producers, such as blue grass, provide energy for grazing animals. These animals form the in the food chain.

[ 3 ]
[Maximum number: 6]

The Sulawesi macaque, Macaca nigra, is found on the large island of Sulawesi in Indonesia. The Sulawesi macaque is also found on other smaller islands close to Sulawesi, such as the island of Bacan.

Fig. 1.1 shows a Sulawesi macaque.

Fig. 1.1

Fig. 1.1

(a)

The International Union for Conservation of Nature (IUCN) is the world's largest global environmental organisation. The IUCN Red List of Threatened Species TM { }^{\text {TM }} evaluates the conservation status of plant and animal species. The Sulawesi macaque is categorised as critically endangered on the IUCN Red List.

Table 1.1 shows the numbers of humans and the numbers of Sulawesi macaques on Sulawesi and Bacan.

Table 1.1

Table 1.1

[ 6 ]
(i)

Calculate the number of macaques per km2\mathrm{km}^{2} for Sulawesi.

Write your answer in Table 1.1.

[ 3 ]
(ii)

Comment on the data shown in Table 1.1 and suggest reasons for the pattern shown.

[ 3 ]
[Maximum number: 3]

The St. Lawrence river in Canada has been identified as an area with very high biodiversity.

(a)

Explain how the term biodiversity can be considered at different levels.

[ 2 ]
(b)

The St. Lawrence river is rich in species of aquatic mammals, especially whales.

In spring, thousands of whales swim from the Atlantic ocean up the St. Lawrence river. Thirteen different species of whale have been recorded. One of these is the blue whale, Balaenoptera musculus.

Fig. 1.1 is a diagram of a blue whale.

Fig. 1.1

Fig. 1.1

Photographs of blue whales are analysed by computer so that individual whales can be identified and population abundance can be estimated. Each blue whale is different in colour and in the shape of dorsal fin. Different whales also have different patterns of scarring.

[ 1 ]
(i)

Suggest one reason why it is difficult to measure the actual population size of the blue whale.

[ 1 ]
[Maximum number: 1]

Fig. 1.1 shows a snow leopard, Panthera uncia. The habitat of the snow leopard is the high mountains of Central Asia.

Fig. 1.1

Fig. 1.1

Snow leopards usually live and hunt alone. Their main prey is grazing herbivores, such as wild sheep and wild goats. They will also hunt domesticated animals and livestock.

The number of snow leopards has decreased dramatically in the last 40 years.

(a)
(i)

In 2003, the total number of snow leopards was estimated to be between 4080 and 6590 .

Suggest one reason why the actual number of snow leopards in 2003 may have been higher than the estimated number.

[ 1 ]
[Maximum number: 3]

Corals are simple marine animals and usually exist in colonies of thousands of individuals.
Fig. 1.1 shows a coral colony.

Fig. 1.1

Fig. 1.1

Corals absorb calcium carbonate from the sea to build their skeletons, which help to form large coral reefs. Coral reefs provide a home for about 25 % of known fish species and have the highest biodiversity of any marine ecosystem.

(a)

Outline what is meant by the term ecosystem.

[ 2 ]
(b)

Coral reefs are at risk of damage due to human activities. All the coral reefs in three regions were classified as being at low, medium or high risk of damage.

Table 1.1 shows the areas of coral reef at risk of damage in these three regions.

Table 1.1

Table 1.1

[ 1 ]
(i)

Complete Table 1.1, giving your answers, to the nearest whole number.

[ 1 ]
[Maximum number: 2]

The Bengal Tiger, Panthera tigris tigris, is an endangered mammalian species of Southern Asia. It lives mostly in a forest habitat.

Fig.1.1 shows a Bengal Tiger.

Fig. 1.1

Fig. 1.1

(a)

Table 1.1 shows the relationship between available forest habitat and Bengal Tiger numbers between 1970 and 2010.

Table 1.1

Table 1.1

Calculate the percentage decrease in the number of Bengal Tigers between 1970 and 2010.

Give your answer to the nearest whole number.
answer \%

[ 2 ]
[Maximum number: 2]

The Ethiopian wolf, Canis simensis, is a member of the Canidae family of carnivores.
Fig. 1.1 shows an Ethiopian wolf.

Fig. 1.1

Fig. 1.1

(a)

According to the Red List, the number of endangered mammal species in 2007 was 349 and in 2008 was 448.

Calculate the percentage increase in endangered mammal species between 2007 and 2008.

Give your answer to the nearest whole number.
Show your working.

answer \%

[ 2 ]
[Maximum number: 2]

The natterjack toad, Bufo calamita, is an endangered amphibian species in the UK. It comes out of hibernation in April and breeds in pools by sand dunes along parts of the UK coast. A young natterjack toad will take about 10 weeks to develop from a fertilised egg. A natterjack toad feeds at night, by running at its prey, mainly insects and worms, on the sand dunes.

Fig. 1.1 shows a natterjack toad.

Fig. 1.1

Fig. 1.1

(a)

Fig. 1.2 shows the number of adult natterjack toads counted from 1989 to 1997 in one area of the UK.

Fig. 1.2

Fig. 1.2

Calculate the mean annual number of adult natterjack toads counted from 1989 to 1997.

Give your answer to the nearest whole number.
Show your working.

[ 2 ]
(a)

Explain what is meant by the term biodiversity.

[ 3 ]
0