EduNinja
(a)

The rate of photosynthesis is affected by a number of environmental factors.
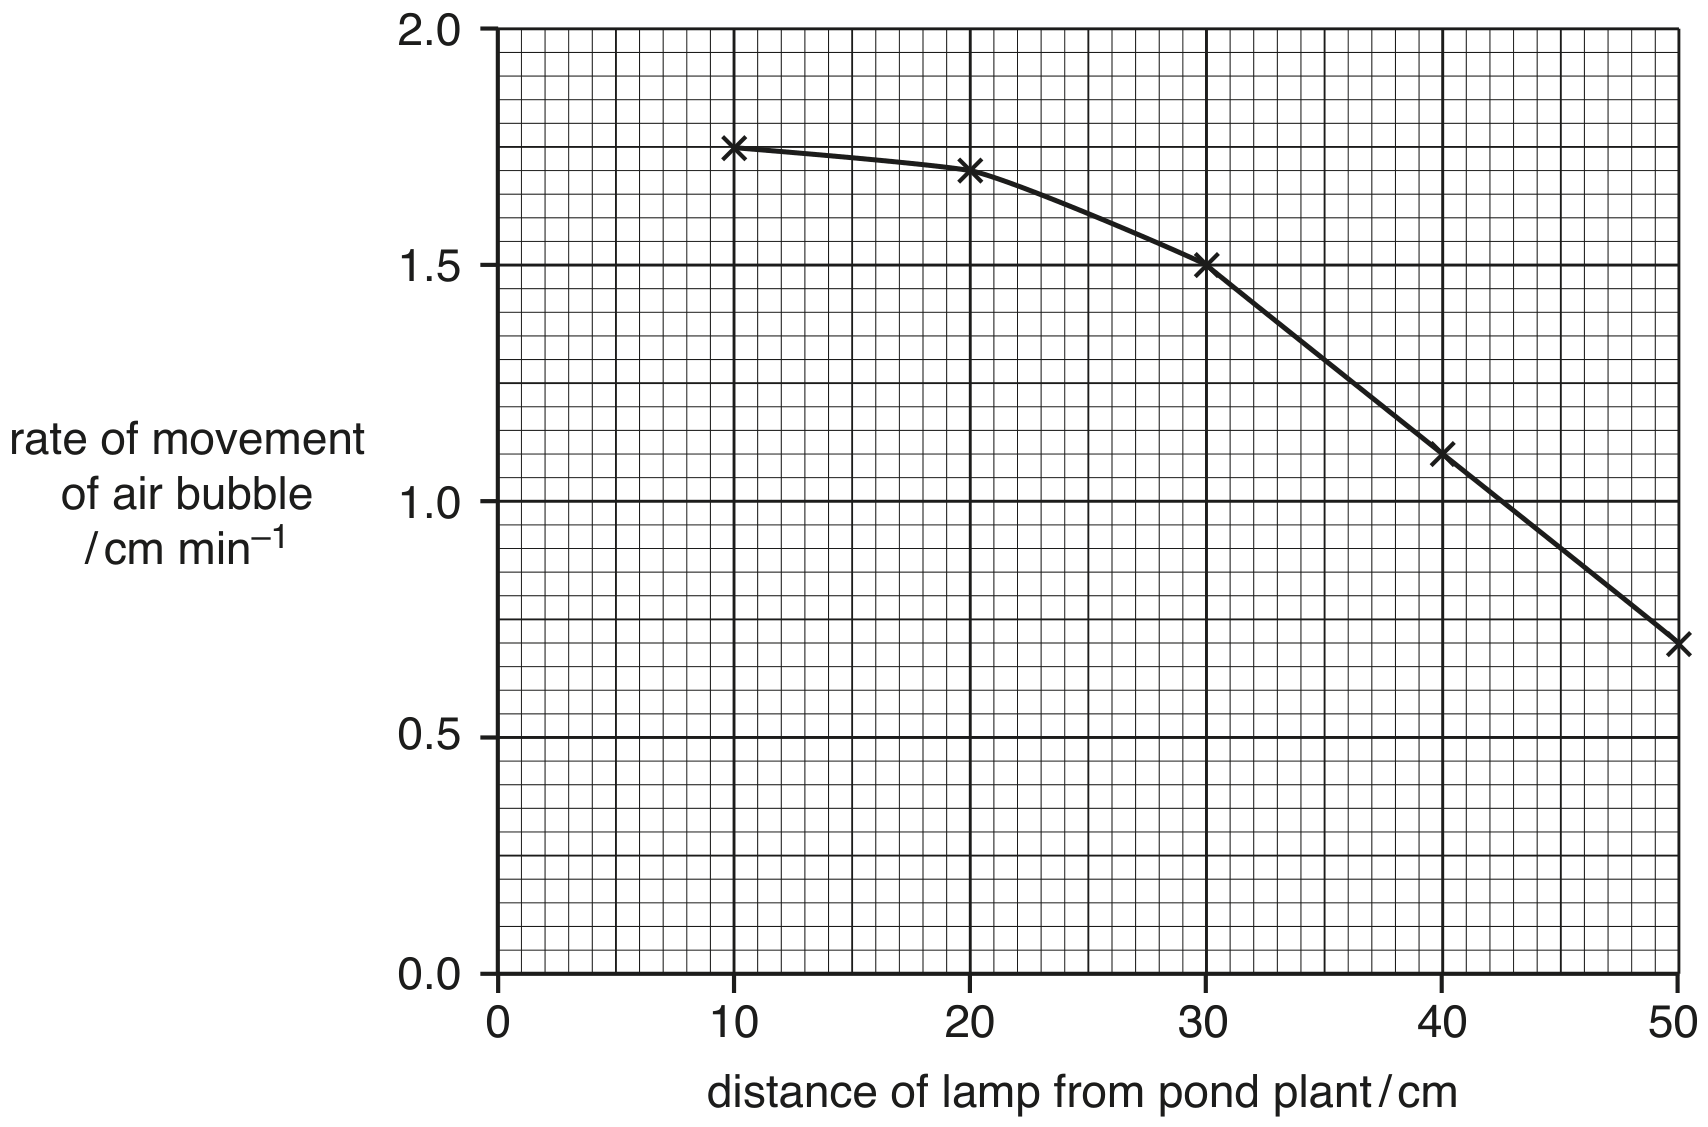
Fig. 1.1 shows the effect of light intensity on the rate of photosynthesis.
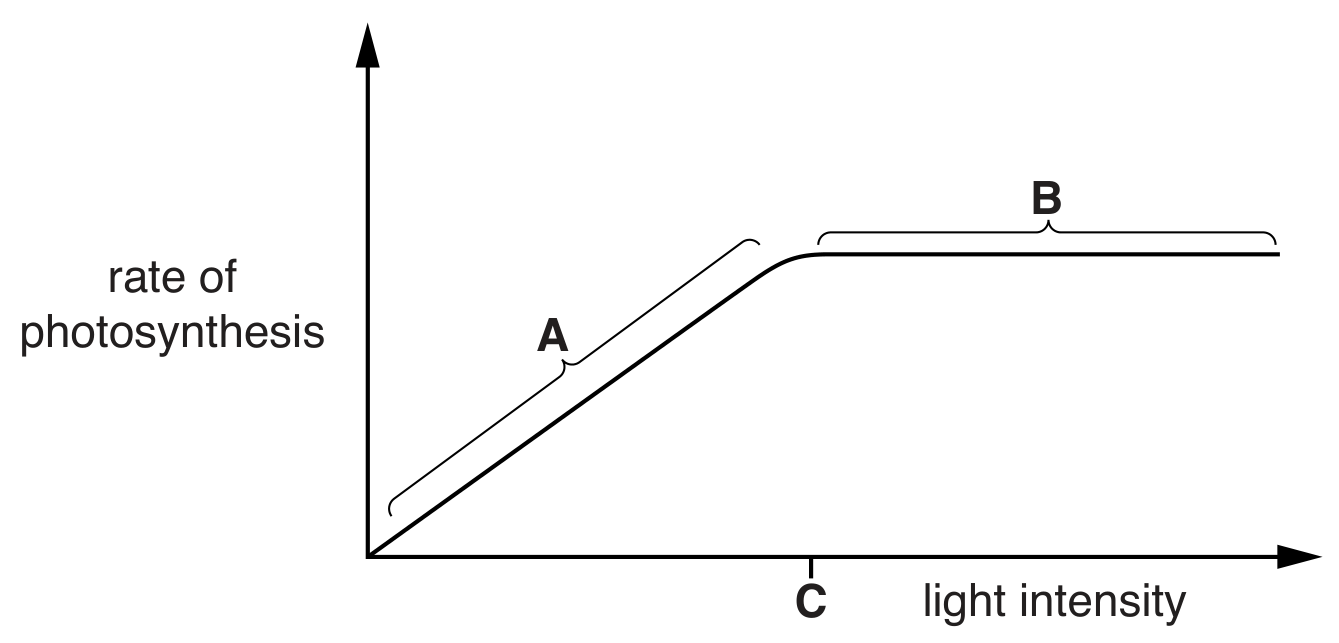
Fig. 1.1

Fig. 1.1

[ 5 ]
(i)

State the limiting factor in region A of the graph.

[ 1 ]
(ii)

Explain what is meant by the term limiting factor.

[ 2 ]
(iii)

Explain why there is no further increase in the rate of photosynthesis beyond point C.

[ 2 ]
(b)

For many plants living in temperate regions, the optimum temperature for photosynthesis is approximately 25C25^{\circ} \mathrm{C}.

Suggest reasons why the rate of photosynthesis decreases at temperatures above 25C25^{\circ} \mathrm{C}.

[ 4 ]
(a)

Changes in the atmospheric carbon dioxide concentration, light intensity and temperature alter the rate of photosynthesis. These three factors directly affect different stages of photosynthesis.

Complete the table below using a tick ()(\checkmark) if the factor directly affects the stage or a cross (X) if it does not affect the stage.

Table
[ 3 ]
(a)

A student investigated the effects of temperature and light intensity on the rate of photosynthesis of an aquatic plant.

Fig. 1.1 shows the results of the investigation.

Fig. 1.1

Fig. 1.1

With reference to Fig. 1.1:

[ 5 ]
(i)

describe the results of the investigation

[ 3 ]
(ii)

suggest explanations for the results for high light intensity above 30C\mathbf{3 0}^{\boldsymbol{\circ}} \mathbf{C}.

[ 2 ]
(b)
(i)

Explain why the volume of oxygen released from the plant does not give a true rate of photosynthesis.

[ 1 ]
(a)
(i)

The anatomy of C 4 plants is adapted to allow the rate of photosynthesis to remain high at high temperatures.

C3 plants do not have these adaptations and an additional reaction occurs at high temperatures that reduces the rate of photosynthesis.

Explain why the reaction that takes place at high temperatures in C3 plants reduces the rate of photosynthesis.

[ 2 ]
[Maximum number: 6]

Fig. 1.1 is a transverse section through a leaf from the maize plant, Zea mays.
Maize is a C4 plant.

Fig. 1.1

Fig. 1.1

(a)

Fig. 1.2 shows the results of an experiment comparing the rate of carbon dioxide uptake in a C3 plant (Chenopodium album) and a C4 plant (Amaranthus retroflexus) in high and low carbon dioxide ( CO2\mathrm{CO}_{2} ) conditions.

The rate of CO2\mathrm{CO}_{2} uptake is used to measure the rate of photosynthesis.

Fig. 1.2

Fig. 1.2

[ 6 ]
(i)

Using Fig. 1.2, compare the rates of photosynthesis in high CO2\mathrm{CO}_{2} conditions in the C 3 and C4 plants.

[ 4 ]
(ii)

Using Fig. 1.2, compare the rates of photosynthesis in low and high CO2\mathrm{CO}_{2} conditions in the C4 plant between 30C30^{\circ} \mathrm{C} and 35C35^{\circ} \mathrm{C} and suggest an explanation for this difference.

[ 2 ]
(a)

The rate of photosynthesis is affected by many environmental factors.

A student carried out an experiment to investigate the relationship between the concentration of carbon dioxide available to an aquatic plant, Cabomba caroliniana, and its rate of photosynthesis.

Fig. 1.1 shows the experimental set-up for this investigation.

Fig. 1.1 shows the experimental set-up for this investigation.

- Sodium hydrogencarbonate solution was used as a source of carbon dioxide.
- The concentration of carbon dioxide was varied using six different concentrations of sodium hydrogencarbonate solution.
- All C. caroliniana plants were kept in the dark before the light was switched on at the start of the experiment.
- Five replicates were carried out at each concentration.
- The rate of photosynthesis was obtained by calculating the percentage change in dissolved oxygen concentration in the solution over five minutes.

Fig. 1.2 shows the results of the investigation.

Fig. 1.2

Fig. 1.2

[ 8 ]
(i)

With reference to Fig. 1.2, explain the pattern of results obtained between 0.25moldm30.25 \mathrm{moldm}^{-3} and 1.25 moldm31.25 \mathrm{~mol} \mathrm{dm}^{-3} of sodium hydrogencarbonate solution.

[ 3 ]
(ii)

The percentage change in dissolved oxygen for C. caroliniana at 0.00moldm30.00 \mathrm{moldm}^{-3} of sodium hydrogencarbonate solution is negative.

Suggest reasons for this negative value.

[ 2 ]
(iii)

To minimise temperature changes, the student decided to use an LED lamp as a light source. LED lamps release very little heat energy.

Explain the importance of minimising temperature changes in this experiment.

[ 3 ]
(a)

The effect of light intensity on the rate of photosynthesis can be investigated using a cut shoot of a pond plant.

The apparatus used in the investigation is shown in Fig. 1.1.

Fig. 1.1

Fig. 1.1

The light intensity can be changed by placing the lamp at different distances from the pond plant.

[ 3 ]
(i)

Apparatus X, shown in Fig. 1.1, is a thin glass container filled with water.

Explain the function of apparatus X.

[ 2 ]
(ii)

Before completing the assembly of the apparatus shown in Fig. 1.1, sodium hydrogencarbonate is added to the water surrounding the pond plant in the test-tube.

Explain why sodium hydrogencarbonate is added to the water surrounding the pond plant in the test-tube.

[ 1 ]
(b)

The investigation was carried out with the lamp at distances of 10,20,30,40 and 50 cm from the pond plant. For each of these distances, the air bubble in the capillary tube was initially positioned at 0 cm on the scale and, after 5 minutes, the distance moved by the air bubble was measured. The rate of movement of the air bubble was then calculated.

The results are shown in Fig. 1.2.

Fig. 1.2

Fig. 1.2

[ 4 ]
(i)

With reference to Fig. 1.2, describe the relationship between the rate of photosynthesis and light intensity.

[ 2 ]
(ii)

Further investigations showed that at distances of less than 10 cm , the rate of movement of the air bubble was the same as at 10 cm .

Explain why there was no change in the rate of movement of the air bubble at distances less than 10 cm .

[ 2 ]
[Maximum number: 2]

Most plants are C3 plants and are so-called because their first photosynthetic product is a three carbon compound.

The enzyme ribulose bisphosphate carboxylase/oxygenase (rubisco) catalyses the fixation of carbon dioxide in the Calvin cycle and is used by both C3 and C4 plants.

Each molecule is made up of eight large polypeptides and eight small polypeptides. Fig. 2.1 shows a side view of the molecule.

Fig. 2.1

Fig. 2.1

(a)
(i)

Outline how the biochemistry of C 4 plants differs from that of C 3 plants.

[ 2 ]
[Maximum number: 3]

Photosynthesis is an important energy transfer process.

(a)

Explain why temperature can be a limiting factor of photosynthesis.

[ 3 ]
0