Identify one reason why in 2018 the life expectancy in Beijing was higher than the national average for China, as referred to in Figure 3(a).
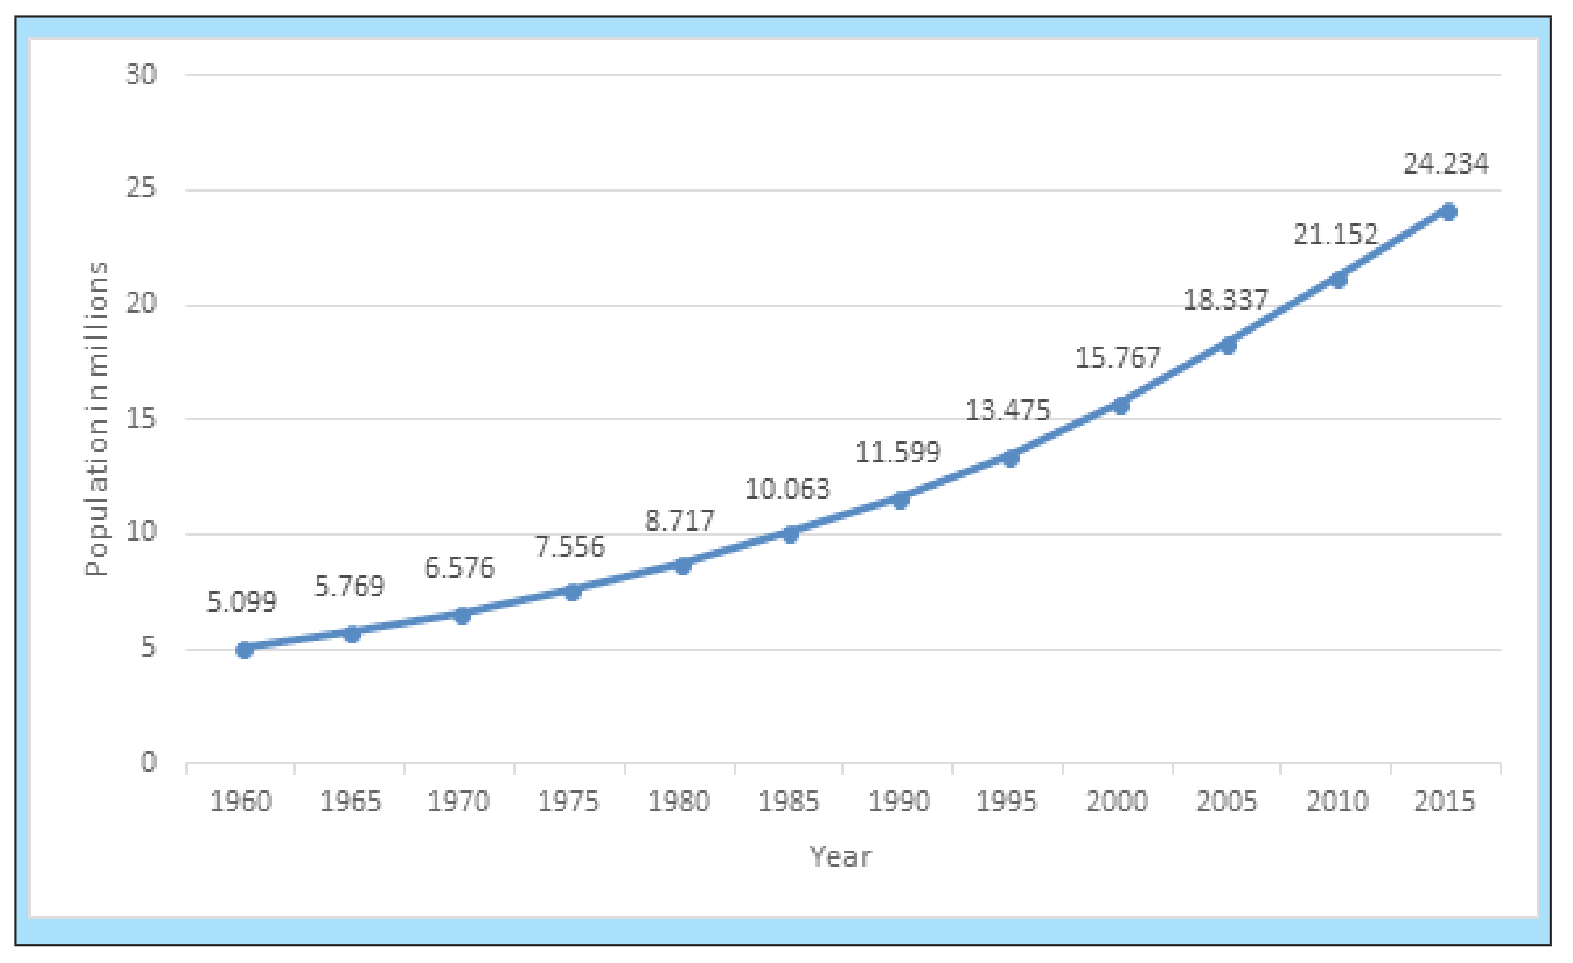
Figure 3(a): In 2019 Beijing had about 20.04 million people.
In 2018, life expectancy in Beijing was 81.2 years compared with 76.4 years for China.
In 2017, policies were implemented to restrict future Beijing population to 23 million by discouraging migration, encouraging relocation and relocating factories outside Beijing.
With reference to Figure 3(b), identify a year in which the population growth rate is negative.
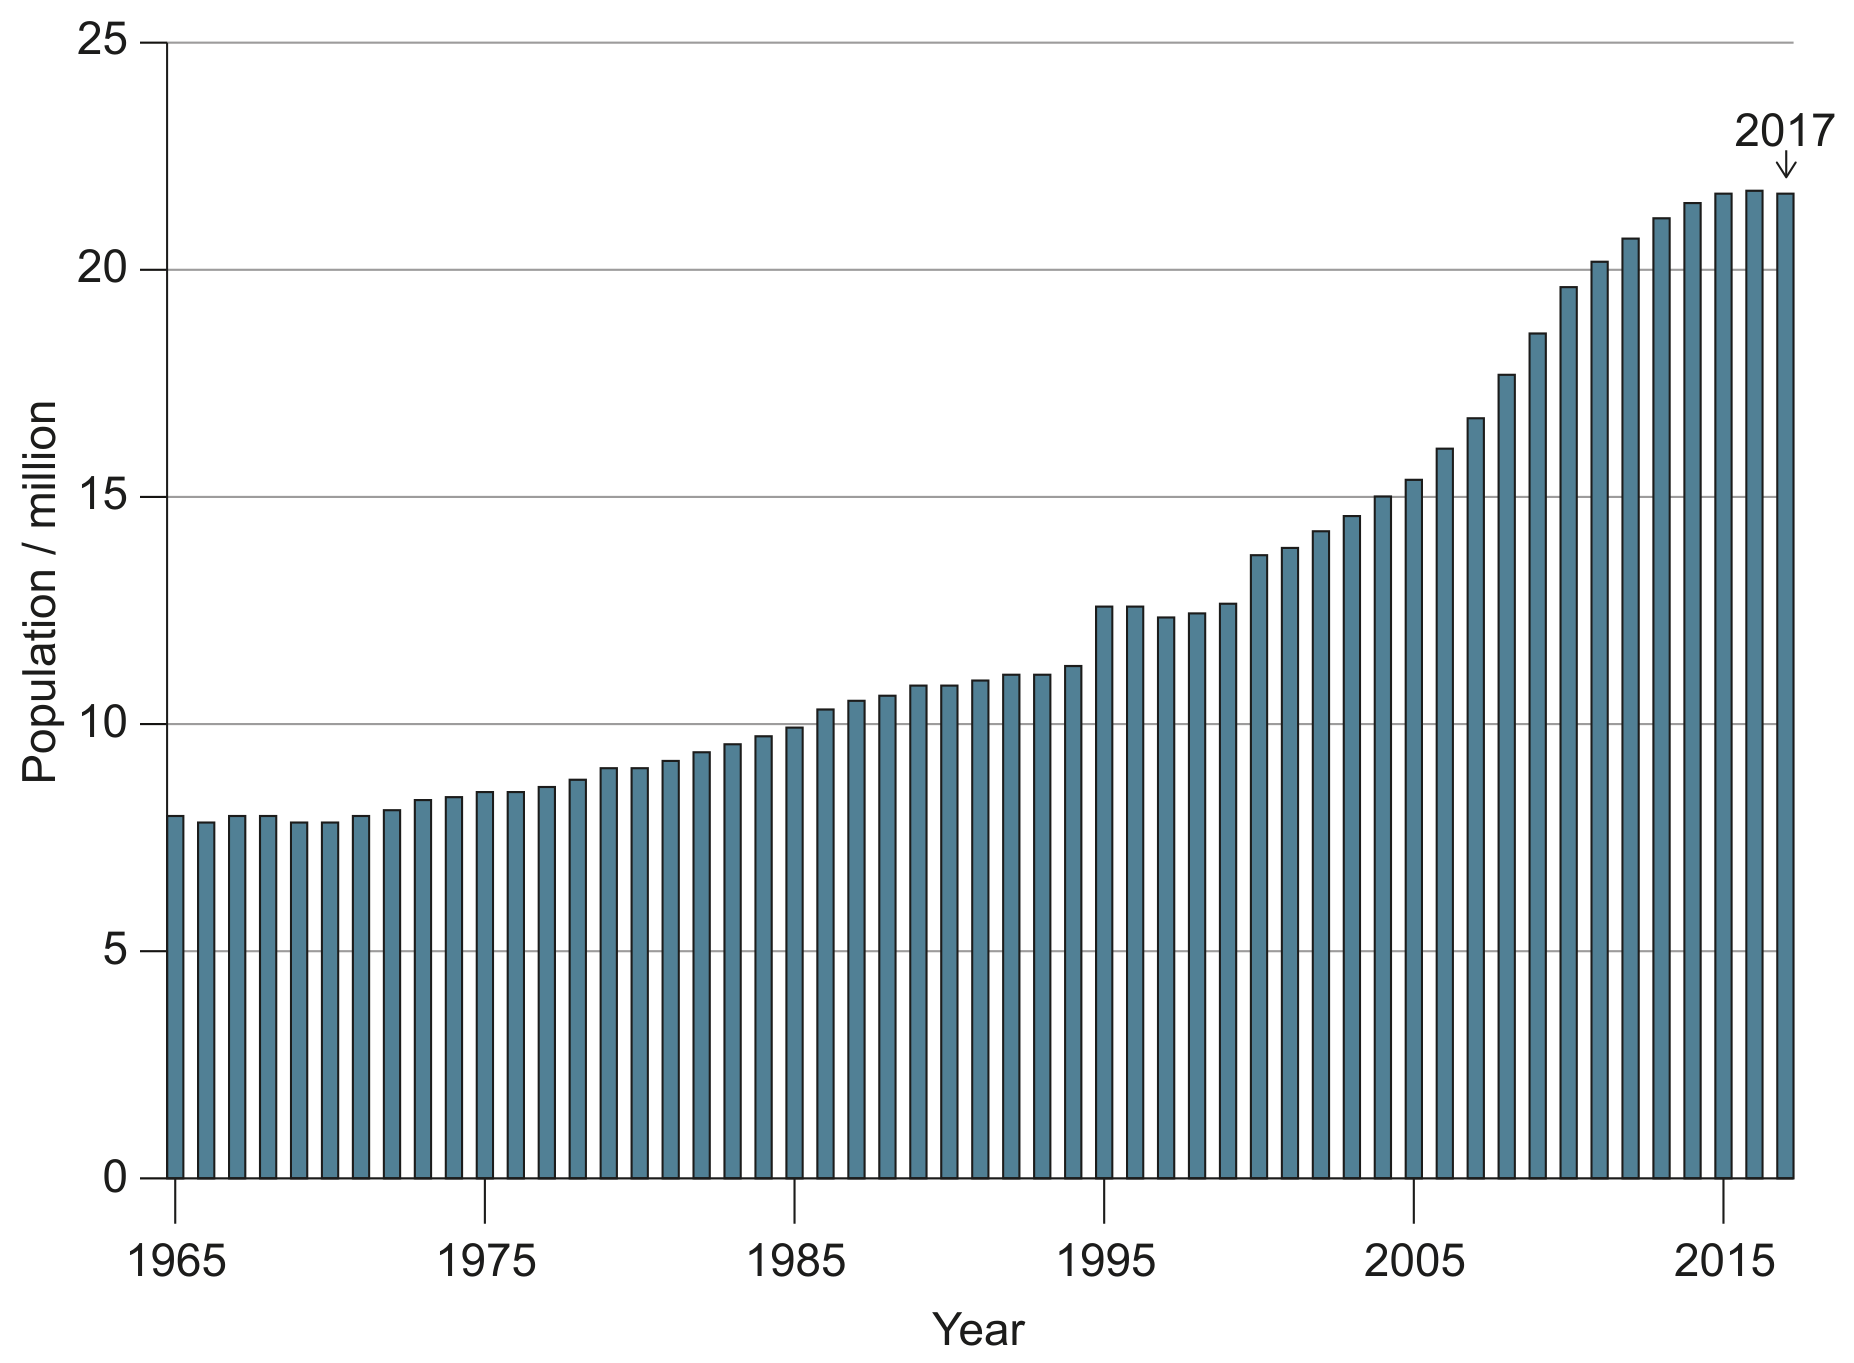
Figure 3(b): Beijing population, 1965-2017
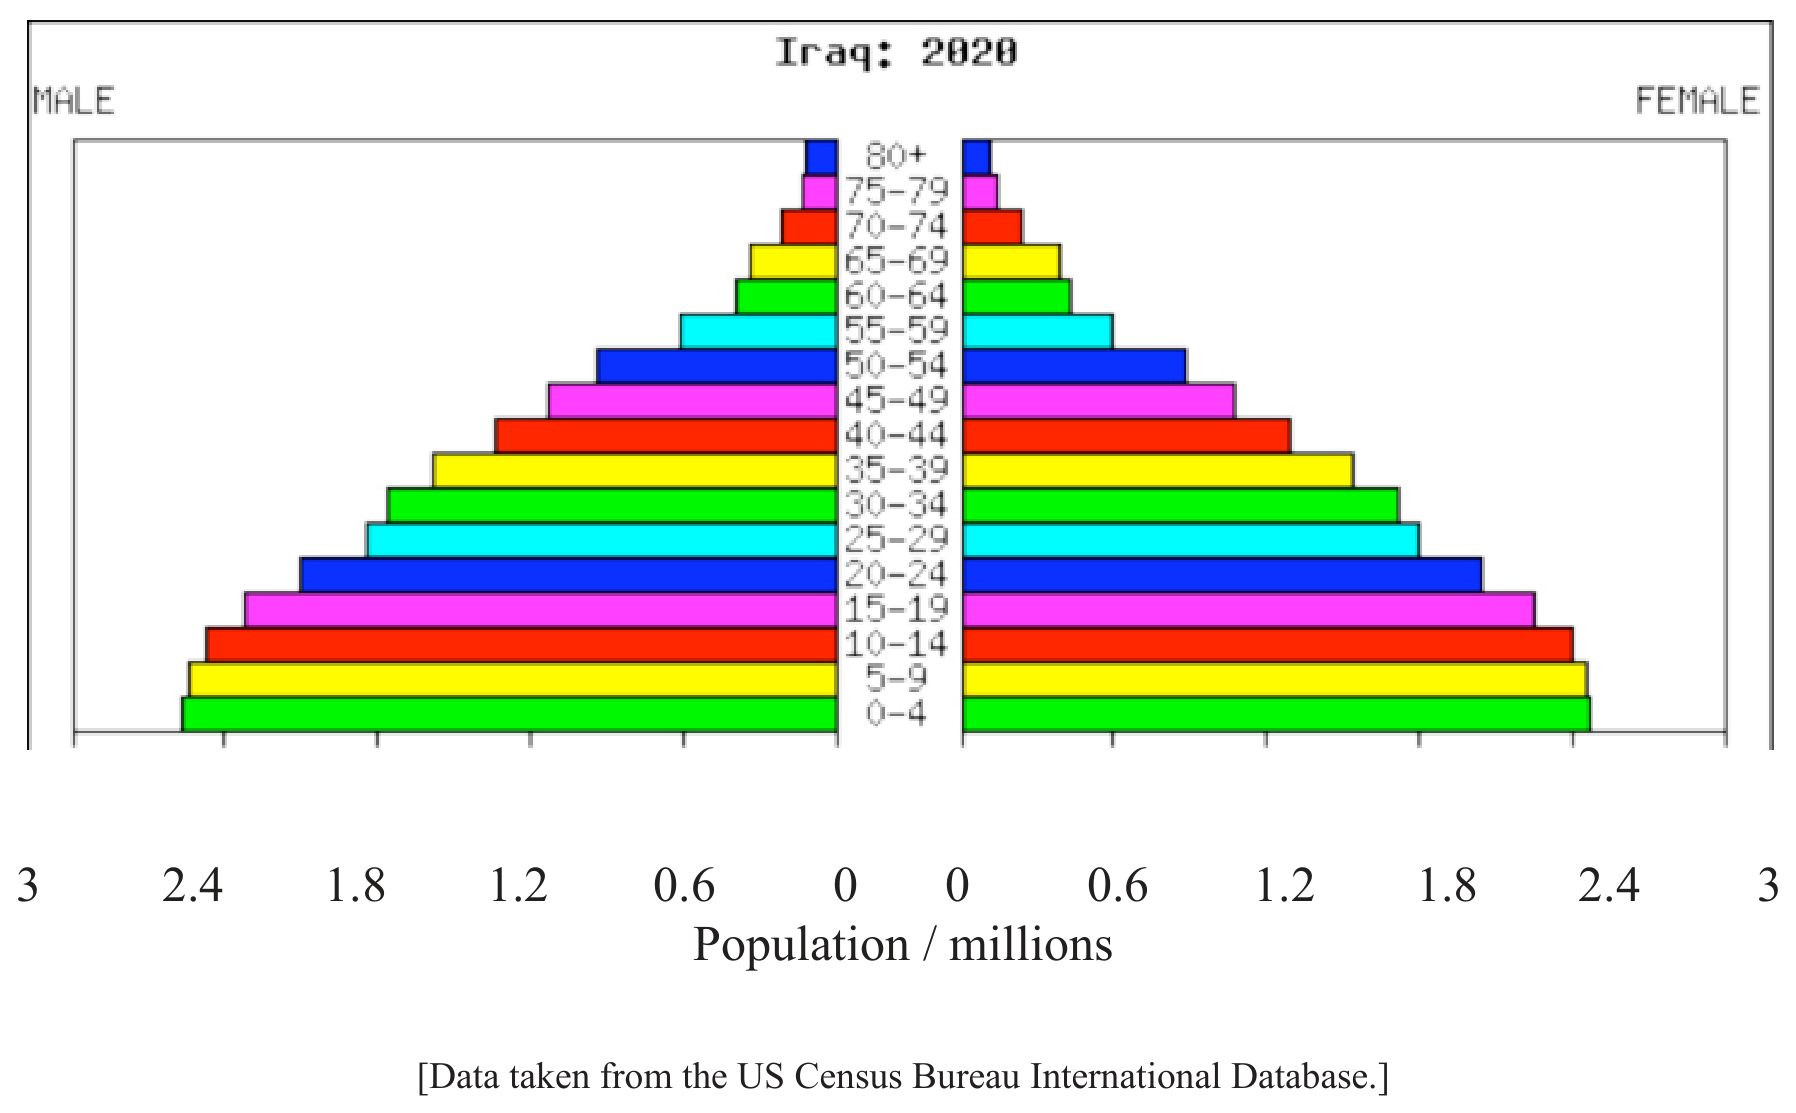
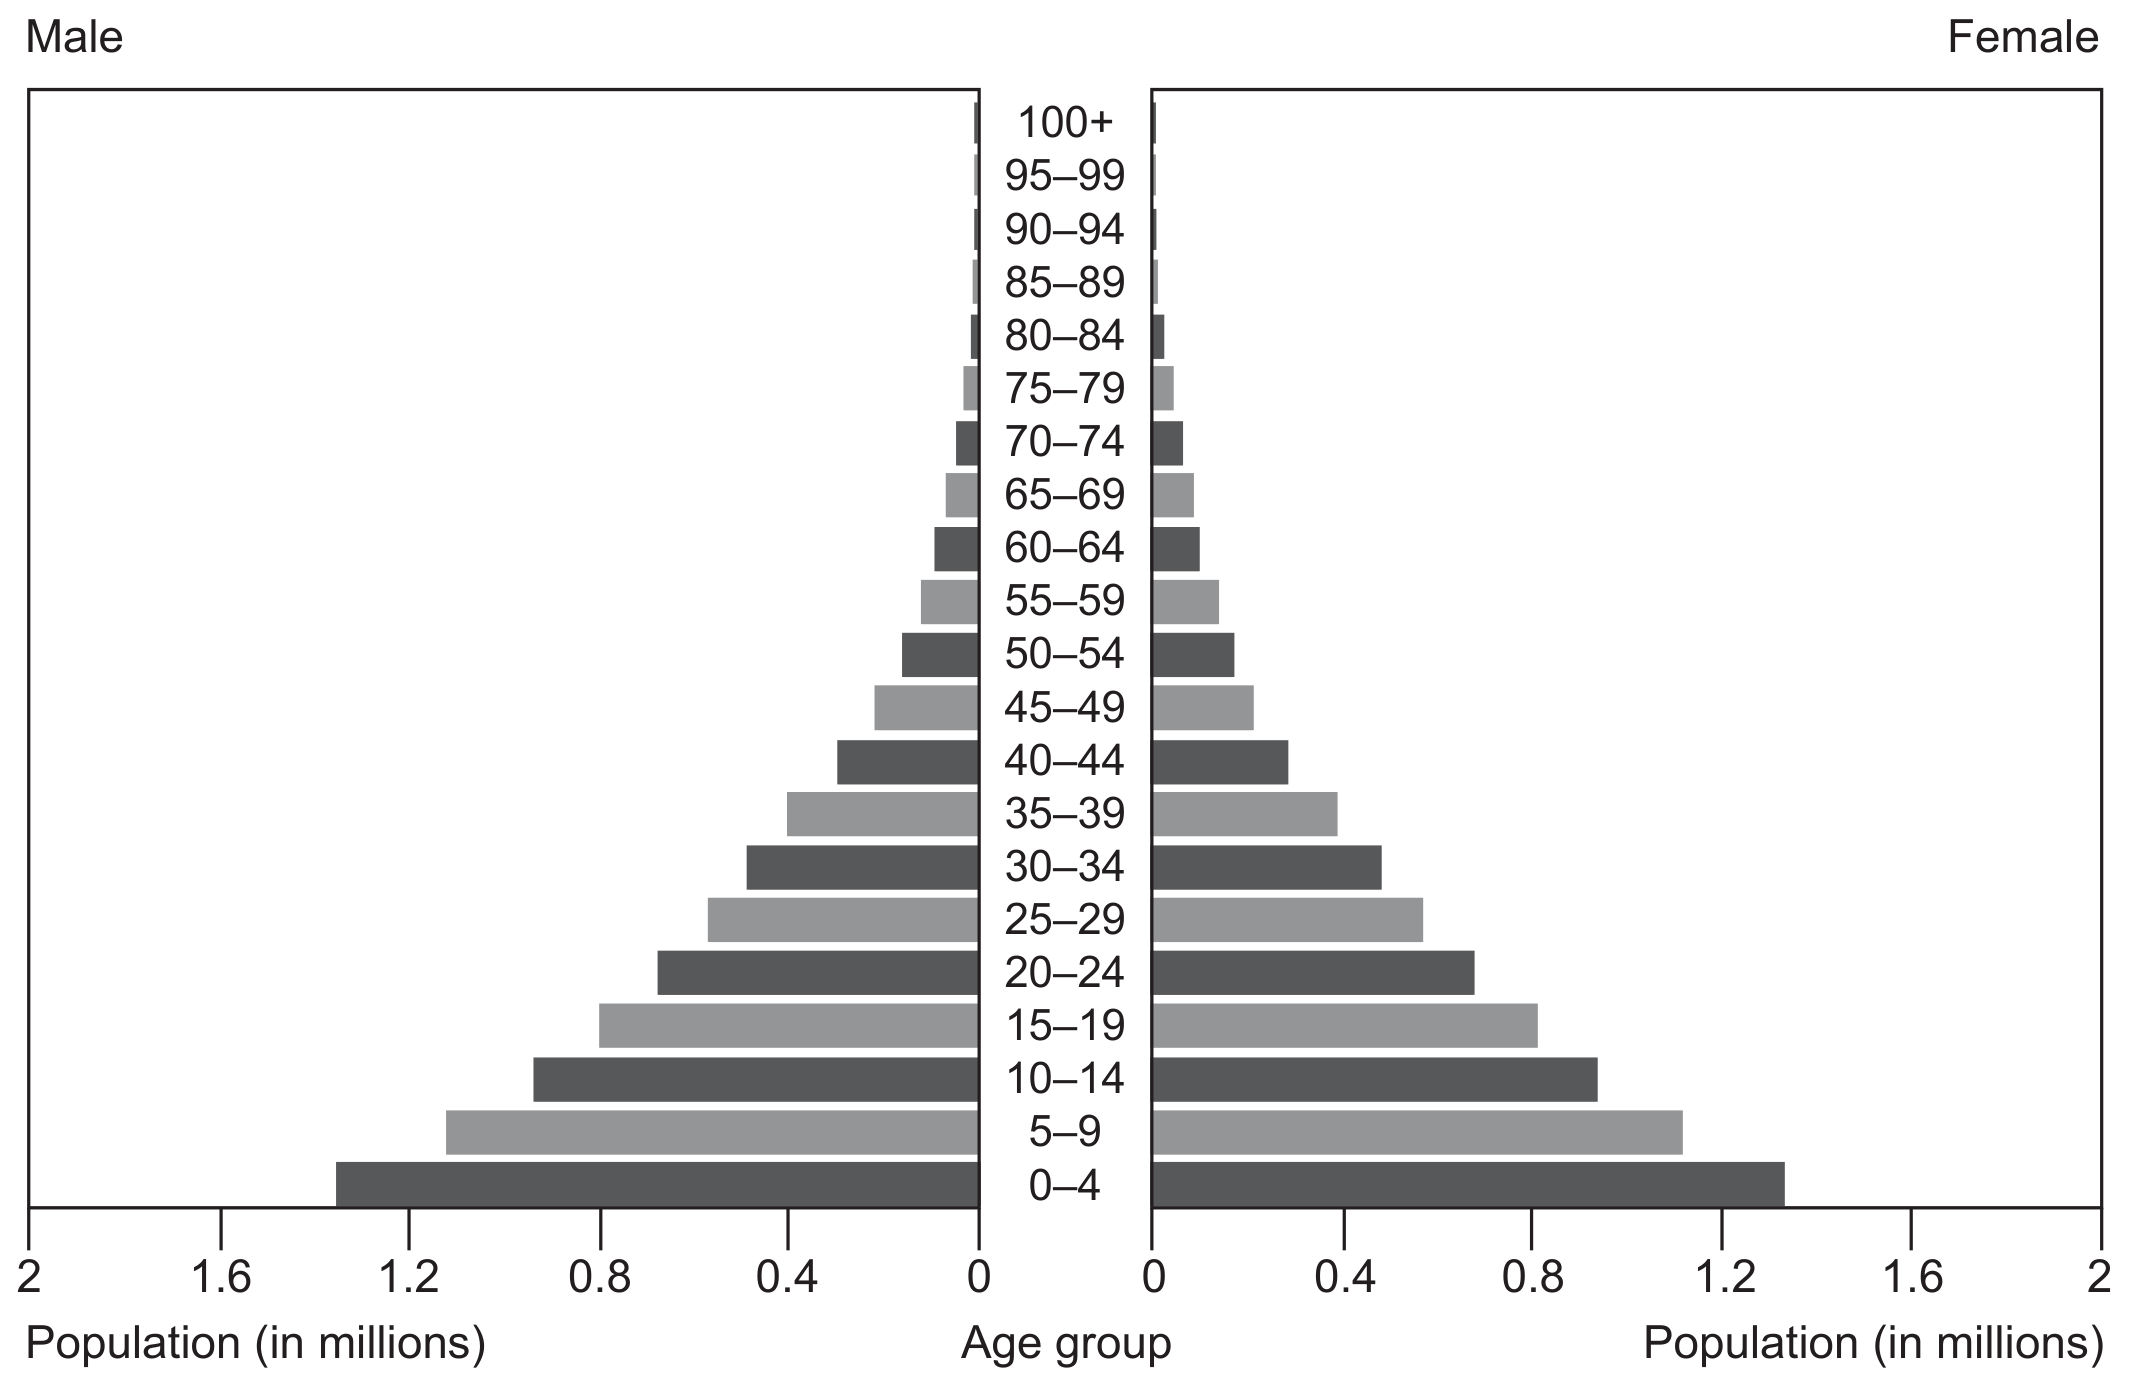
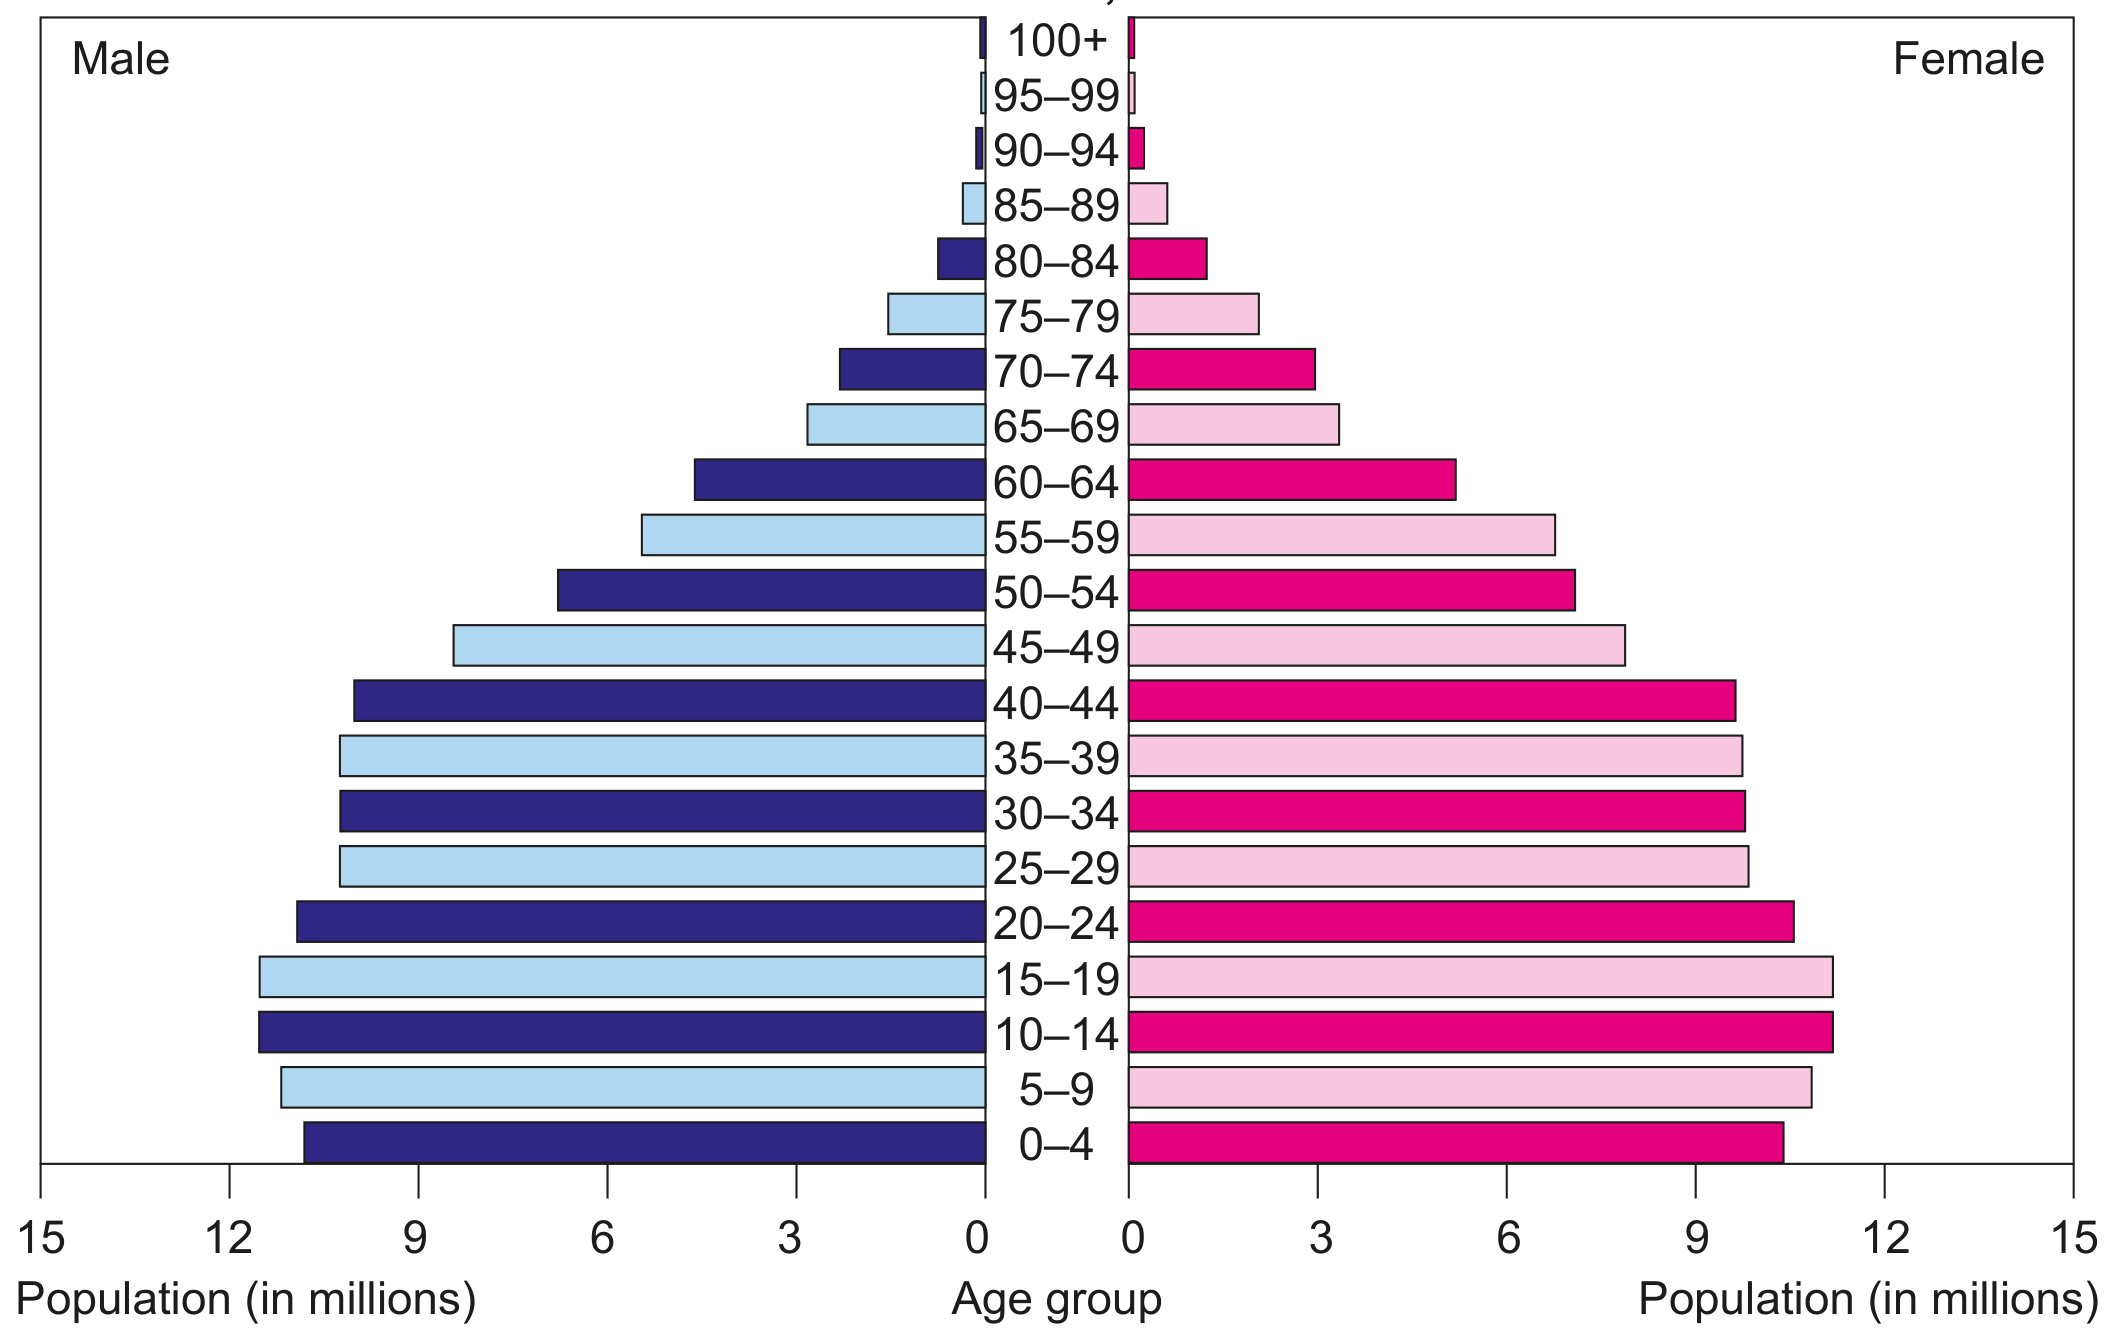
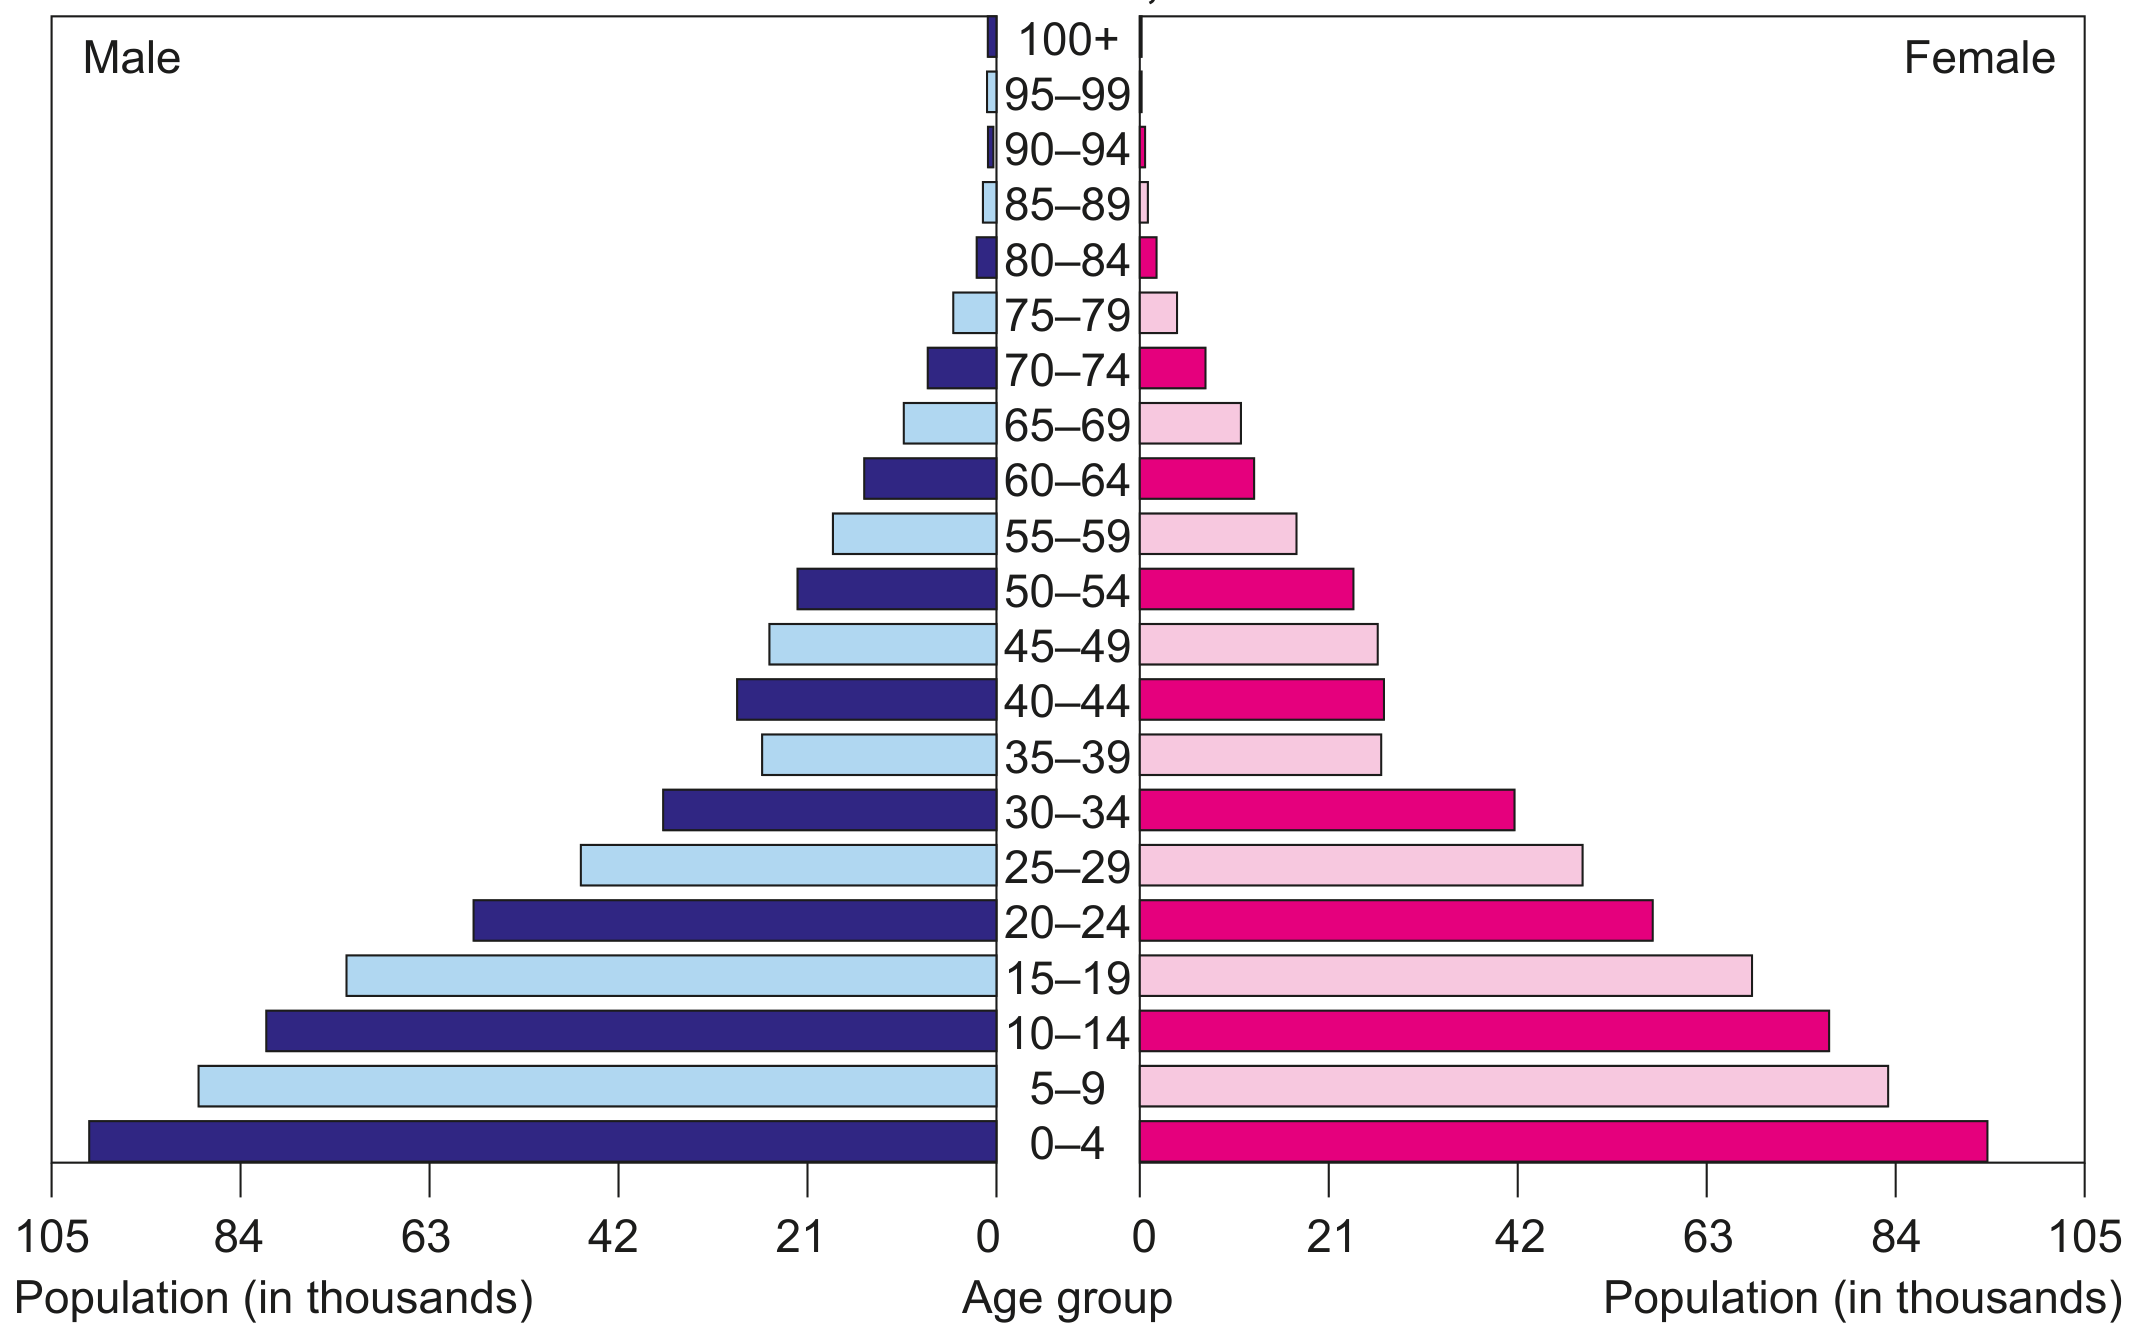
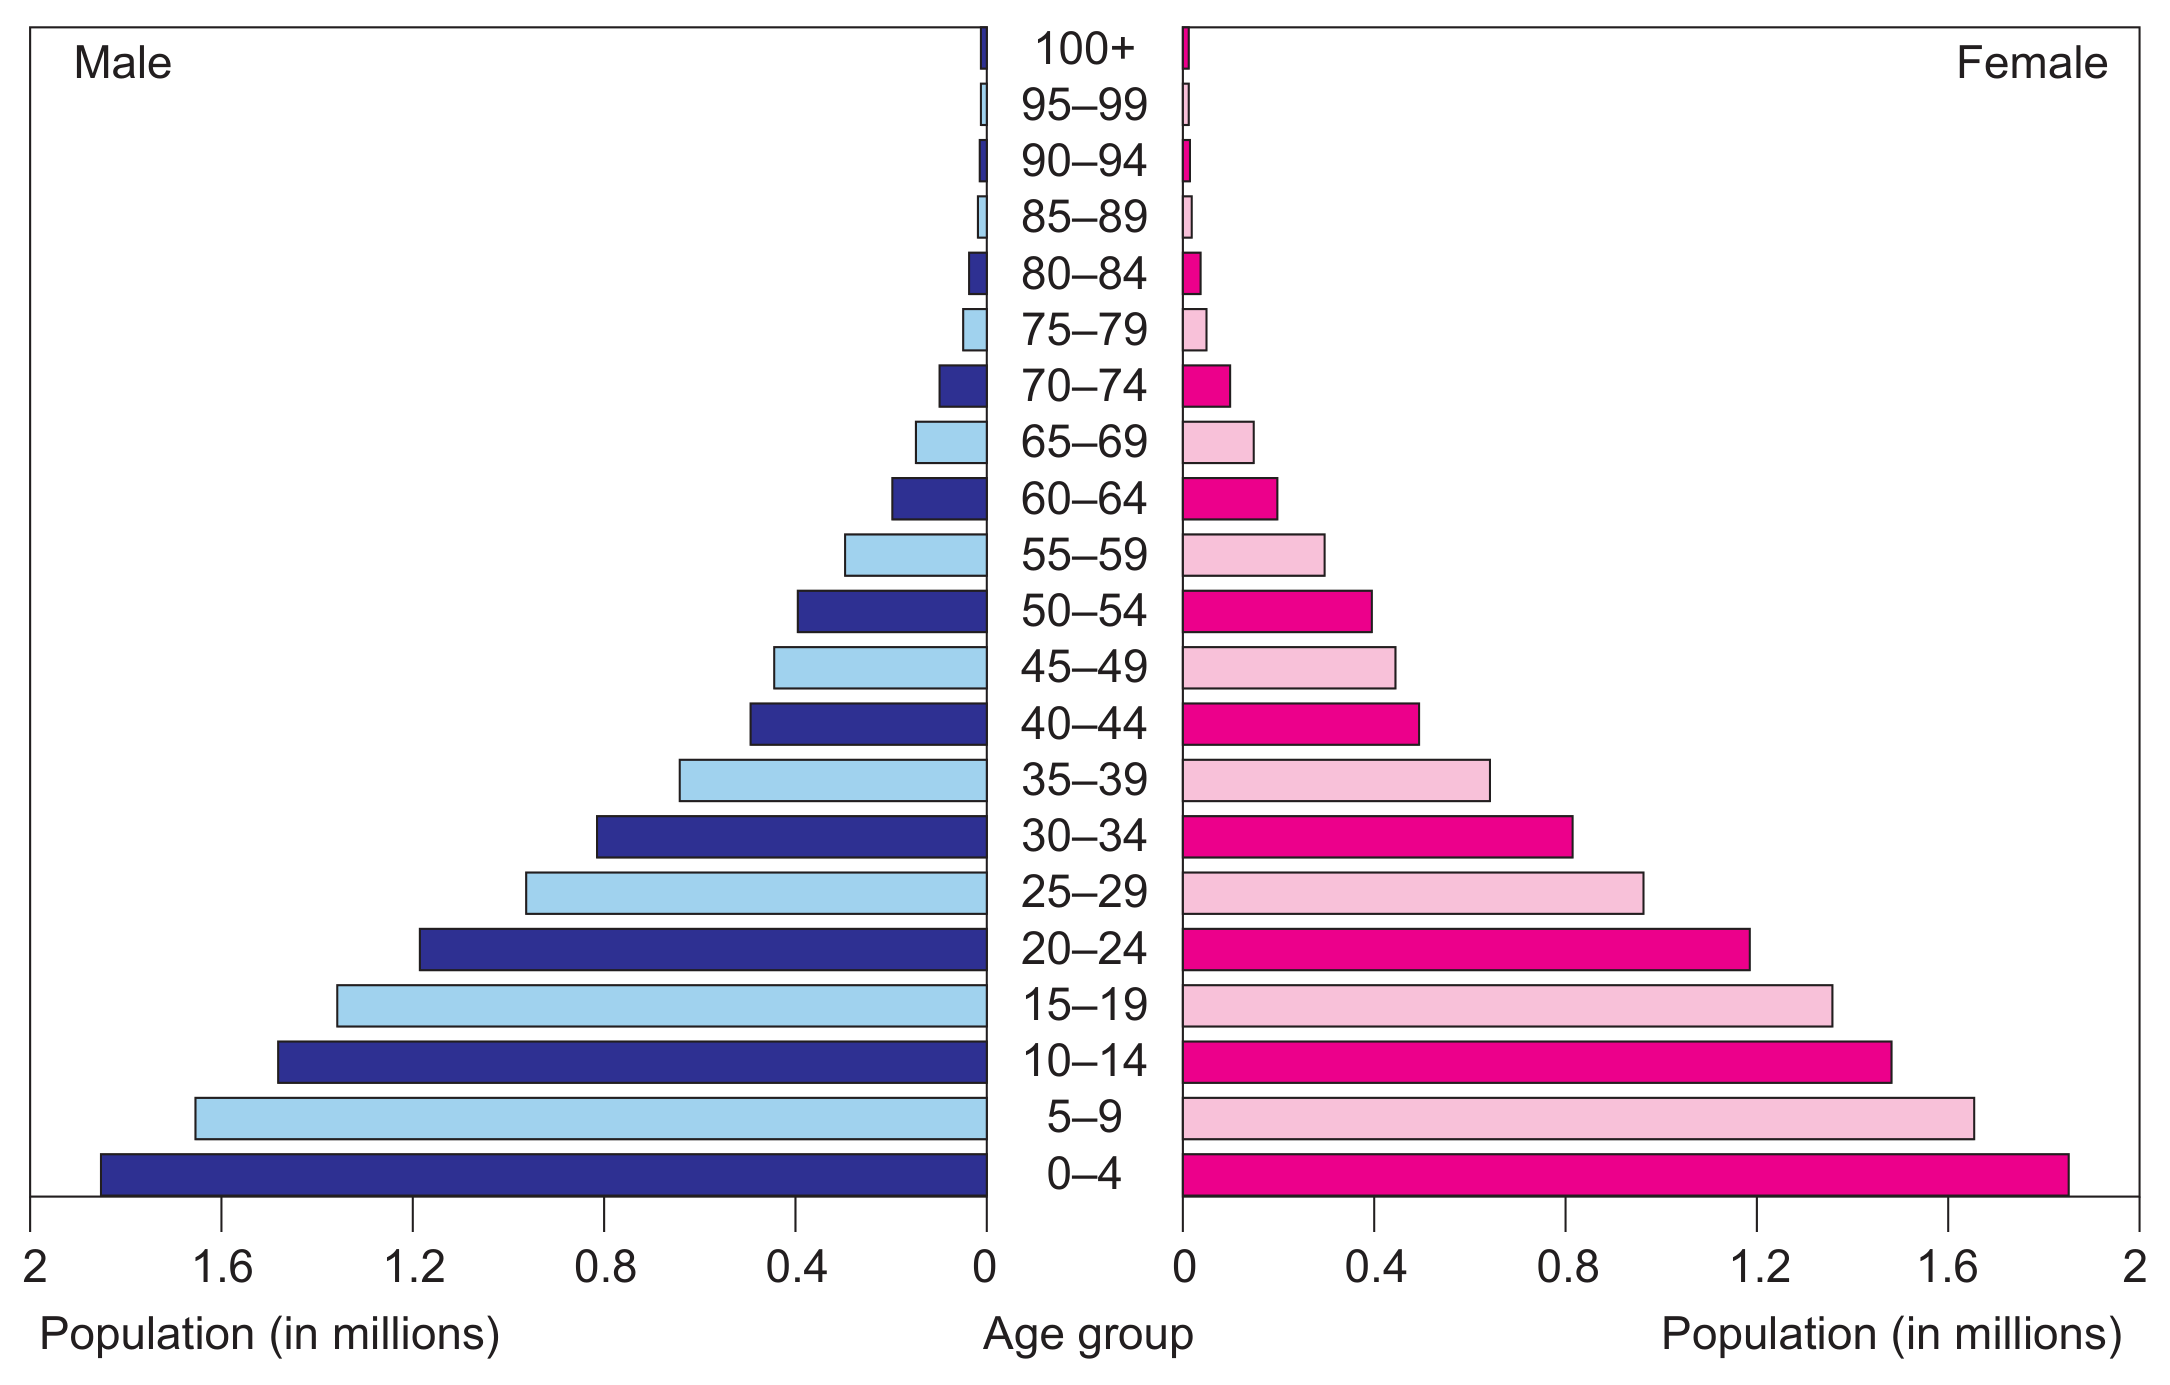
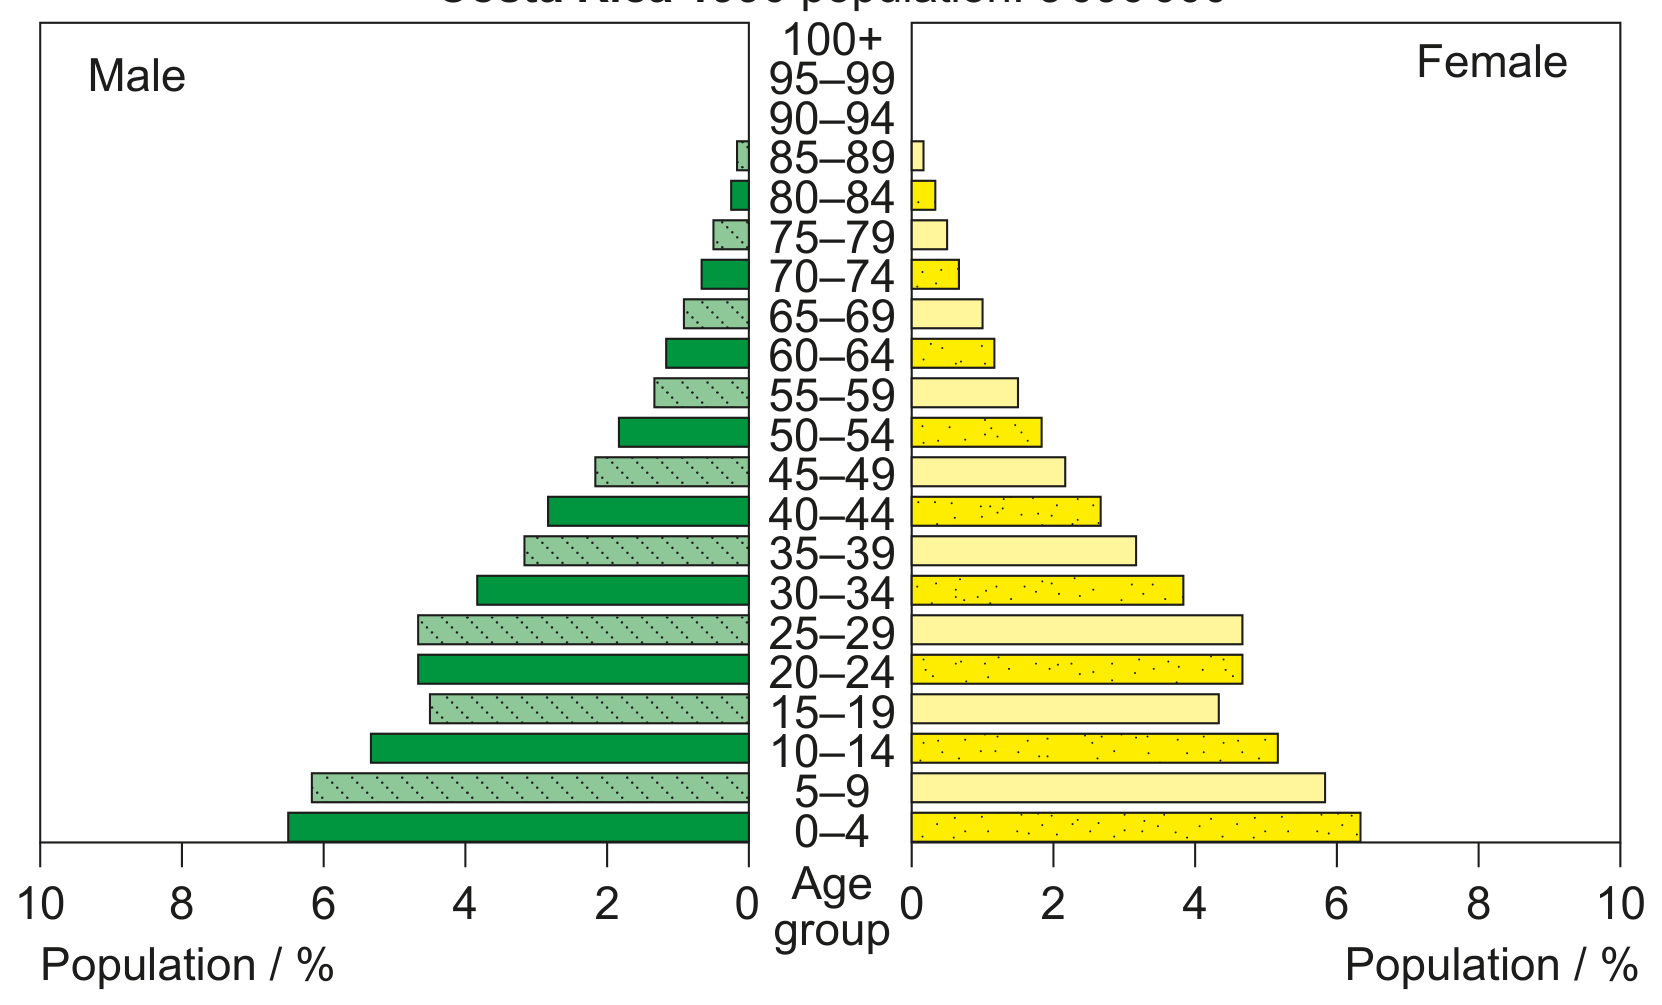
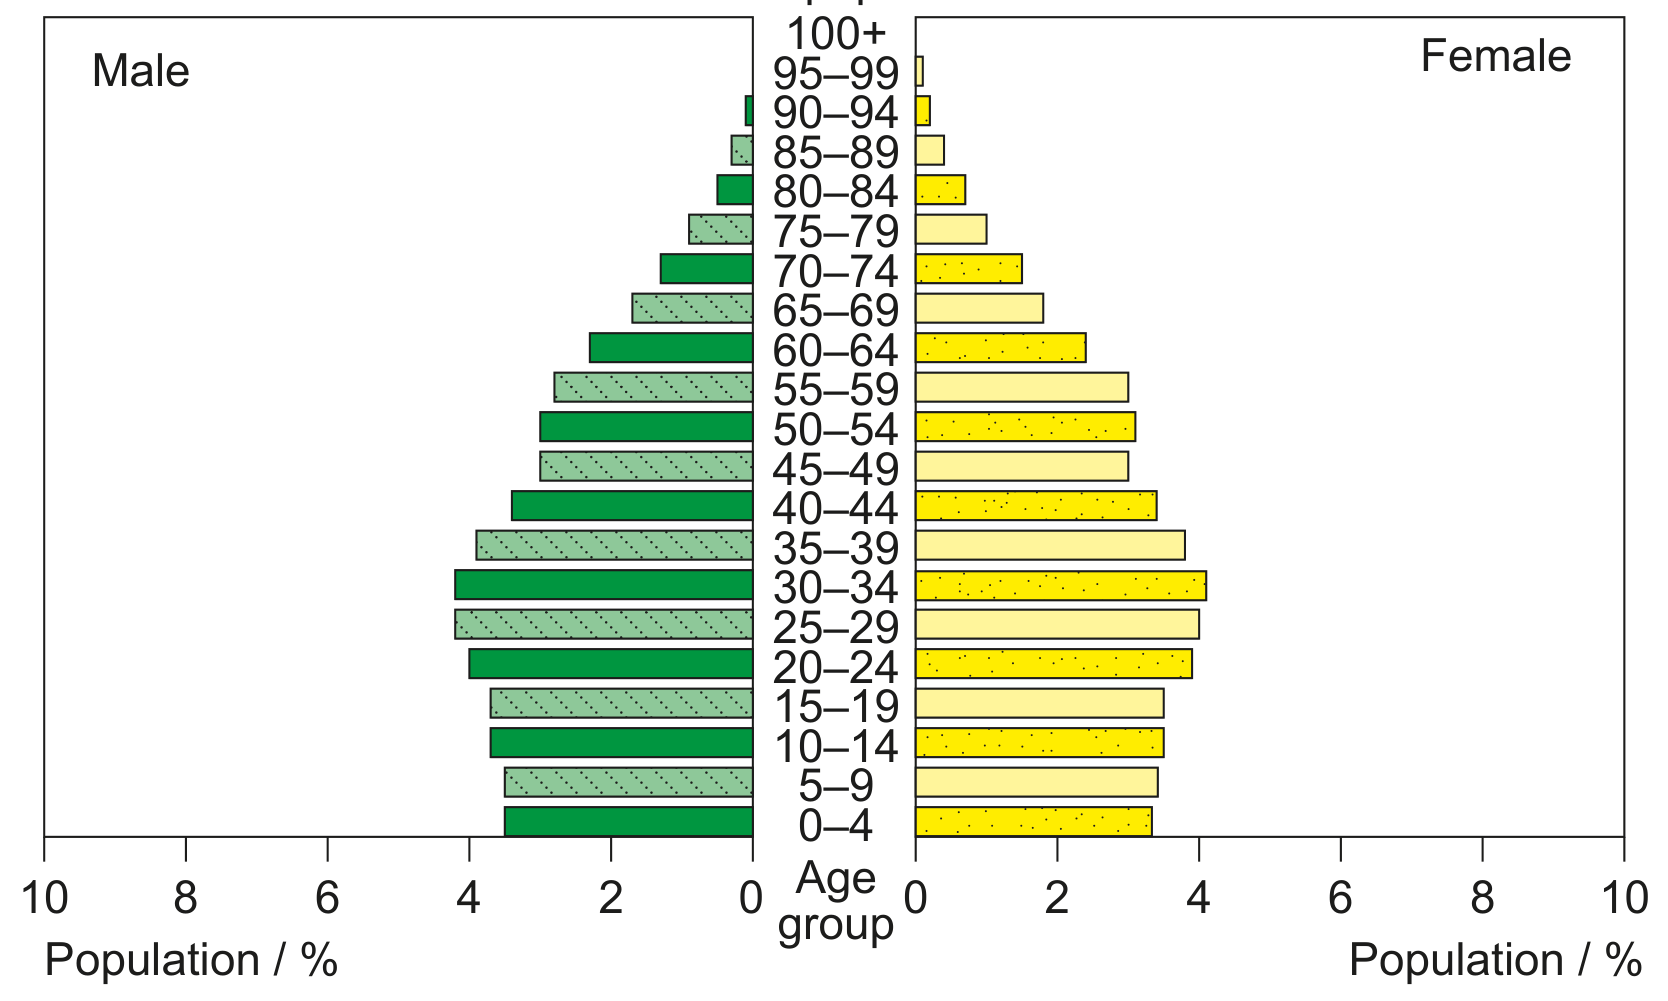
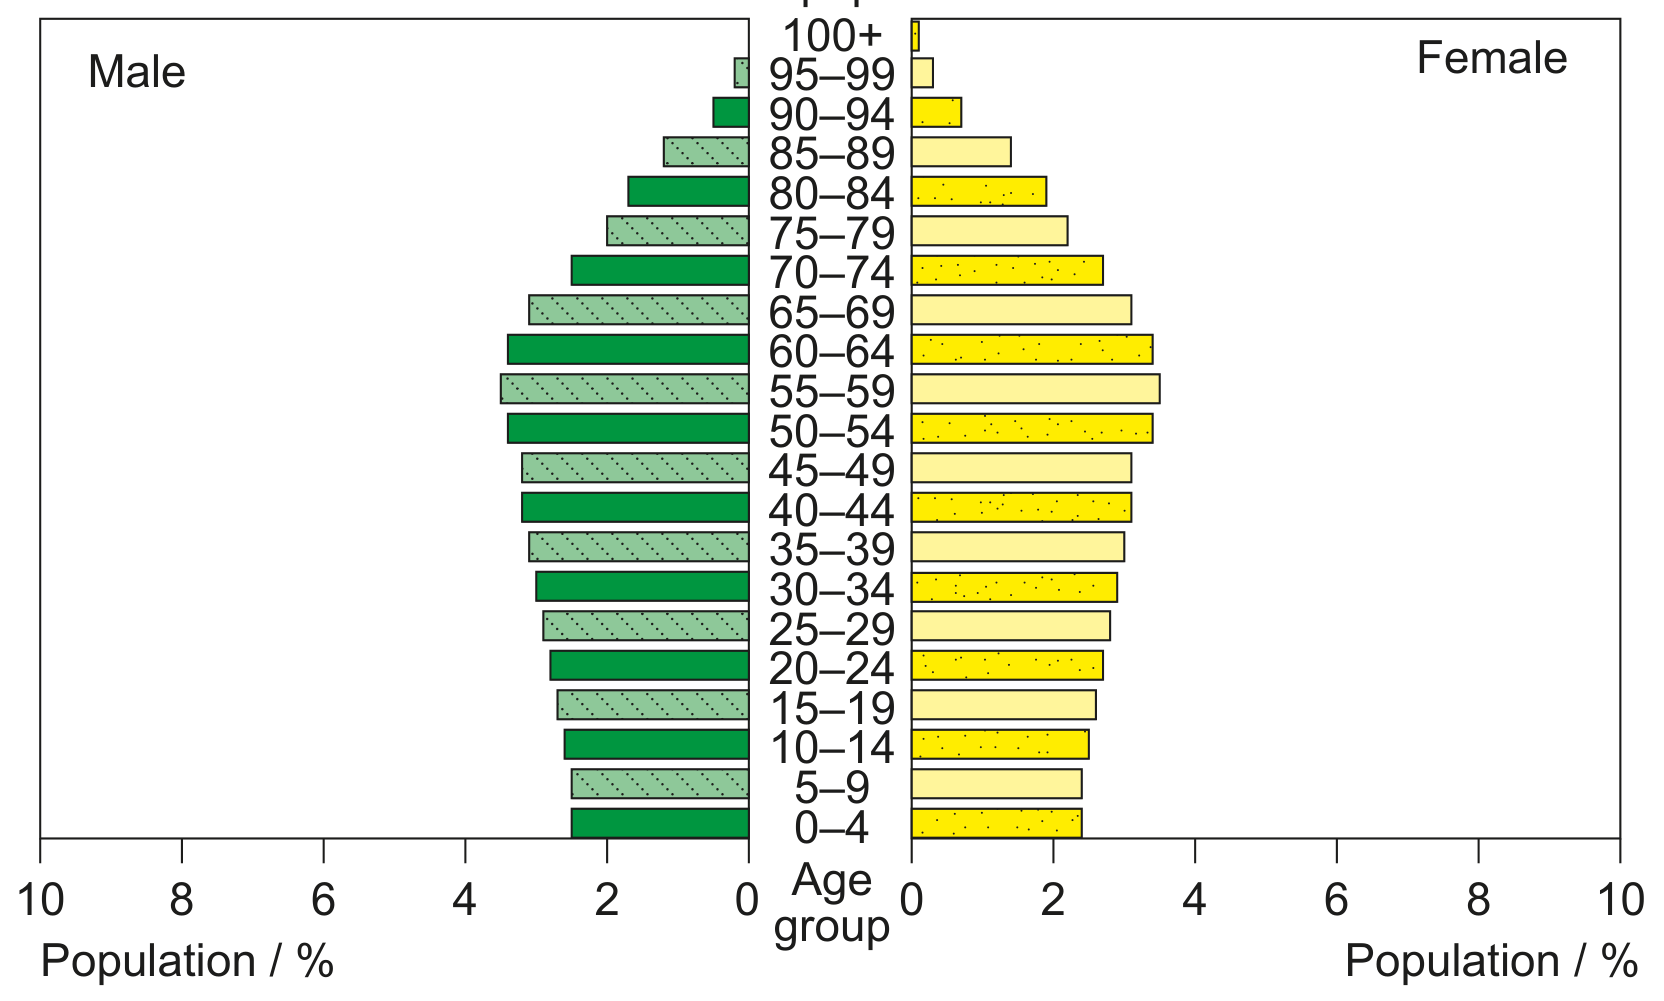
With reference to Figure 3(c), explain two reasons for the changes in the under 30 age groups from 1950 to projections for 2050.
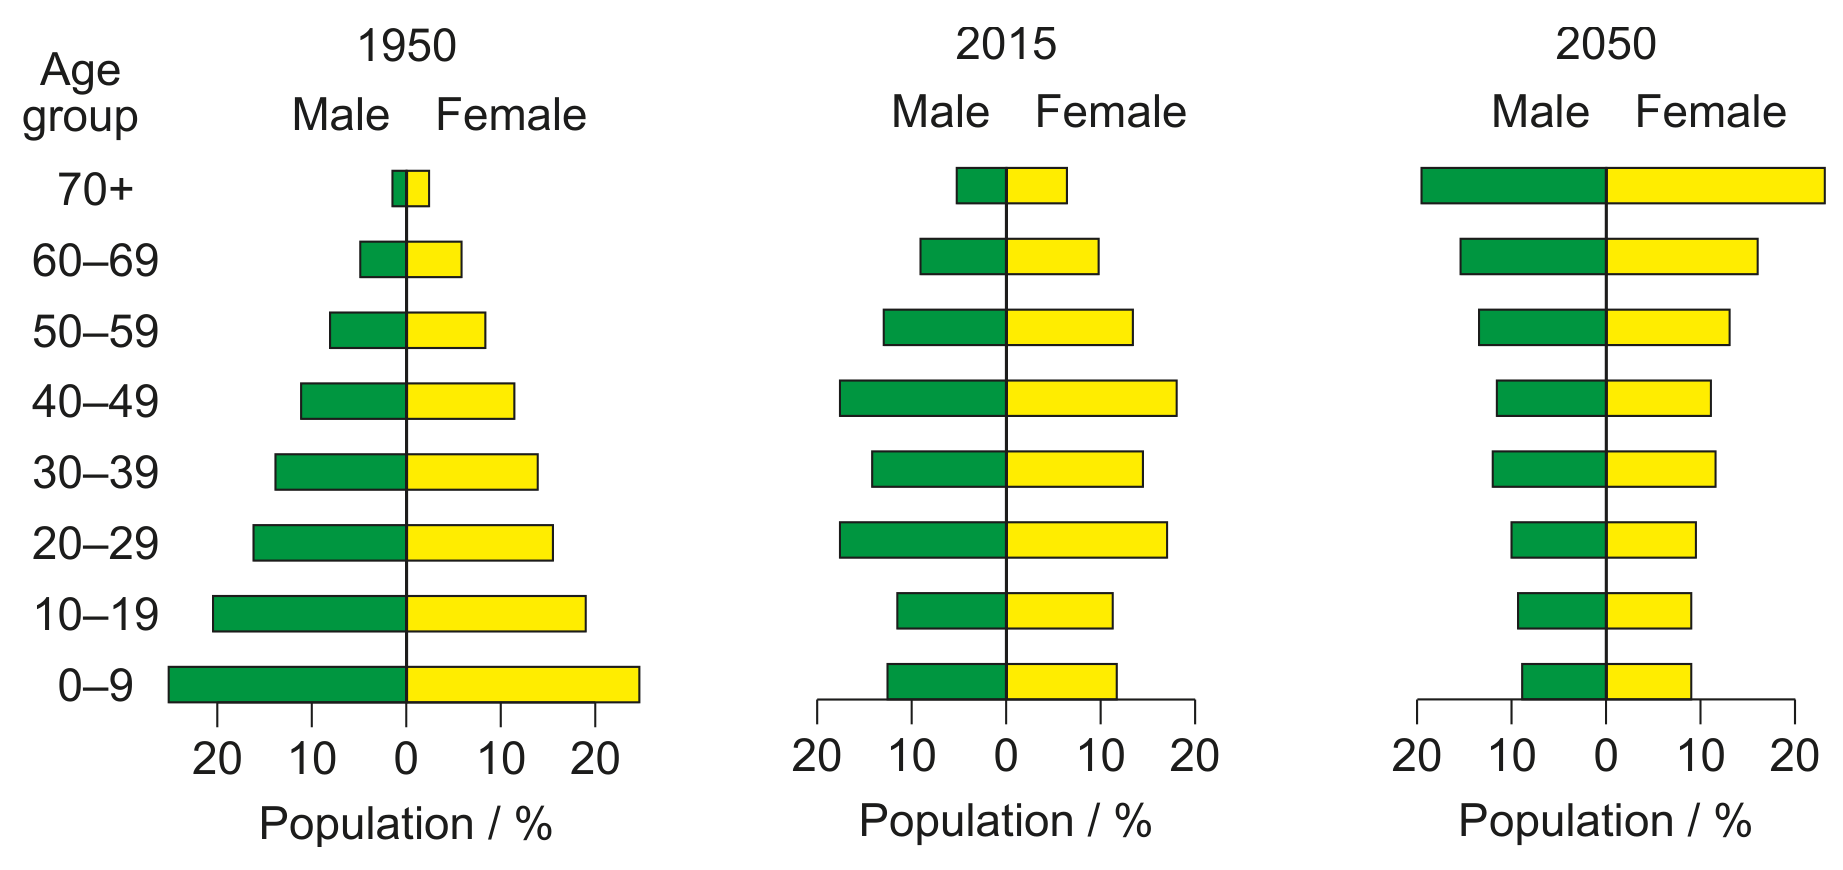
Figure 3(c): Age-gender pyramids for China, 1950, 2015 and projected 2050