With reference to Figure 11, suggest why marshland re-flooding has failed to return the ecosystems to their normal functional level.
Figure 11 on soil and water characteristics over the last 5000 years was removed for copyright reasons in the booklet OCR; no figure image is available locally.
From the early 1950s, dams across the Euphrates and Tigris reduced water flow to the marshes.
After the 1991 Gulf War the marshes were drained by diverting water away, causing wetland desertification and displacement of indigenous people.
By 2002, marshlands had diminished to 760 km^2.
In 2003 floodgates were opened and embankments broken; partial re-flooding occurred but not to historic levels.
High salt concentrations have prevented ecosystem restoration in some areas.
| Component | Natural marsh (Al-Hawizeh) | Re-flooded marsh (Al-Hammar) | Re-flooded marsh (Al-Sanaf) |
|---|---|---|---|
| Salinity / ppt | 0.87 | 0.96 | 17.49 |
| pH | 7.64 | 7.95 | 9.40 |
| Total nitrogen / ug L^{-1} | 464 | 1652 | 2050 |
Figure 10: Water quality of natural and re-flooded marshes
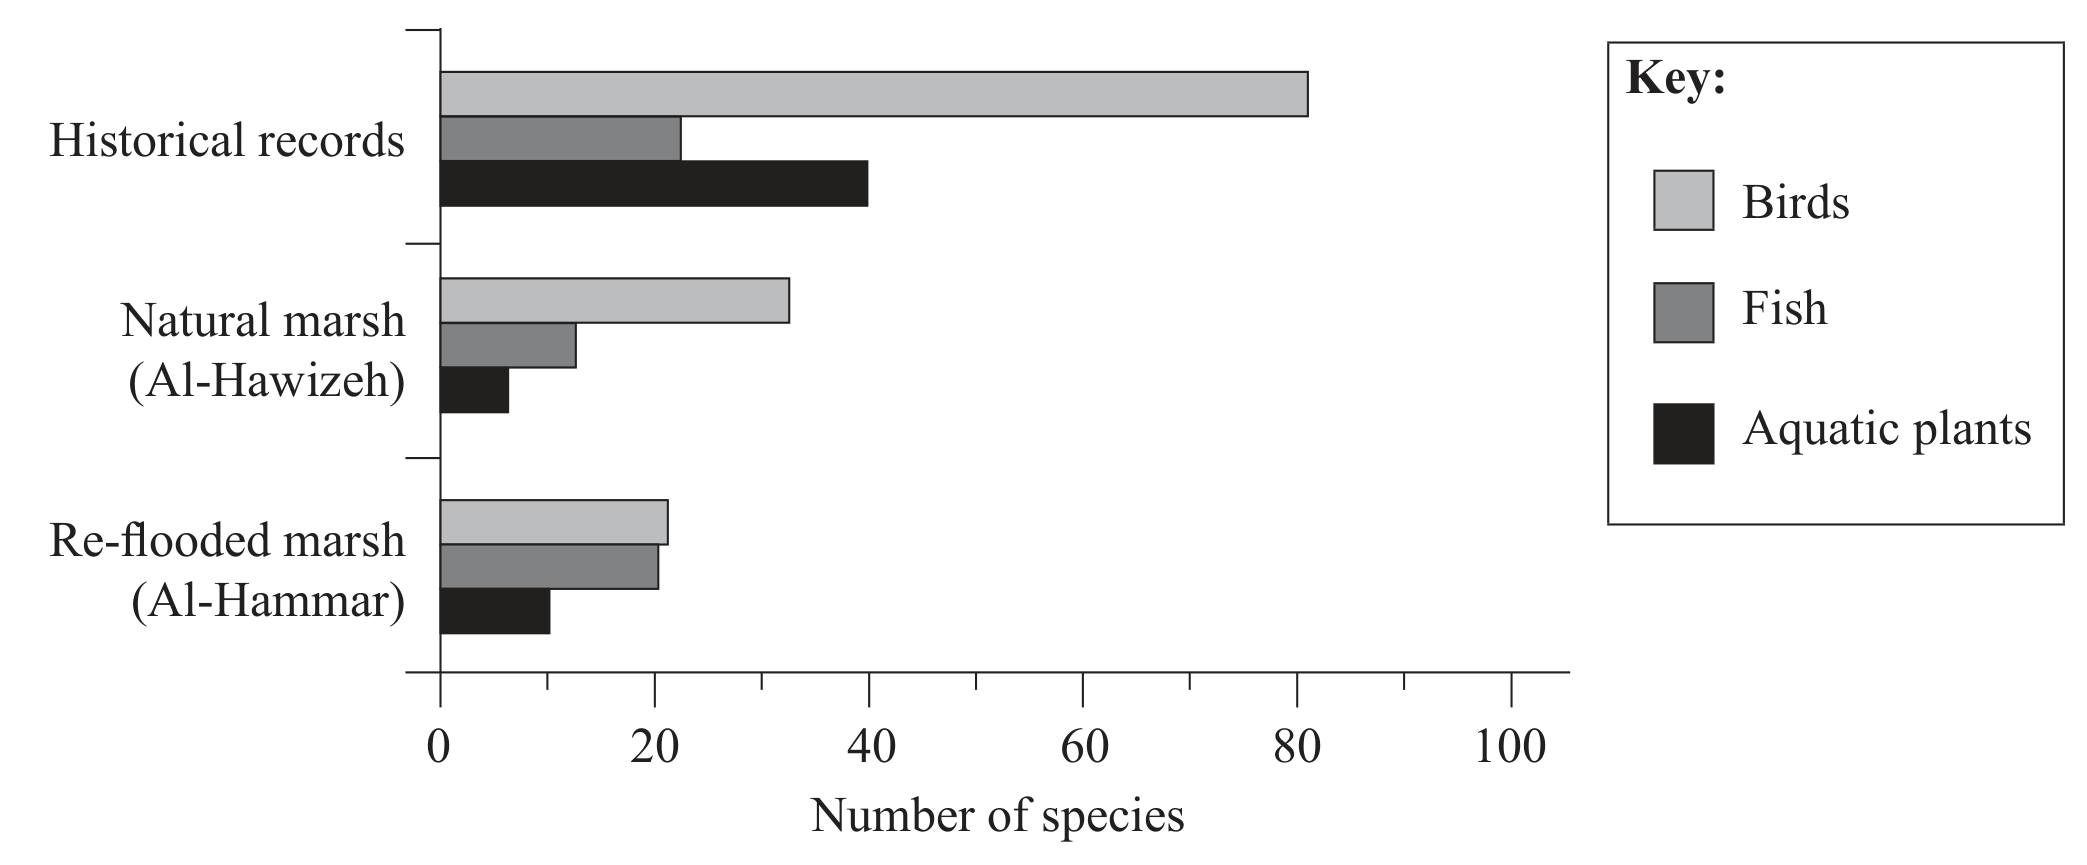
Figure 9: Species numbers in natural and re-flooded marshes