EduNinja
(a)
(i)

Outline the trend shown in the data in Figure 9.

Figure 9: Annual global mean temperature anomalies from three organizations

Figure 9: Annual global mean temperature anomalies from three organizations

[ 1 ]
(ii)

Suggest one reason why there are variations between the published data of the three organizations in Figure 9.

Figure 9: Annual global mean temperature anomalies from three organizations

Figure 9: Annual global mean temperature anomalies from three organizations

[ 1 ]
(a)

Explain why the people of the Niger Delta may be particularly badly affected by global warming in the future.

Figure 1: Regional map of the Niger Delta and Ogoniland case study area

Figure 1: Regional map of the Niger Delta and Ogoniland case study area

The biome forms on a low-lying coastal delta from sediment deposited by the Niger River. Over 80% of the delta floods seasonally and swamps remain when flood waters drain away. It has played an important role in the global economy through slave trade, palm oil and fossil fuels over 400 years. Selected organisms have critical/endangered conservation status. Flora and fauna have only been systematically surveyed since the 1980s. Endemic species include Niger Delta red colobus and Heslop’s pygmy hippopotamus. The delta may be a meeting point for chimpanzee populations. It includes 75% of Africa’s remaining mangrove forests. Swamp forests have no large-scale formal protection, although crocodiles and chimpanzees receive some protection.

Figure 5(b): Climate graph for the Niger Delta

Figure 5(b): Climate graph for the Niger Delta

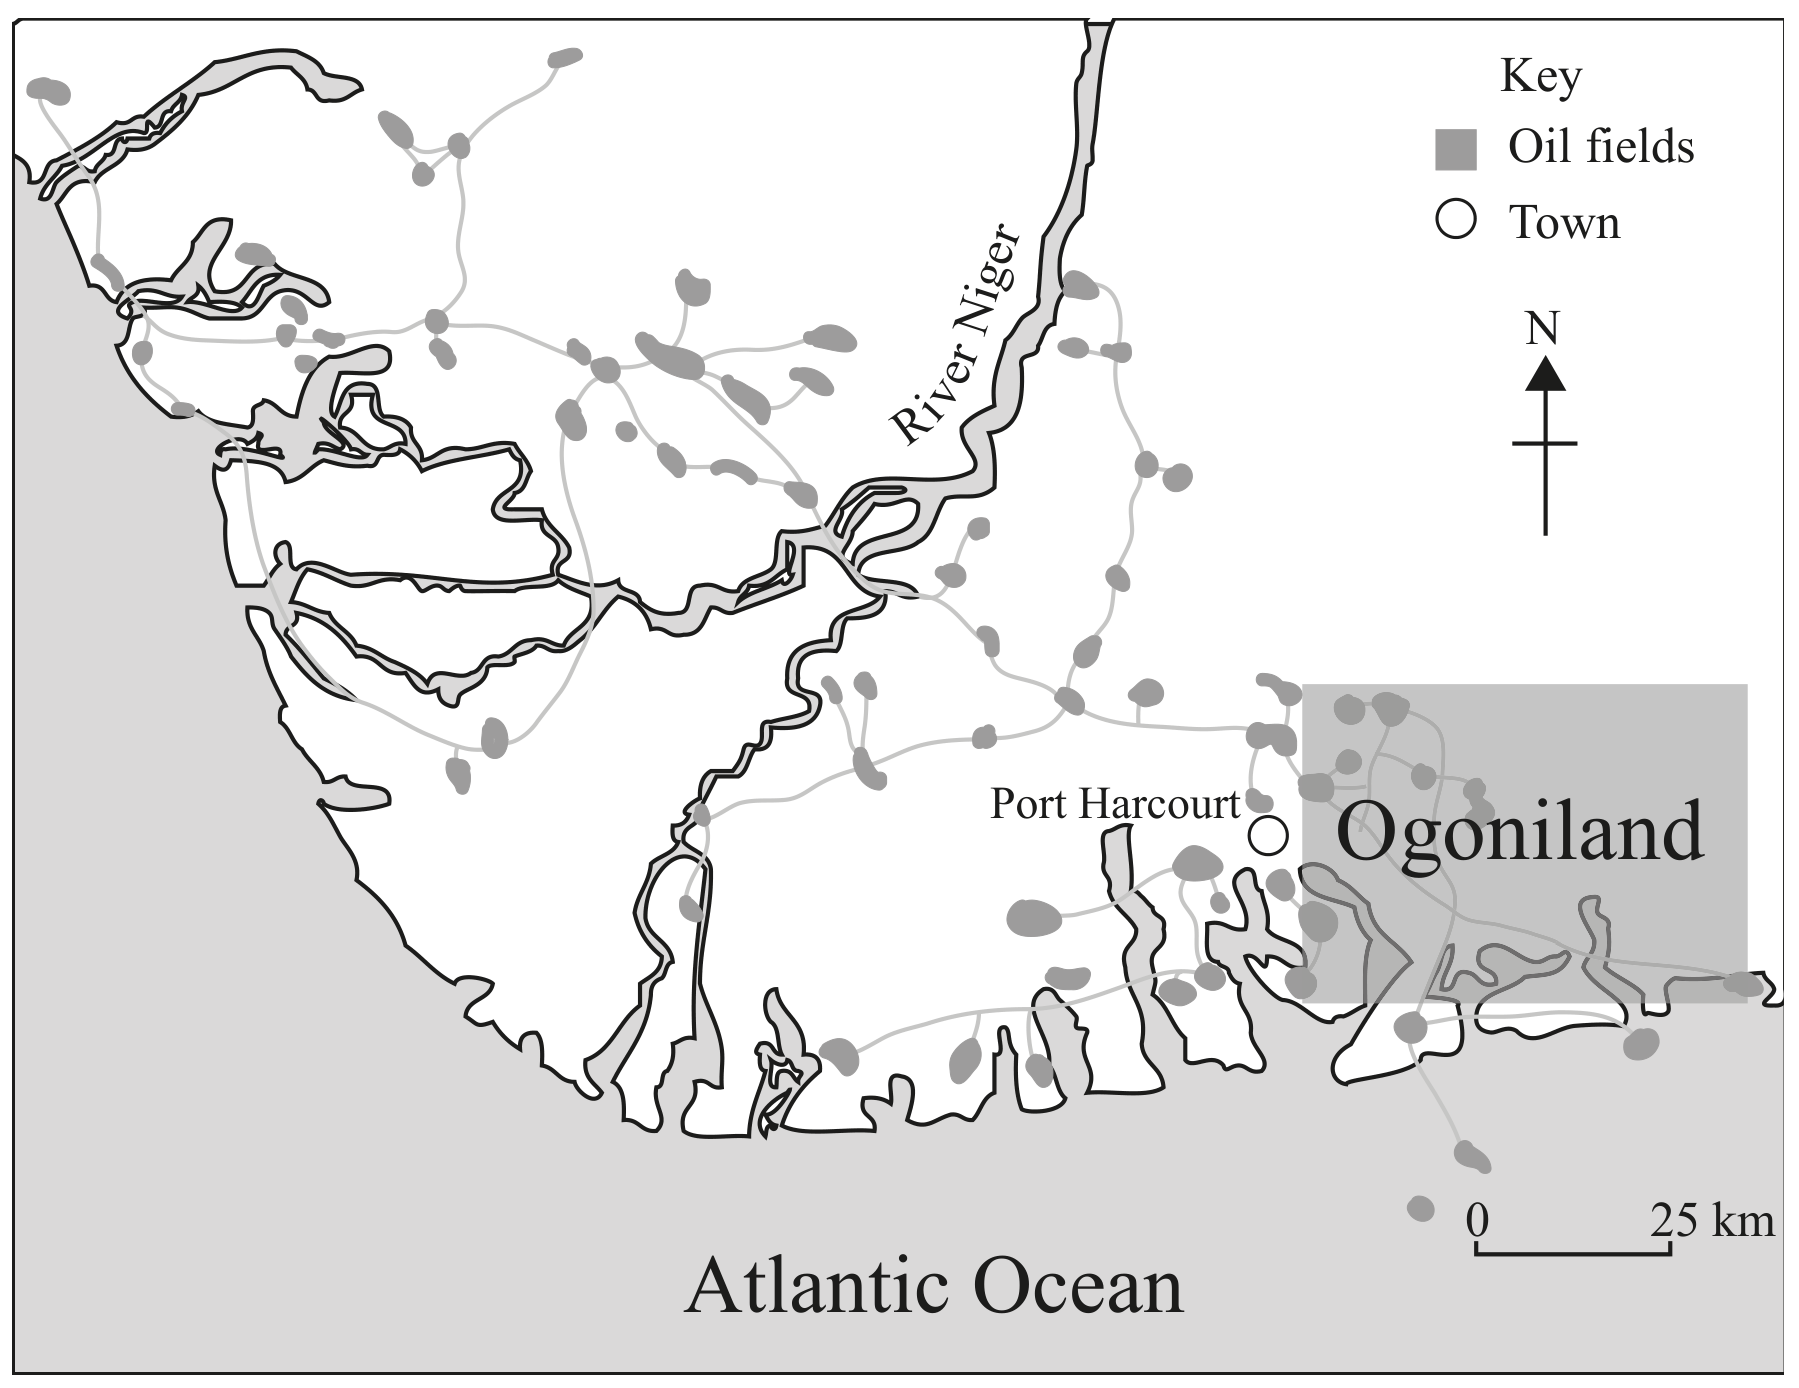
Over 1.5 million tonnes of oil have spilt in the delta over the past 50 years, polluting water sources, damaging crops and fishing grounds. The delta is one of the five most polluted spots on Earth. More than 20000 hectares of mangroves have been destroyed by oil exploration. Natural gas from oil fields is burnt off as flares, potentially causing acid deposition and global warming. There is limited access to electricity, fresh water and health care. The oil industry provides few jobs. Improved transport has enabled exploitation of timber and fish resources, leading to overfishing, habitat loss, overhunting and clashes. Local people hold the oil industry responsible, and pipelines/facilities are regularly attacked.

[ 3 ]
[Maximum number: 5]

Evaluate the possible impacts of climate change on Iceland.

Land area 103000 km². Terrain is mountainous and volcanic. Iceland is isolated, with low biological diversity and few endemic species. Only 0.7% of land is suitable for growing crops; harsh climate limits farming to livestock and geothermally heated greenhouses. 60% of the population live in Reykjavik. Total fertility rate is two children per woman. Important industries include fishing, aluminium smelting and tourism. Ecological footprint is 7.4 GHa compared with a world average of 2.6 GHa. Iceland is a high income representative democracy ranked 13th on the HDI. It was badly affected by the global financial crisis in 2008. Hydroelectric and geothermal power provide 85% of primary energy. Iceland expects to be energy independent using 100% renewable energy by 2050. The government recently approved oil exploration in Icelandic waters.

Figure 4(b): Surface air temperature anomaly for May 2016 to April 2017

Figure 4(b): Surface air temperature anomaly for May 2016 to April 2017

Estimated worldwide population is twelve million. 60% of the world’s puffins live in Iceland. Puffins lay one egg per year in cliff burrows in June-July and adults bring small fish to their young. They are classified as vulnerable on the IUCN Red List and the current population is in decline. Threats include overfishing, native predators, introduced predators, hunting and egg collection by humans, oil spills, extreme weather and tourist disturbance. Puffins can be hunted legally in Iceland in April by sky fishing; their meat and eggs are commonly featured on hotel menus. Puffin populations are affected by extreme weather and food availability.

Figure 8(c): Food web for the Atlantic puffin

Figure 8(c): Food web for the Atlantic puffin

Figure 9(b): Hydropower and geothermal energy resources in Iceland

Figure 9(b): Hydropower and geothermal energy resources in Iceland

[Maximum number: 2]

Outline two possible effects of climate change on marine coastal ecosystems within the Coral Triangle.

Coral reefs and mangroves in the Coral Triangle have declined by over 40% since the 1970s; over 85% of coral reefs are threatened by population growth and human activity.
Threats include removal of mangroves, unsustainable/destructive fishing, demand for turtle products and shark fins, land-based pollution, tourism impacts and climate change.
Tourism threats include sewage, plastic waste, coral trampling, boat-anchor damage, stress to wildlife and collection of wildlife souvenirs.

[Maximum number: 4]
Figure 3: Tropospheric ozone levels in Mexico City

Figure 3: Tropospheric ozone levels in Mexico City

(a)

Suggest possible reasons for the overall trends of tropospheric ozone levels in Figure 3.

[ 4 ]
[Maximum number: 2]

There are concerns that increased carbon dioxide ( CO2\mathrm{CO}_{2} ) emissions are leading to changes in the global climate.

Figure 3: CO2 emissions for select countries in 2007 and 2030 (Projected)

Figure 3: CO2 emissions for select countries in 2007 and 2030 (Projected)

(a)

Identify two possible reasons for the projected change in CO2\mathrm{CO}_{2} emissions for China.

[ 2 ]
(a)

Climate change is an environmental issue of global concern. Outline one other environmental issue and explain why it is a global problem.

[ 5 ]
(a)
(i)

Explain why some countries are trying to reduce their carbon dioxide emissions levels.

[ 2 ]
(a)

The long term effects of global warming may influence the carrying capacity for human populations.

Discuss whether global warming is likely to increase or decrease carrying capacity for human populations around the world. Support your conclusion with valid reasons or evidence.

[ 8 ]
[Maximum number: 7]

Figure 4(a): Changes in Arctic sea ice in a typical year.

Figure 4(a)

Figure 4(a)

Figure 4(b): Arctic sea ice extent.

Figure 4(b): Arctic sea ice extent.

org/arcticseaicenews/charctic-interactive-sea-ice-graph/. Accessed November 18, 2015.]

Figure 4(c): Arctic sea ice extent 1979-2012.

Figure 4(c): Arctic sea ice extent 1979-2012.

(a)
(i)

Identify one factor that may be causing long-term changes in sea ice cover.

[ 1 ]
(ii)

Describe the trend seen in the sea ice cover data in Figure 4(b).

[ 2 ]
(b)

Figure 5: The various countries that surround the Arctic Ocean have made claims to the ownership of the mineral resources that may lie beneath it, and which may become more accessible as the area covered by sea ice is reduced.

Figure 5

Figure 5

[ 4 ]
0