Plans are being discussed to restore a much larger area of the marshes by using a greater amount of water from the Tigris and Euphrates rivers.
With reference to all of the data in the resource booklet, evaluate the plan to re-flood the marshes completely.
The Iraq/Iran marshlands once covered about 15000 km^2.
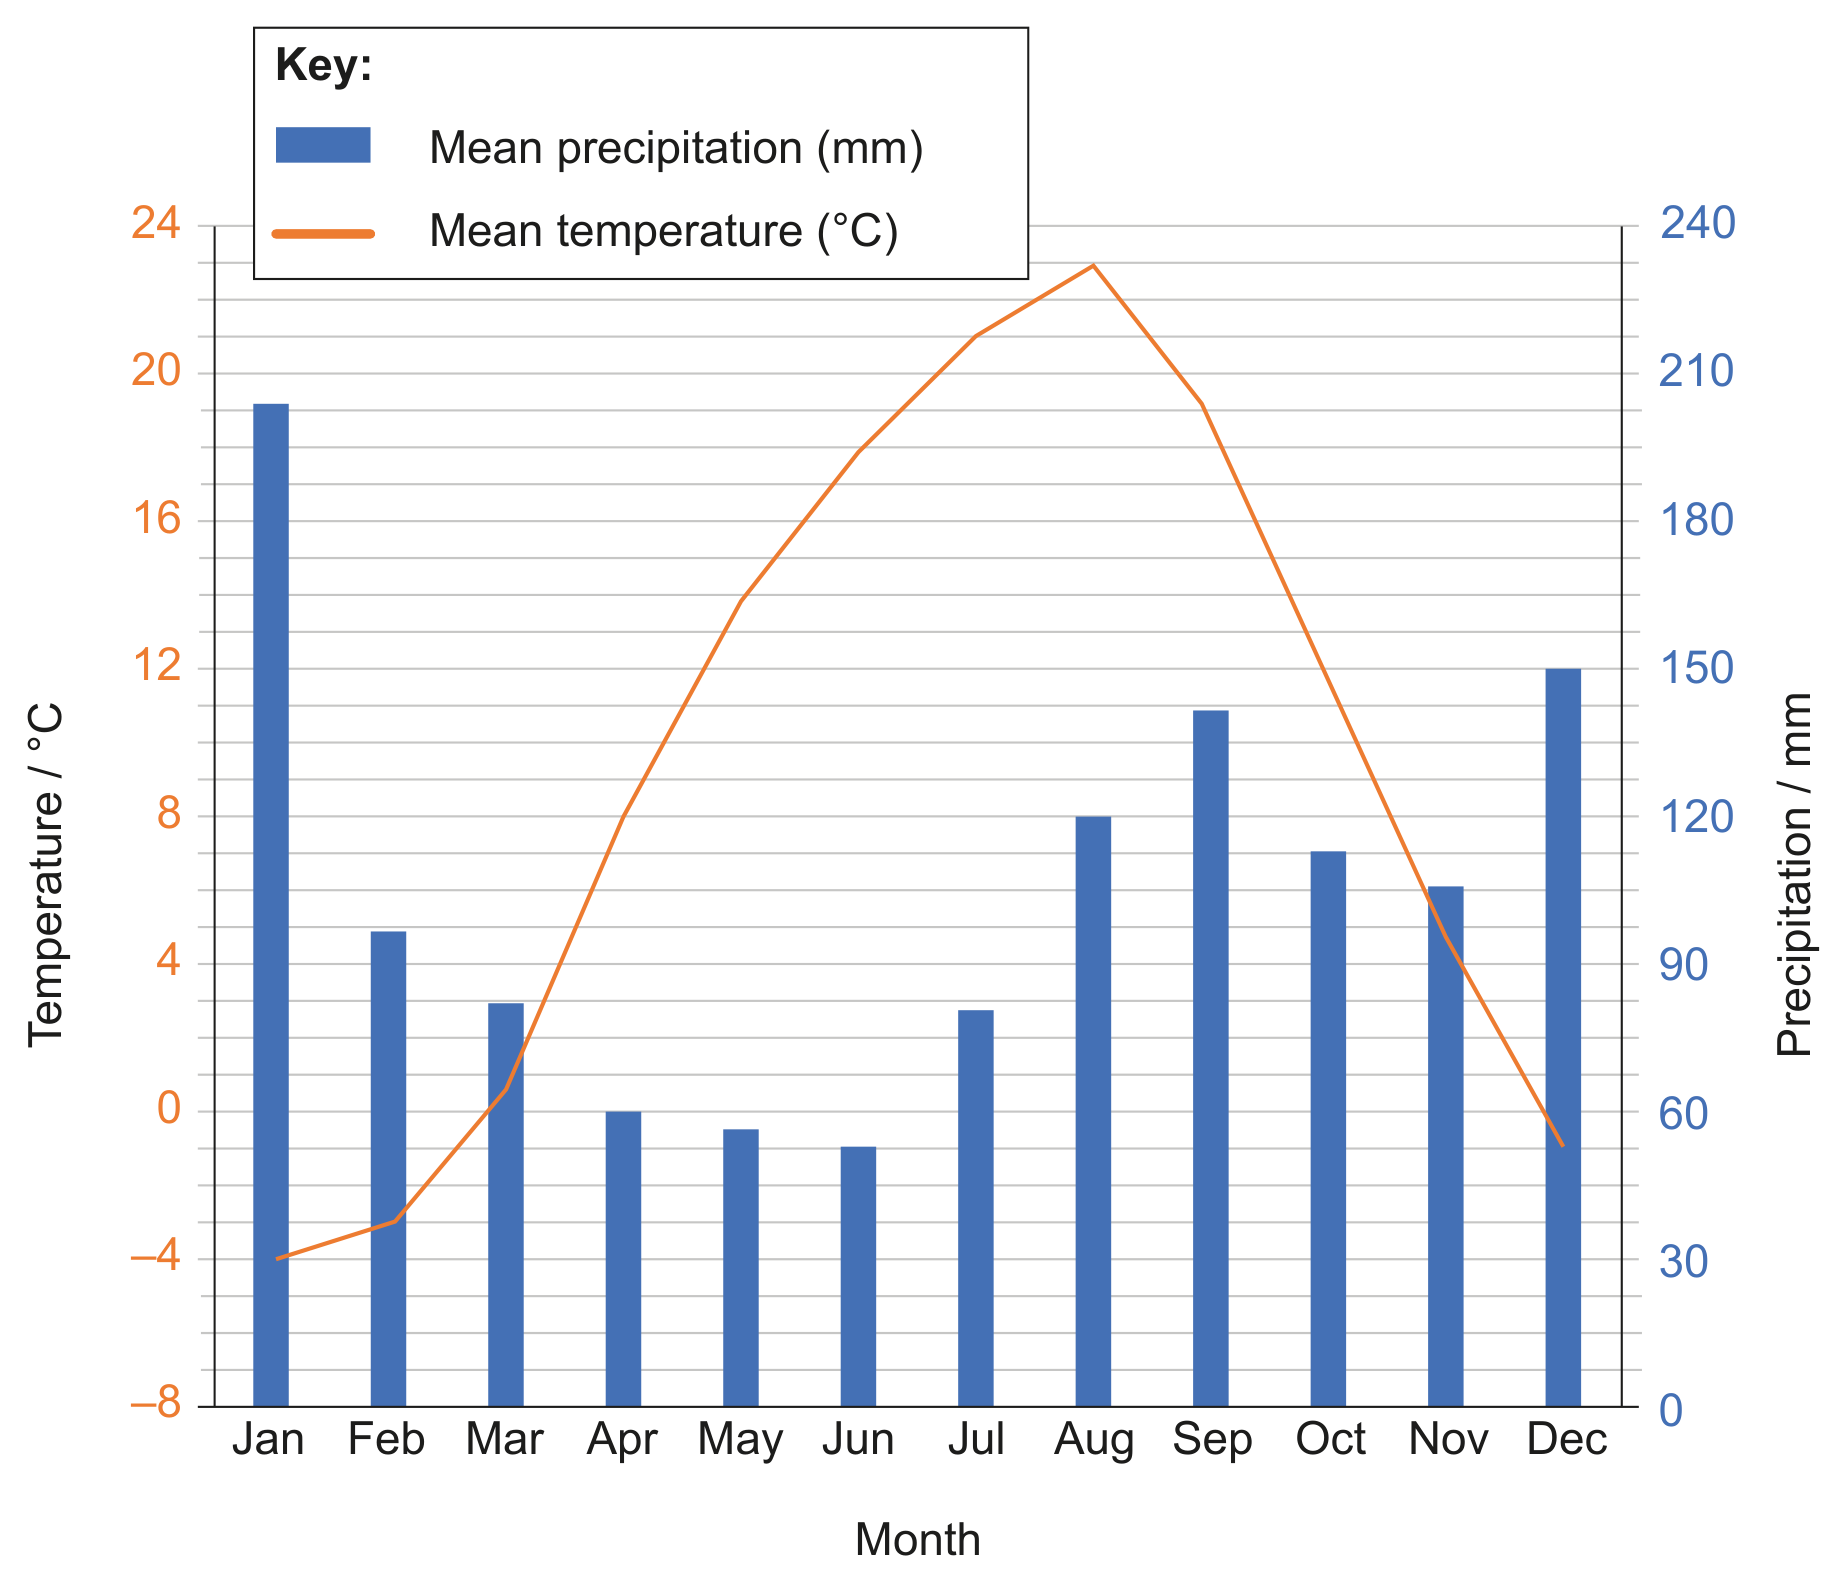
The marshes receive only about 100 mm of rainfall each year while more than 2500 mm evaporates, leaving salty water.
Spring snowmelt formerly flowed down from Iran and Turkey, bringing sediment and washing away salty water.
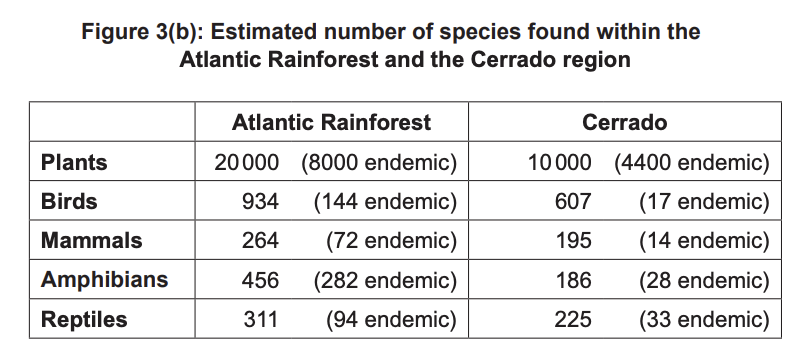
The wetlands developed many endemic species and filtered pollutants; local food systems used fishing and water buffalo, and reeds were used for construction.
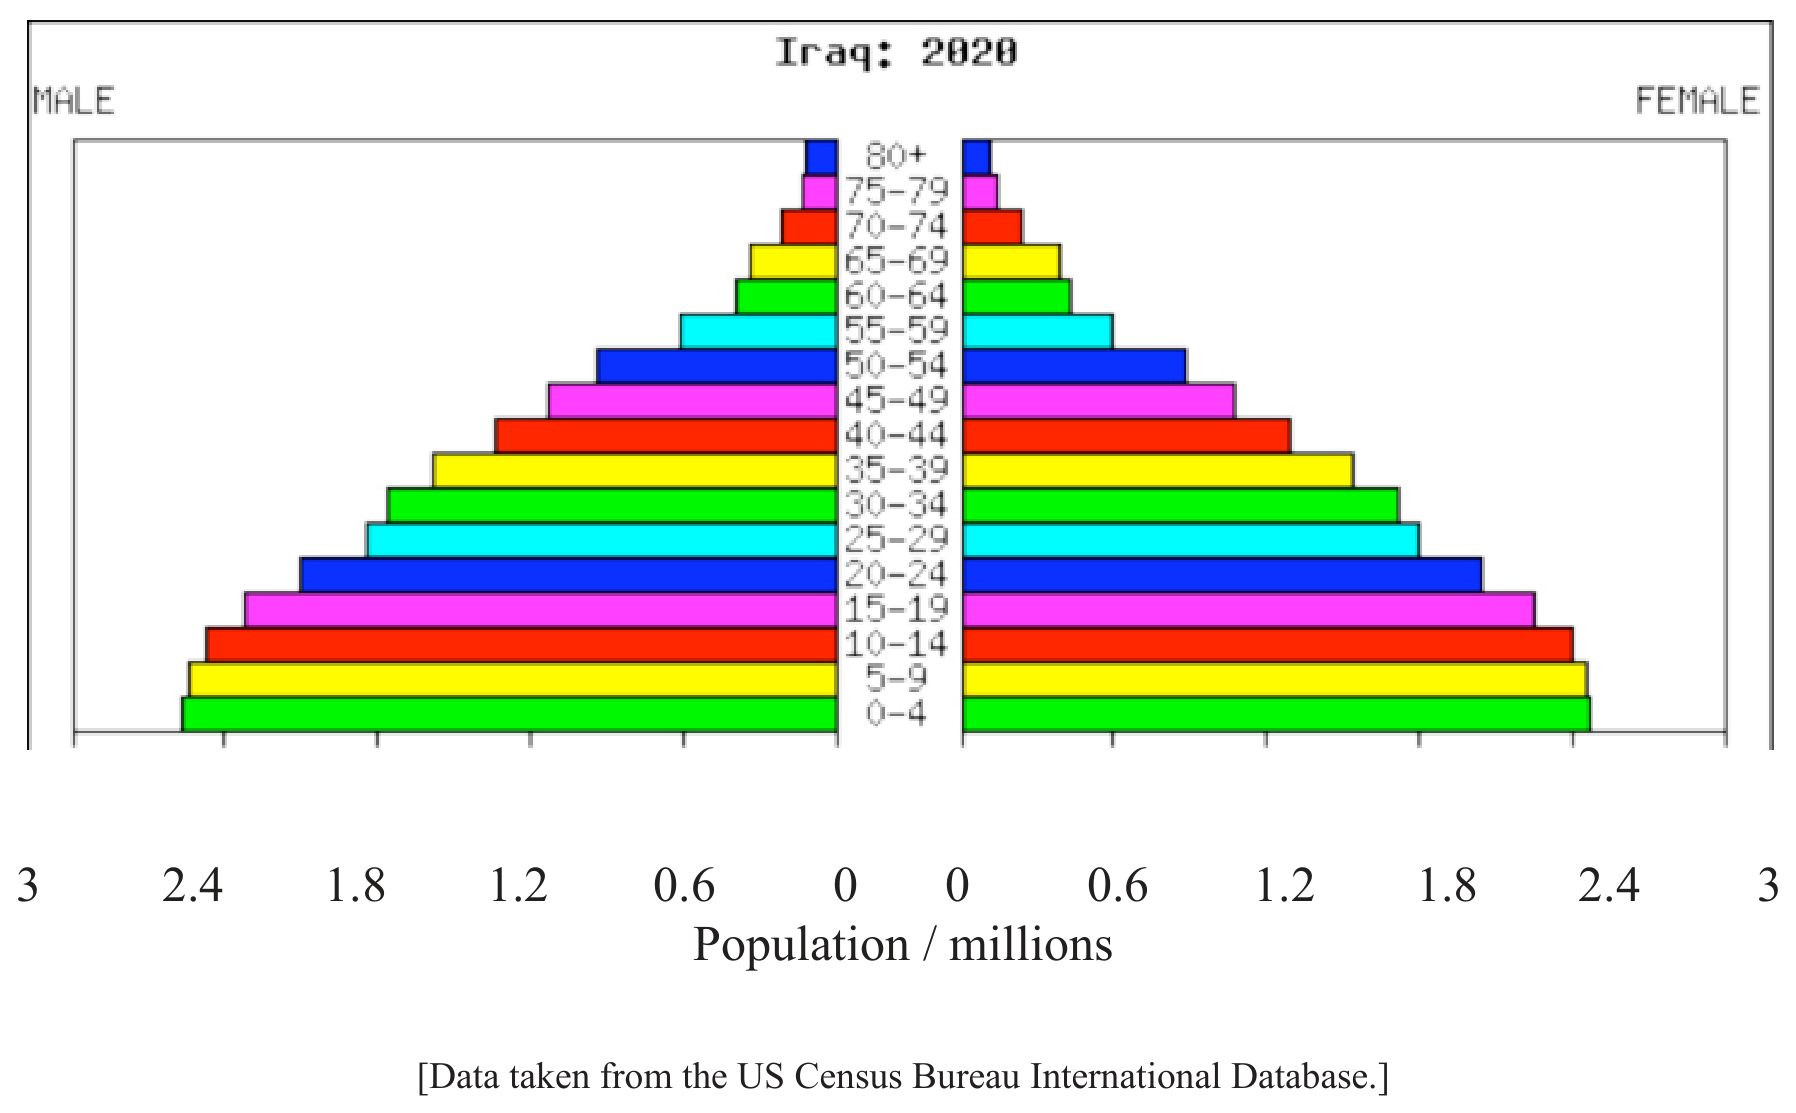
Figure 5: 2009 age/sex pyramid for Iraq
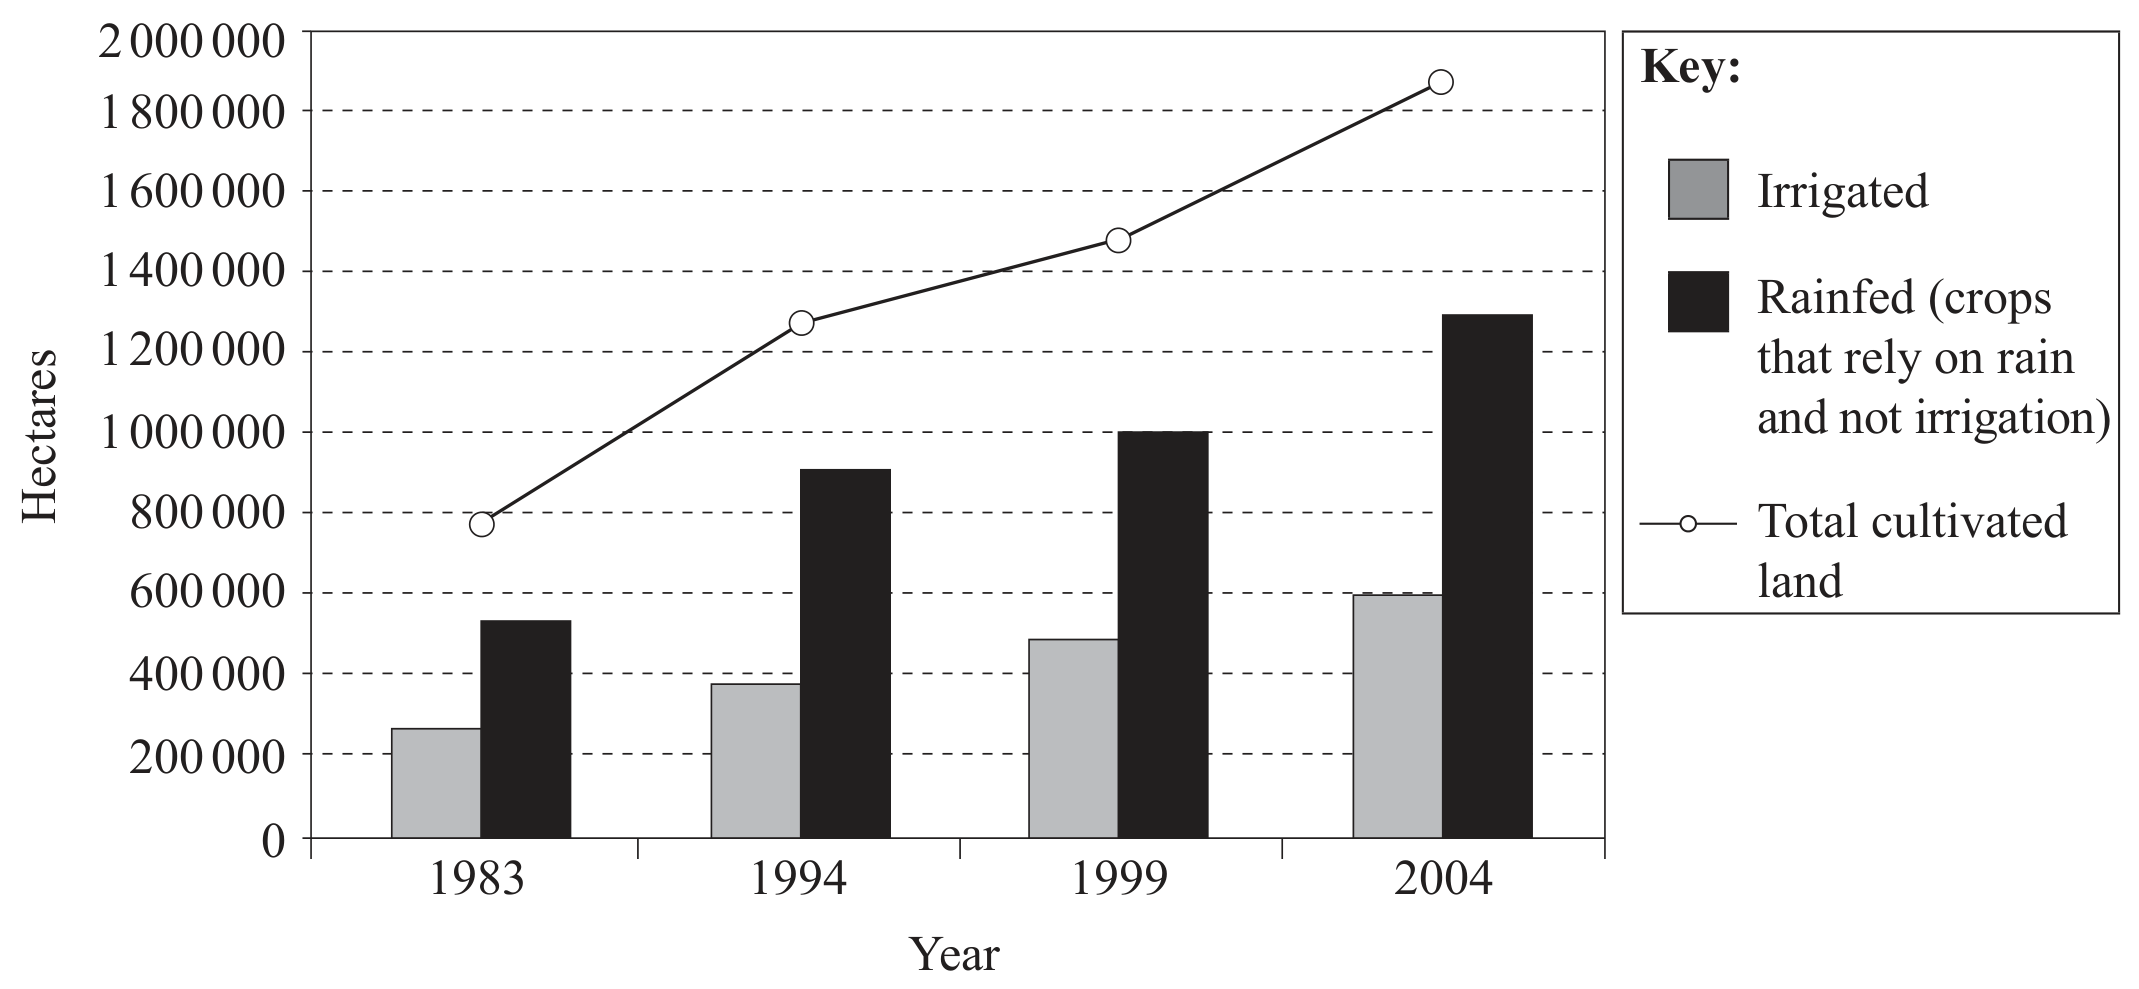
Figure 6: Irrigated, rainfed and total cultivated land in Iraq
From the early 1950s, dams across the Euphrates and Tigris reduced water flow to the marshes.
After the 1991 Gulf War the marshes were drained by diverting water away, causing wetland desertification and displacement of indigenous people.
By 2002, marshlands had diminished to 760 km^2.
In 2003 floodgates were opened and embankments broken; partial re-flooding occurred but not to historic levels.
High salt concentrations have prevented ecosystem restoration in some areas.
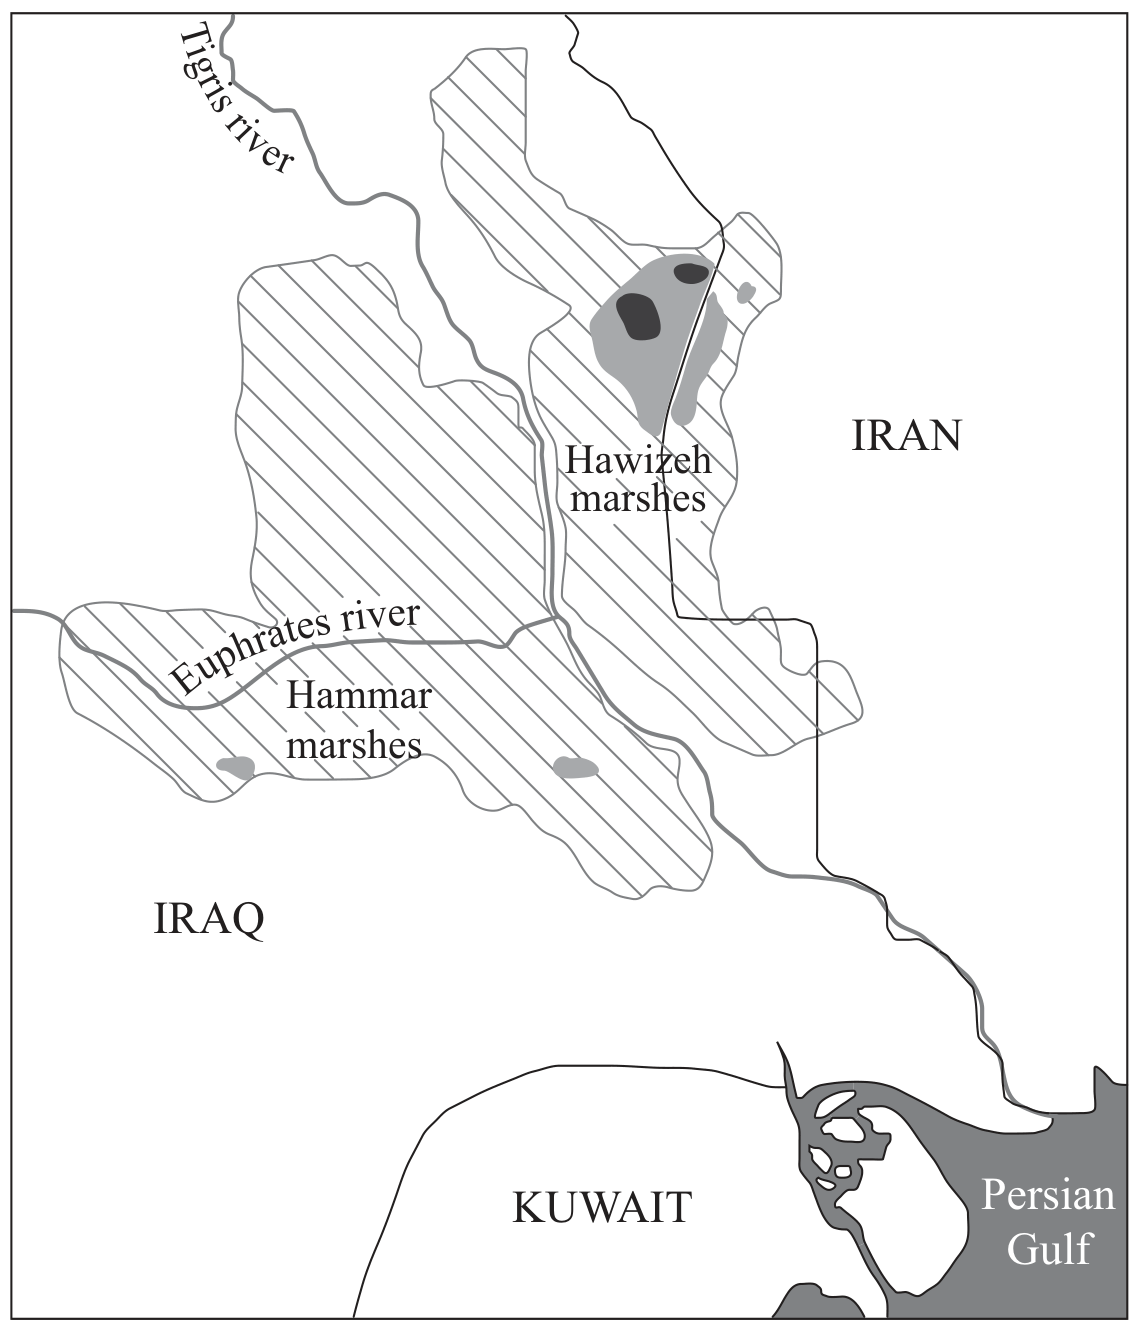
Figure 8: Reduction in marsh area between 1973 and 2000
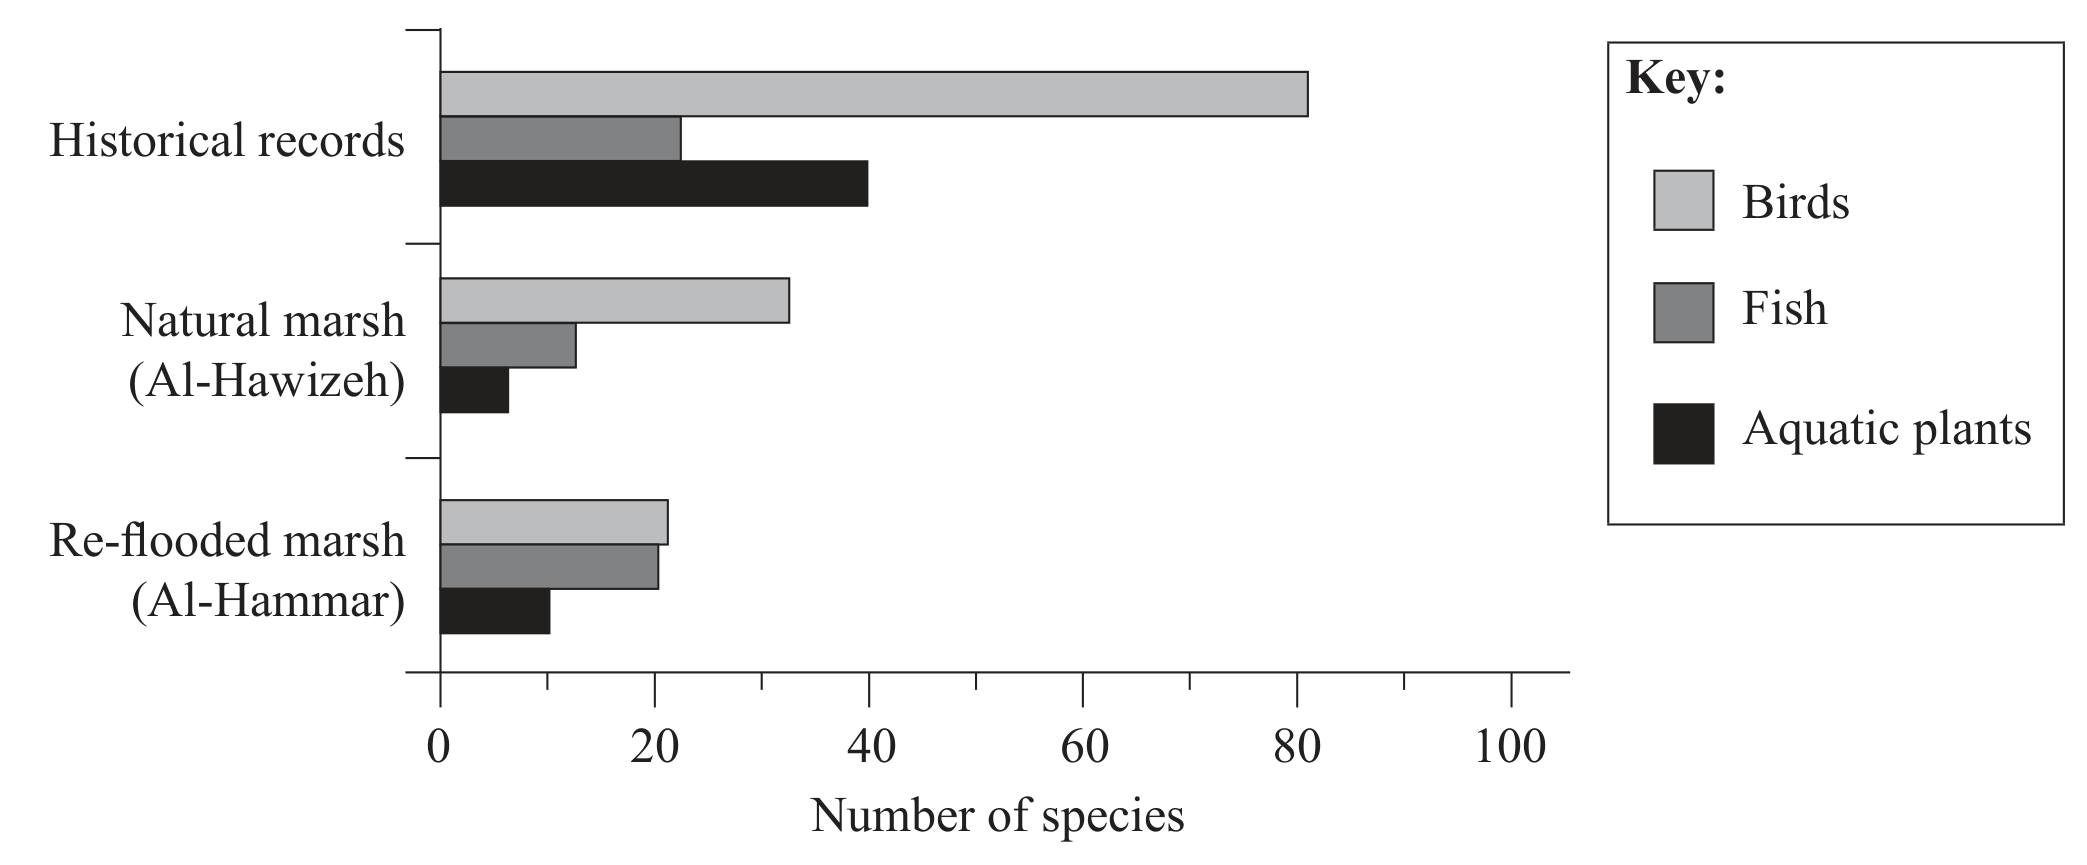
Figure 9: Species numbers in natural and re-flooded marshes
| Component | Natural marsh (Al-Hawizeh) | Re-flooded marsh (Al-Hammar) | Re-flooded marsh (Al-Sanaf) |
|---|---|---|---|
| Salinity / ppt | 0.87 | 0.96 | 17.49 |
| pH | 7.64 | 7.95 | 9.40 |
| Total nitrogen / ug L^{-1} | 464 | 1652 | 2050 |
Figure 10: Water quality of natural and re-flooded marshes
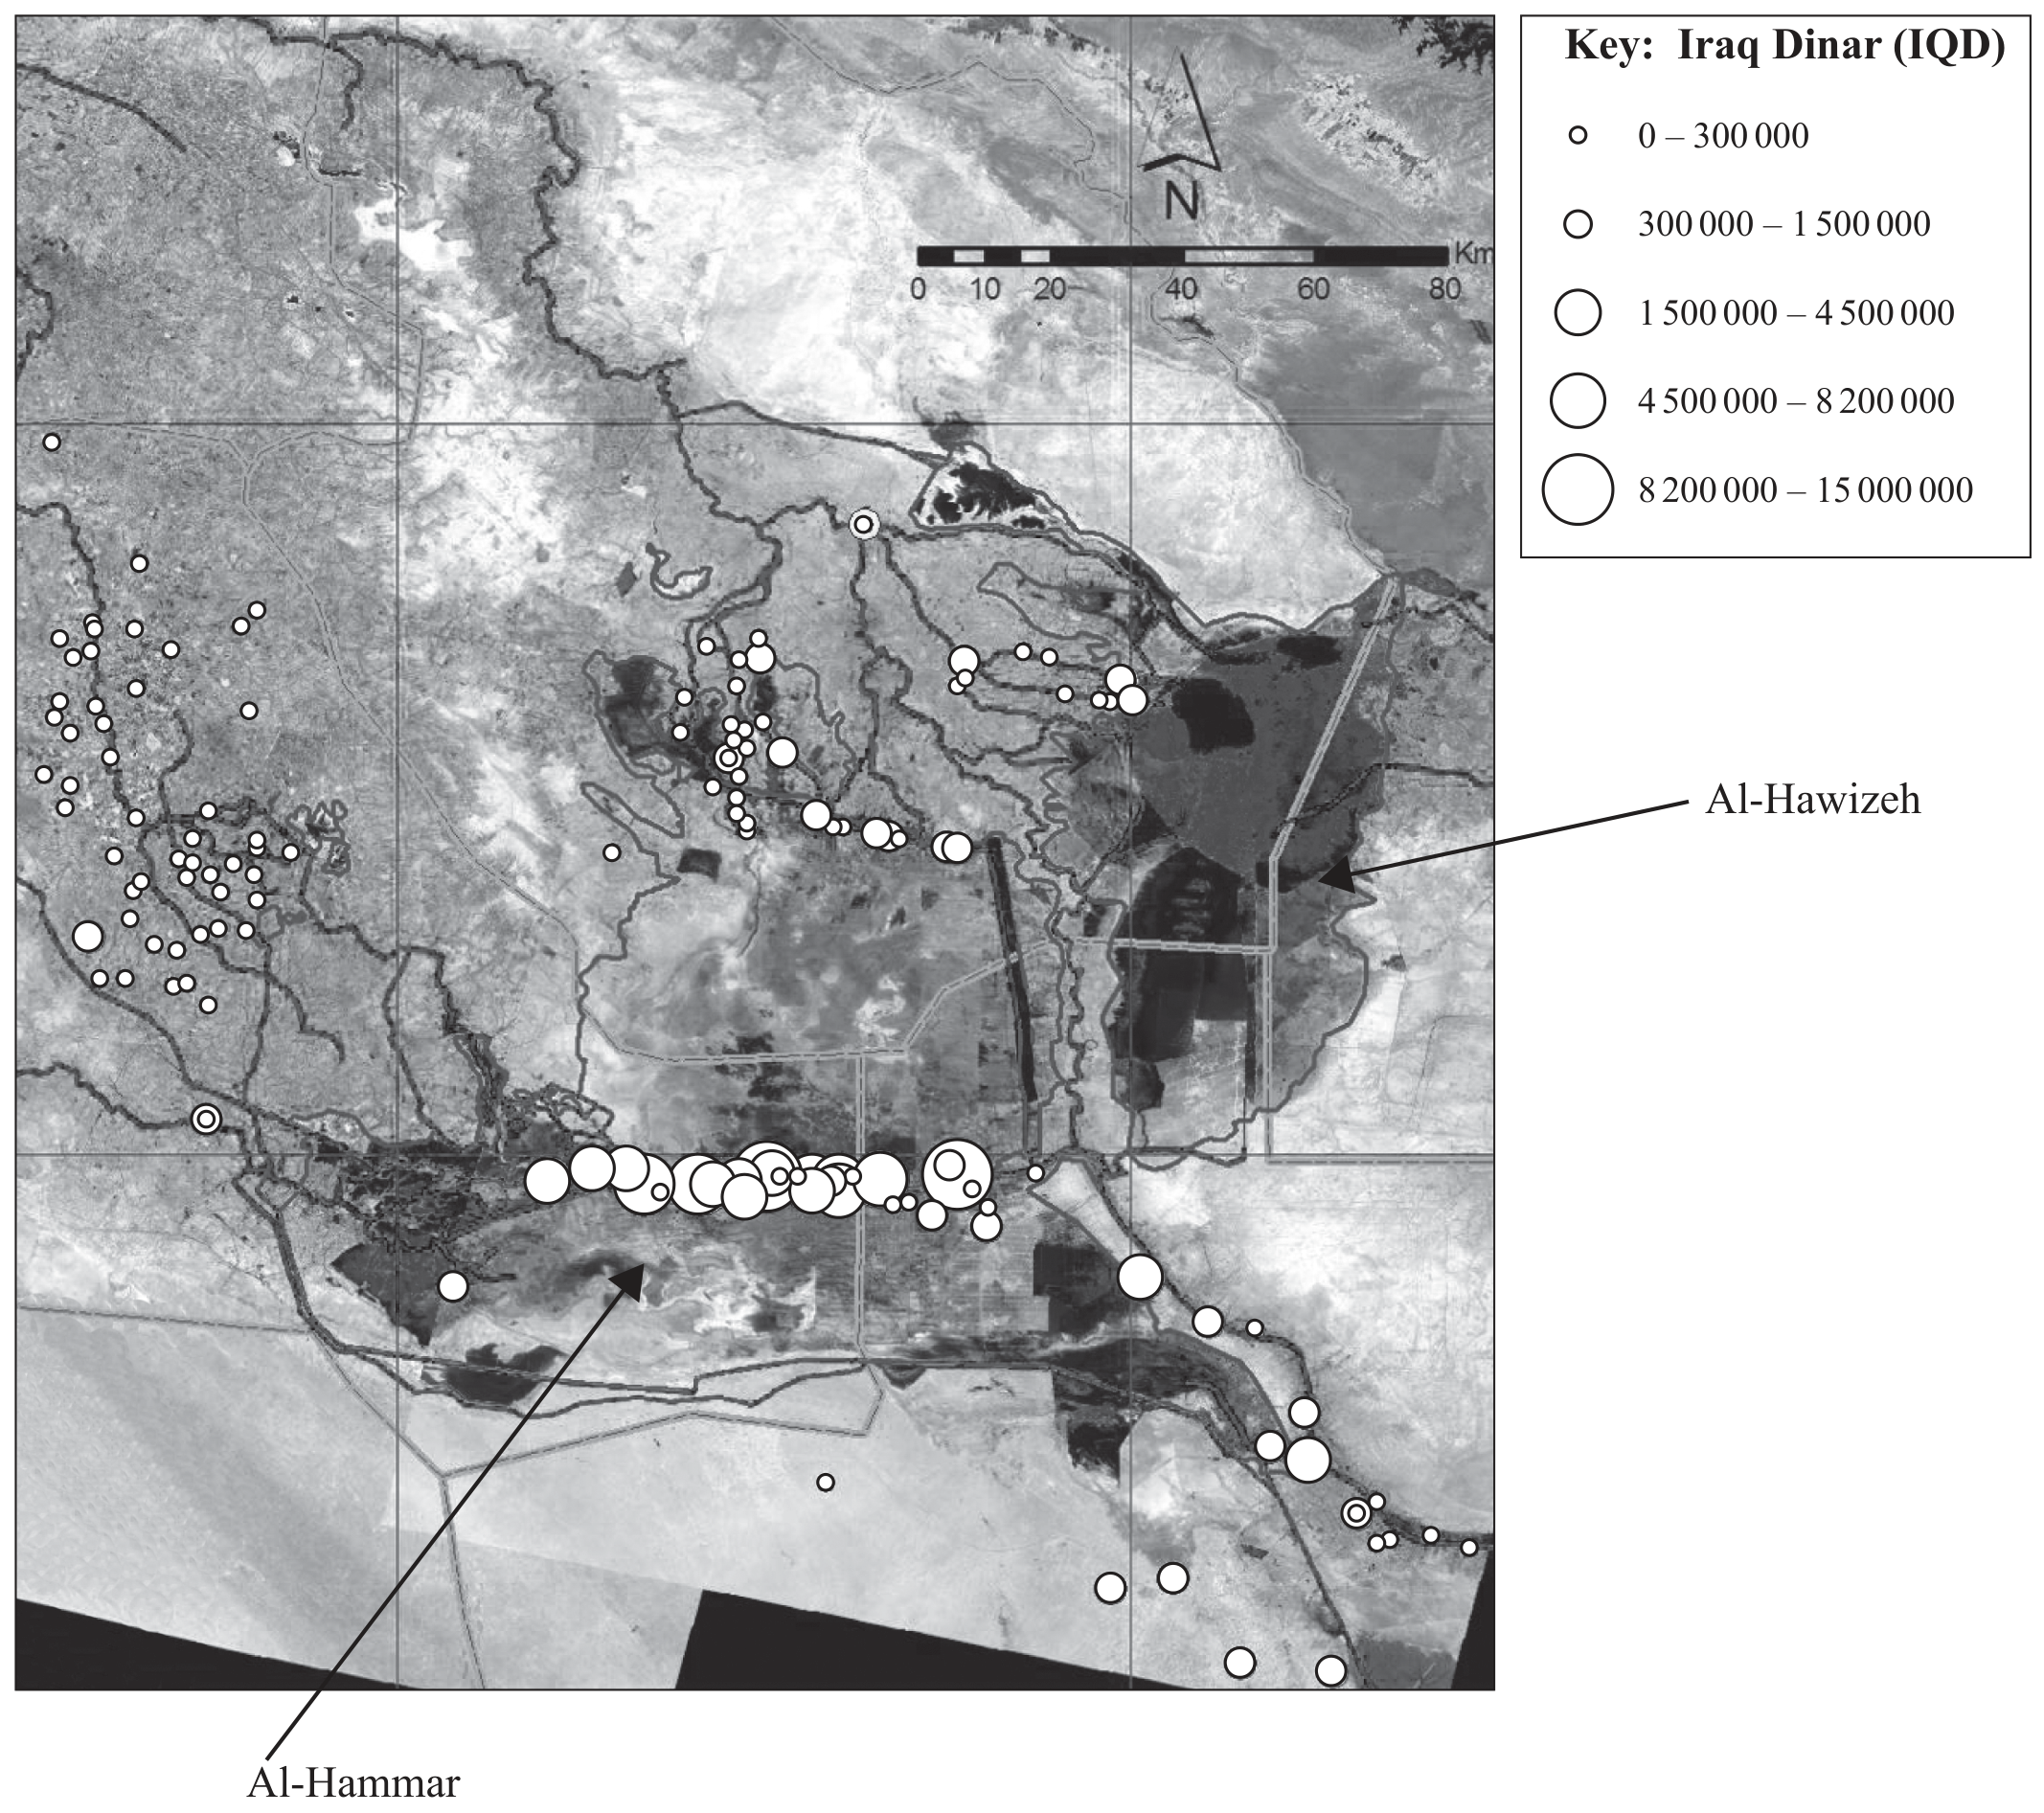
Figure 12(a)/(b): Valuing ecosystems and willingness to pay to restore marshes