[Maximum number: 4]
Figure 1 shows the process of carbon capture and storage (CCS) that can be used to manage climate change. Carbon dioxide ( ) is pumped into three different underground locations, where it is stored.
Flow 1 pumps into an underground saline reservoir.
Flow 2 pumps into an oil reservoir; replaces oil; oil is produced.
Flow 3 pumps into a coal seam; replaces methane ; methane is produced.
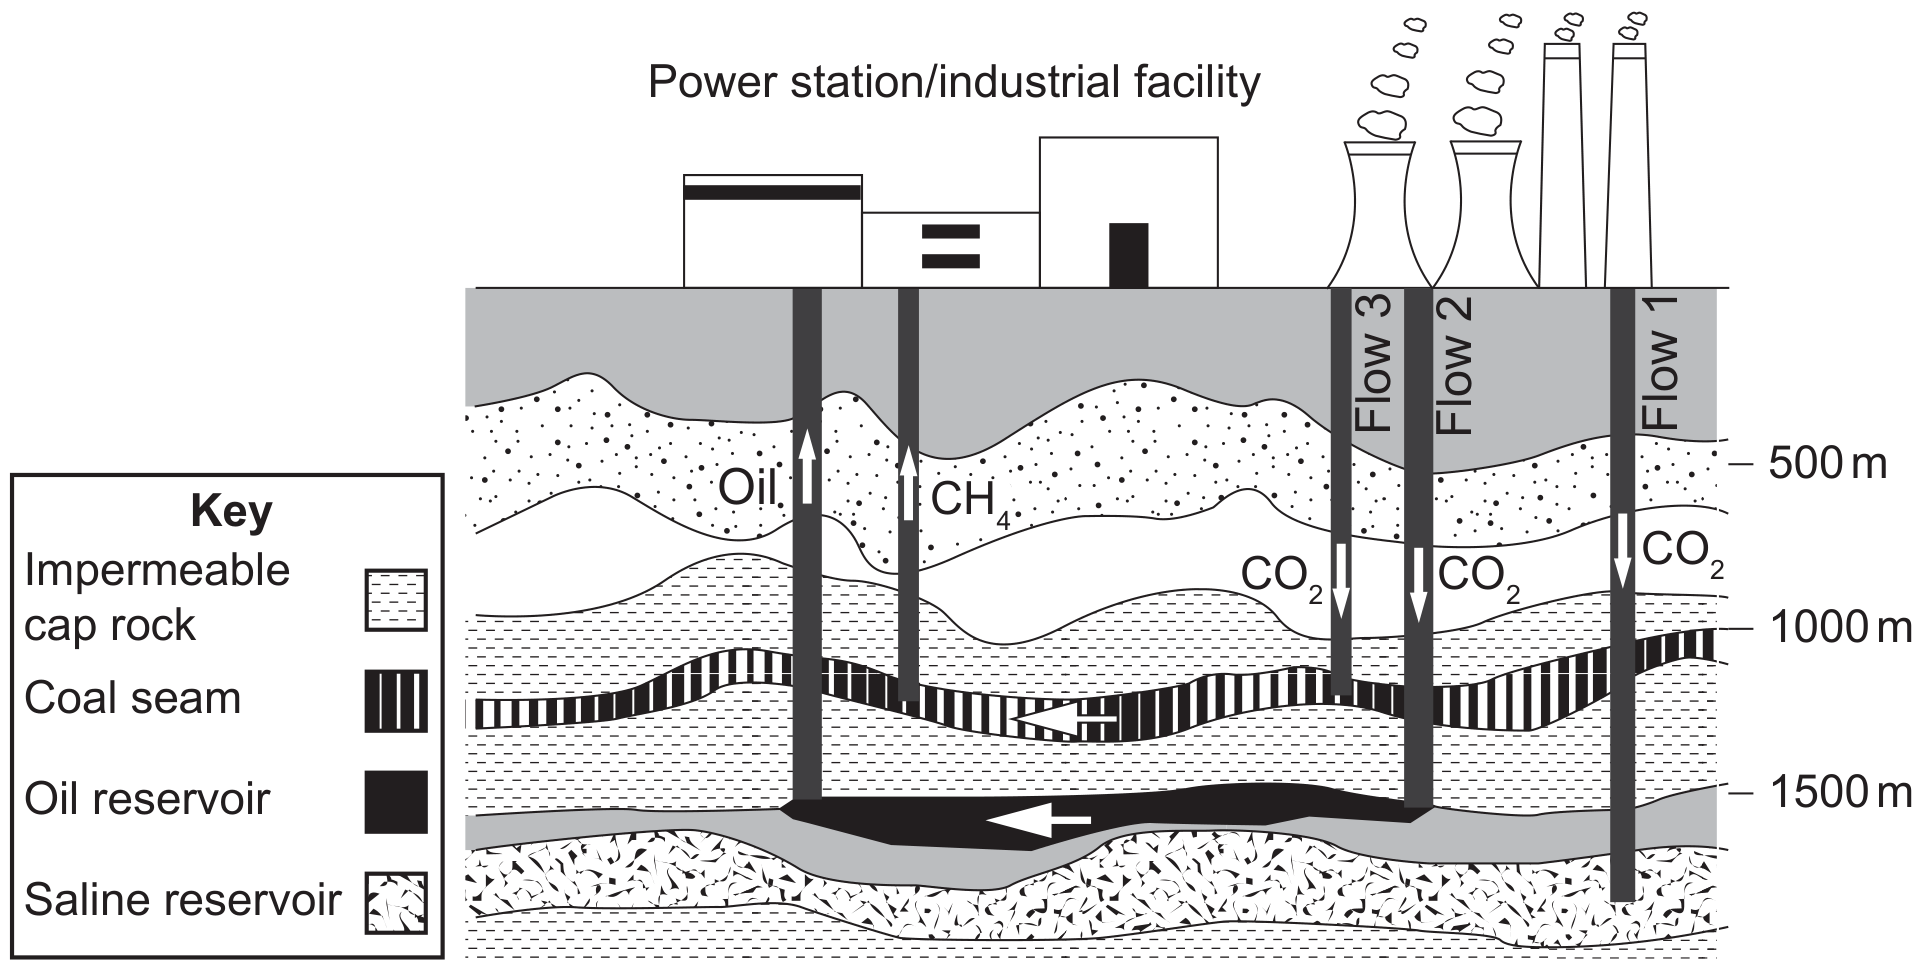
Figure 1: Carbon capture and storage flow chart
(a)
Outline how the mitigation strategy shown in Figure 1 is different to an adaptation strategy for managing climate change.
[ 2 ]
(b)
Identify two mitigation strategies to manage climate change, other than carbon capture and storage.
[ 2 ]