EduNinja
(a)
(i)

State one type of solid domestic waste management strategy.

[ 1 ]
(ii)

Outline one advantage and one disadvantage of the strategy named in 1(a)(i).

Advantage:

Disadvantage:

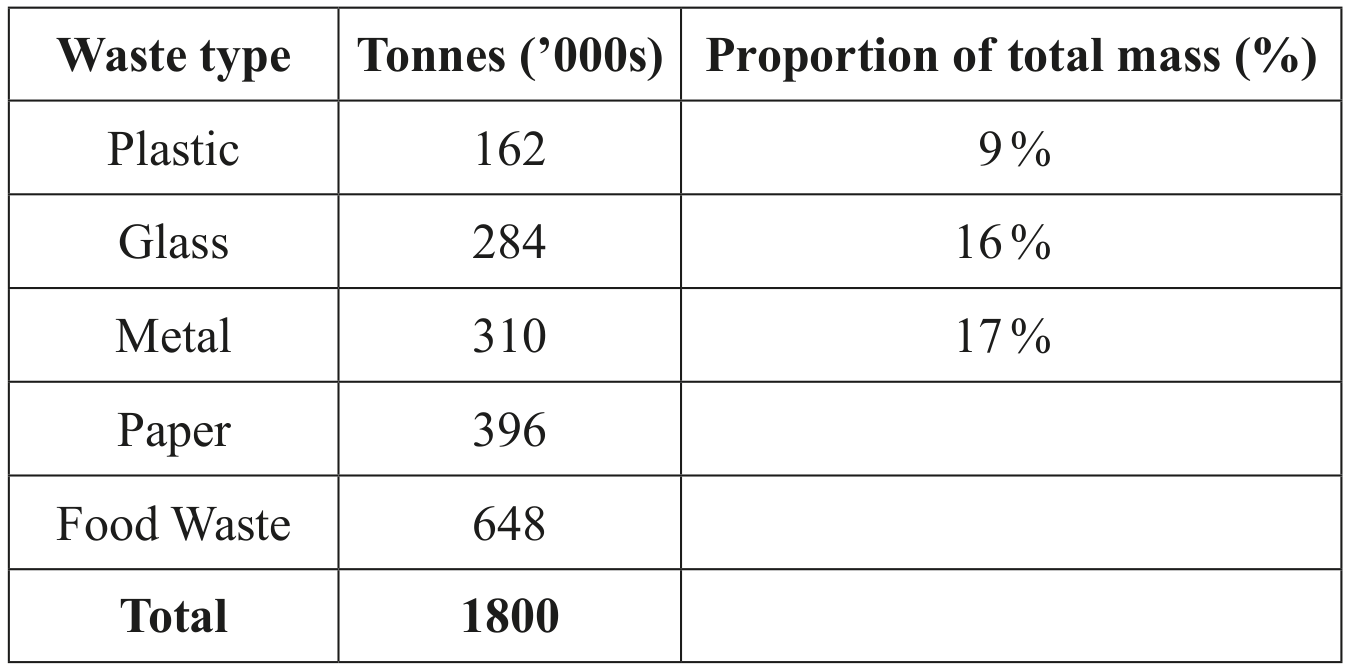
The table shows solid domestic waste data for the state of Victoria, Australia in 2006-2007.

Table
[ 2 ]
(b)
(i)

From the data, calculate the proportion of paper and of food waste as a percentage of the total.

Enter these two values in the table above.

[ 1 ]
(ii)

Complete the following bar chart by using the data calculated in (b)(i). Label the chart correctly.
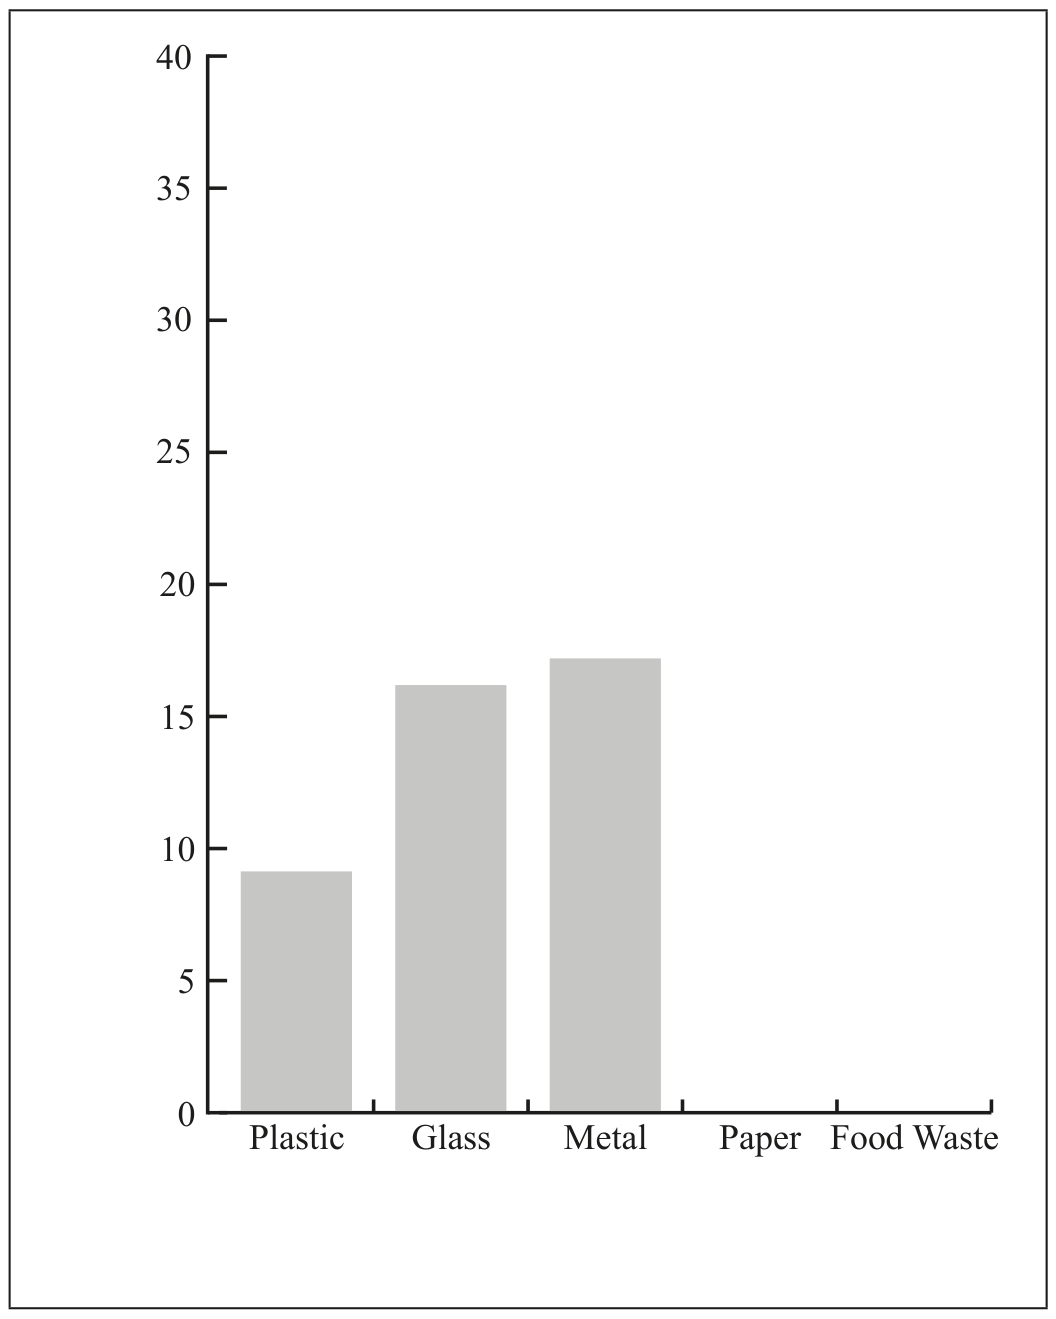
Question image
[ 2 ]
[Maximum number: 7]
Figure 1: Management of solid domestic waste in England, 2001-2018

Figure 1: Management of solid domestic waste in England, 2001-2018

(a)

With reference to Figure 1, identify the recycling rate in England in 2018.

[ 1 ]
(b)

Outline one reason for the shape of the recycling rate curve from 2013 to 2018.

[ 1 ]
(c)

Estimate the reduction in solid domestic waste (in million tonnes) going to landfill from 2001 to 2018.

[ 1 ]
(d)

Describe three reasons why the proportion of solid domestic waste being recycled/ composted and incinerated has changed.

[ 3 ]
(e)

Outline one reason why there has been an overall change in recorded total solid domestic waste between 2001 and 2018.

[ 1 ]
[Maximum number: 7]
Figure 2: Methods of domestic waste disposal for selected countries

Figure 2: Methods of domestic waste disposal for selected countries

(a)

With reference to Figure 2, state the country that has the highest level of recycling/composting.

[ 1 ]
(b)

Outline two possible reasons for greater use of landfills in the United States compared with the European countries shown in Figure 2.

[ 2 ]
(c)

Outline two strategies for reducing the environmental impact of landfill sites.

[ 2 ]
(d)

Identify two problems associated with one of the waste disposal choices of Germany.

[ 2 ]
[Maximum number: 3]

Figure 2 below shows a table of demographic data for four countries around the world.

Figure 2

Figure 2

(a)

Suggest how recycling can reduce the ecological footprint of a school.

[ 3 ]
[Maximum number: 4]
Figure 3: Examples of entanglement of marine species

Figure 3: Examples of entanglement of marine species

Figure 4: Sea turtle species and their status from the IUCN Red List

Figure 4: Sea turtle species and their status from the IUCN Red List

(a)

Discuss how solid domestic waste disposal options could be used to reduce the threats to marine organisms.

[ 4 ]
(a)
Figure 10(a): Recycling rates in London and England, 2000-2015

Figure 10(a): Recycling rates in London and England, 2000-2015

MaterialProportion recycled / \%
Plastic10
Paper57
Aluminium cans33
Steel cans45
Glass51

Figure 10(b): Proportions of material recycled in London, 2006

With reference to Figures 10(a) and 10(b), suggest one reason why London's recycling rates are lower than in the rest of England.

[ 1 ]
(b)
Figure 10(a): Recycling rates in London and England, 2000-2015

Figure 10(a): Recycling rates in London and England, 2000-2015

MaterialProportion recycled / \%
Plastic10
Paper57
Aluminium cans33
Steel cans45
Glass51

Figure 10(b): Proportions of material recycled in London, 2006

Resource booklet context: recycling in London
- London recycling rates are lower than England overall.
- Recycling can reduce landfill demand and resource extraction but depends on participation and infrastructure.

Evaluate the effectiveness of recycling as a waste management strategy for London.

[ 3 ]
[Maximum number: 8]

Figure 4: The figure shows changes in the amount of municipal waste recycled as a percentage of total generated waste in 32 European countries in 2001 and 2010.

Figure 4

Figure 4

-2001-2010
(a)
(i)

State the trend shown in the percentage of waste recycled between 2001 and 2010.

[ 1 ]
(ii)

Identify two countries that have not followed this general trend.

[ 1 ]
(iii)

Identify one reason why some countries may have not followed this trend.

[ 1 ]
(b)

Evaluate the use of incineration as an alternative to recycling for the management of solid waste.

[ 5 ]
(a)

Evaluate one possible pollution management strategy for solid domestic waste.

[ 8 ]
(a)

To what extent is the use of solid domestic waste (SDW) as an energy source beneficial to a society?

[ 9 ]
[Maximum number: 2]

Explain why Beijing may want to stop the use of landfill for the disposal of solid domestic waste.

In 2018, 9.29 million tonnes of household waste were collected; about 40% went to landfill and 46% to incineration.
Beijing is building incinerators aiming for no waste going to landfill by 2035; waste-to-energy incinerators generate electricity.
In 2020 regulations included compulsory sorting of household waste, ending free supermarket plastic bags, and reducing waste at source.

0