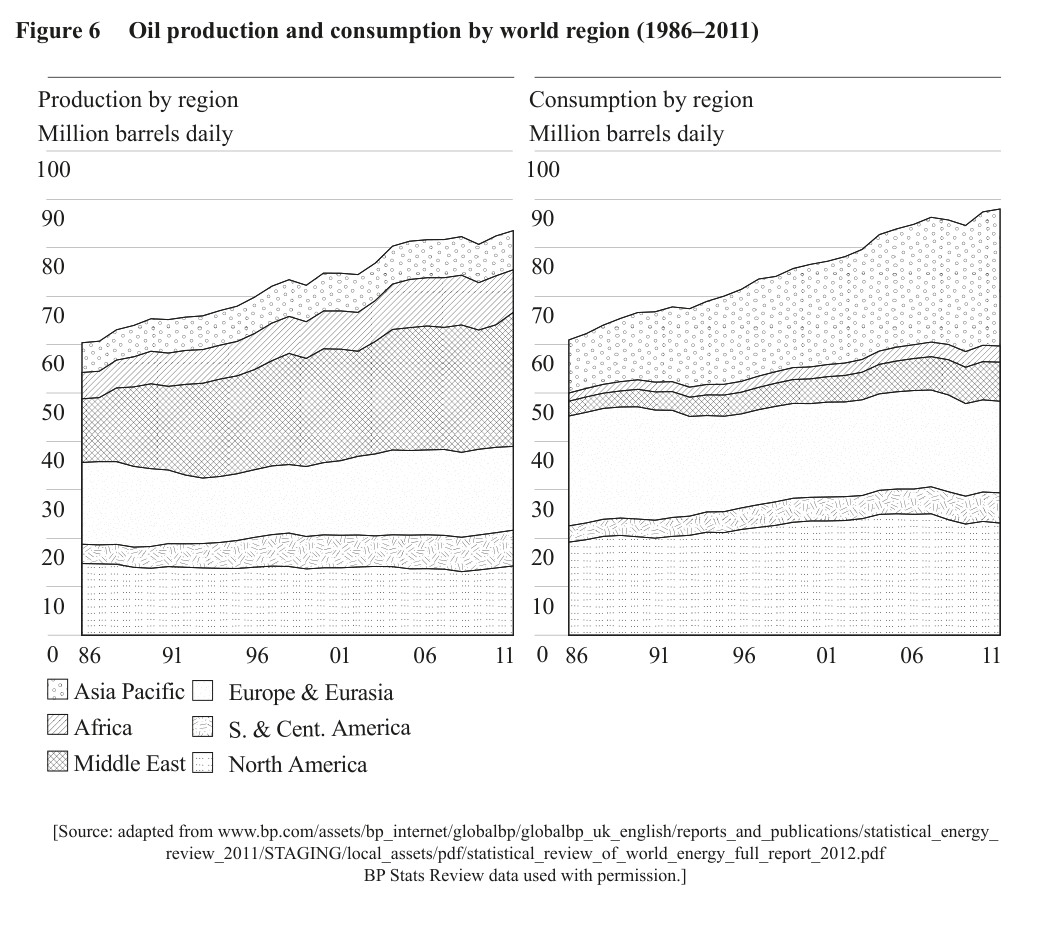
With reference to Figure 4 and Figure 6, state one example of a renewable form of natural capital and one example of a replenishable form of natural capital.
Renewable:
Replenishable:
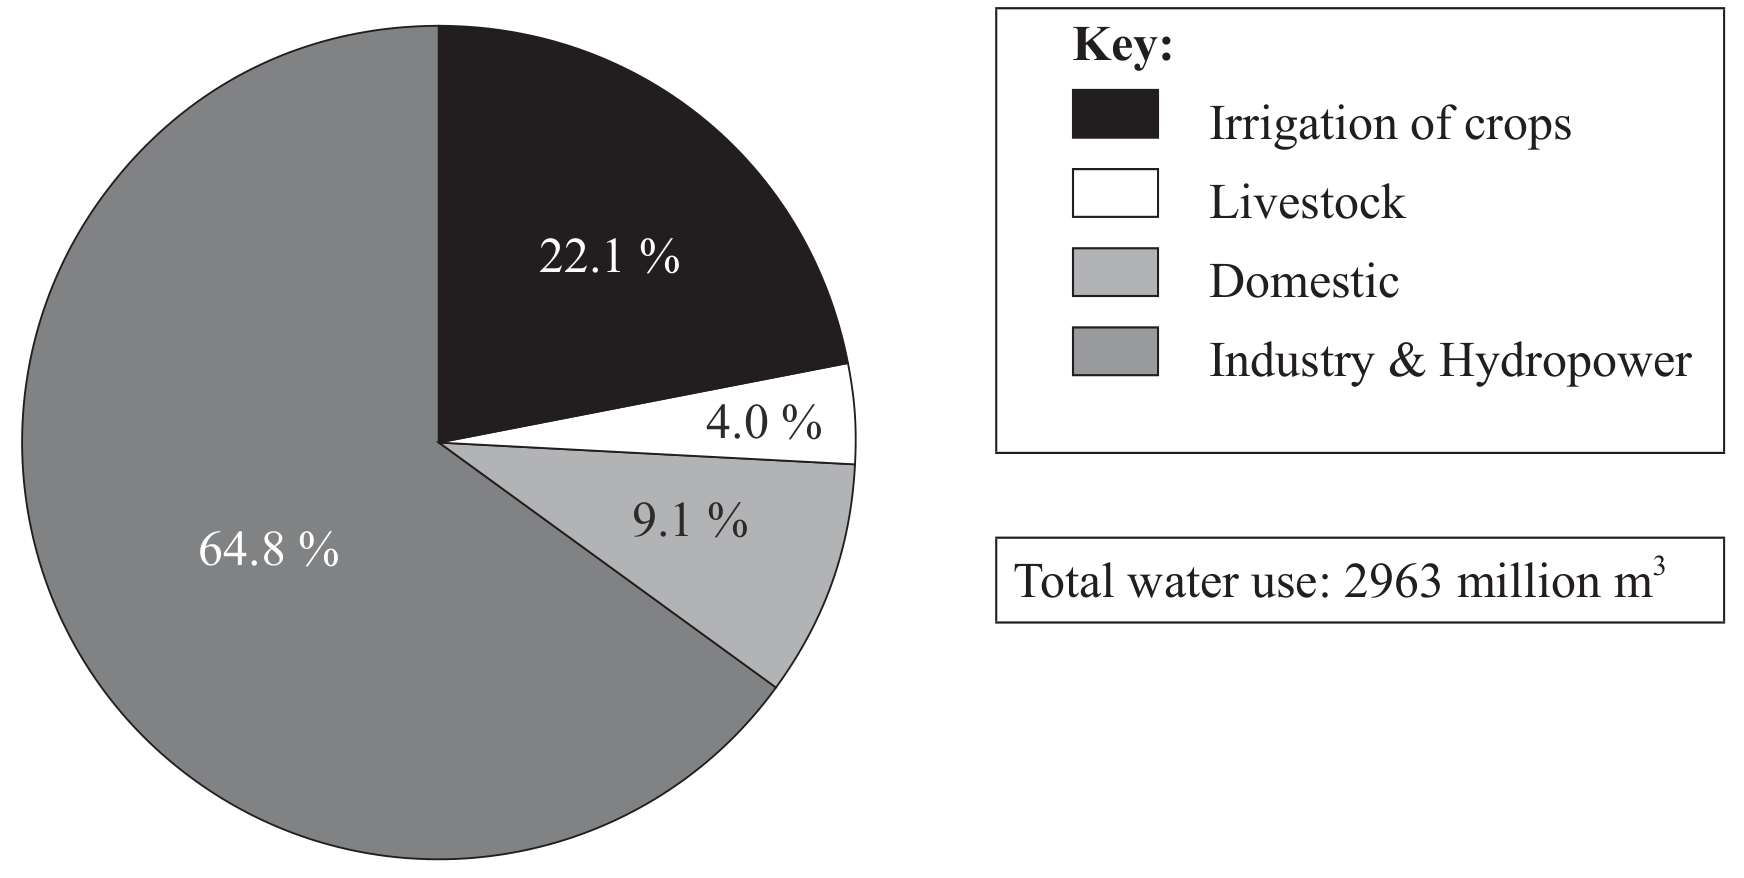
Figure 4: Water use in Moldova in 1992
Figure 4 shows Moldova water use in 1992: irrigation of crops is the largest use, followed by industry/hydropower, domestic use and livestock. The total water use shown is 596.5 million m^3.
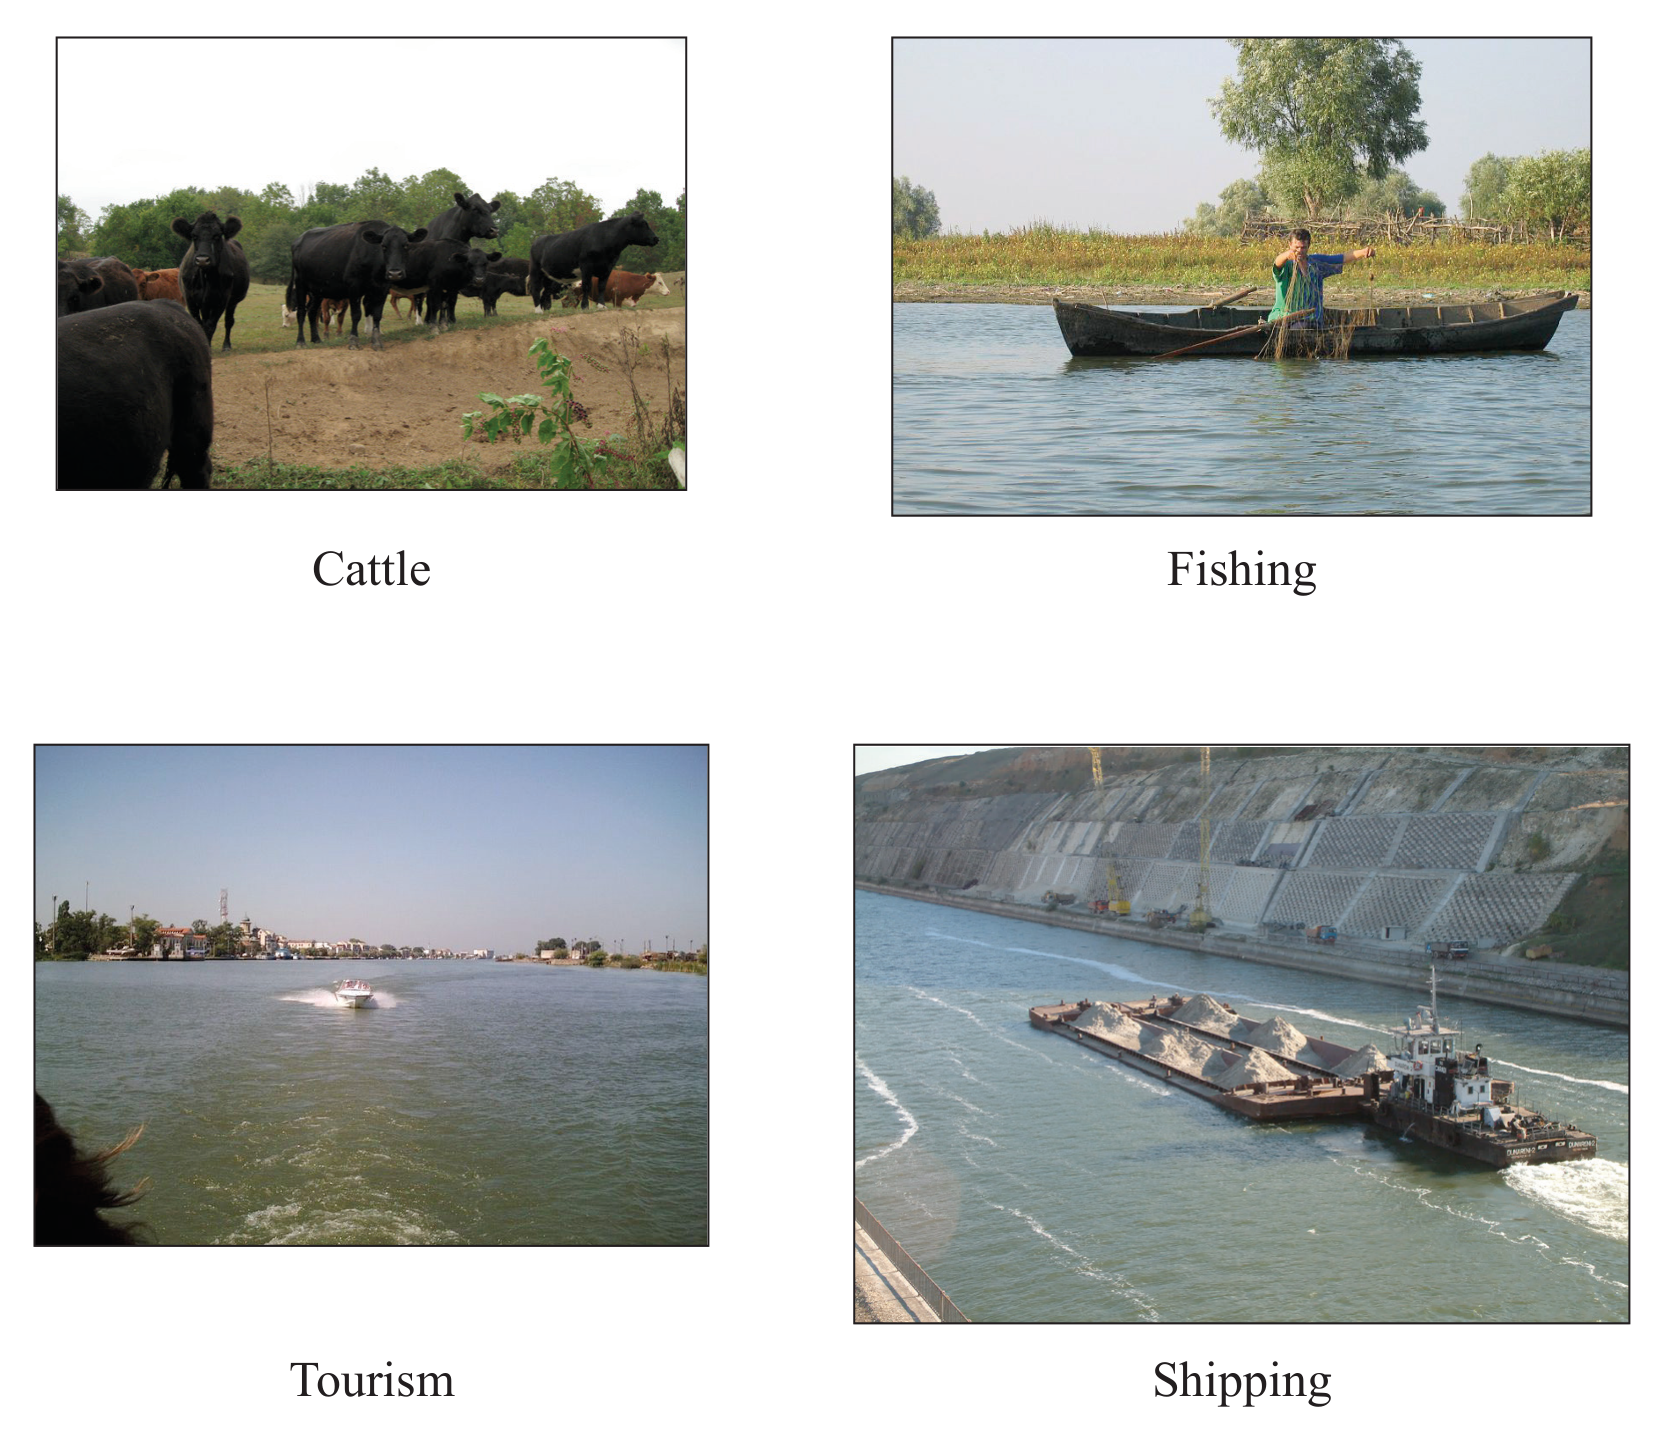
Figure 6: Natural income sources from the Danube River delta
Figure 6 shows natural income sources from the Danube River delta, including cattle, fishing, tourism and shipping. Renewable examples include fish/reeds/birds; replenishable examples include water extraction/domestic water use and hydropower.
With reference to all of the data, discuss the relationship between natural income and the sustainability of human activities in the Danube River delta.
The Danube River delta is where the Danube flows into the Black Sea and includes UNESCO Biosphere Reserves and a World Natural Heritage site.
A delta is formed by continuous deposition of sediment carried by the river; sediment adds height and helps it extend into the sea.
The delta is a wetland ecosystem rich in plants, birds and fish, including over 1000 plant species, 300 bird species and endangered sturgeon.
Moldova takes nearly 20% of its water supply requirements from a branch of the Danube.
Figure 4: Water use in Moldova in 1992
Figure 4 shows Moldova water use in 1992: irrigation of crops is the largest use, followed by industry/hydropower, domestic use and livestock. The total water use shown is 596.5 million m^3.
Figure 6: Natural income sources from the Danube River delta
Figure 6 shows natural income sources from the Danube River delta, including cattle, fishing, tourism and shipping. Renewable examples include fish/reeds/birds; replenishable examples include water extraction/domestic water use and hydropower.
| Years | Average sediment flow / tons yr^{-1} |
|---|---|
| 1921-1960 | 67.5 |
| 1971-1980 | 41.3 |
| 1981-1990 | 29.2 |
Figure 7: Changes to sediment flow into the delta
Figure 8: dredging is carried out so sediment carried by the river does not interfere with navigation.
Dredging involves scooping out sediment using heavy machinery and has also been used to straighten channels.