(a)
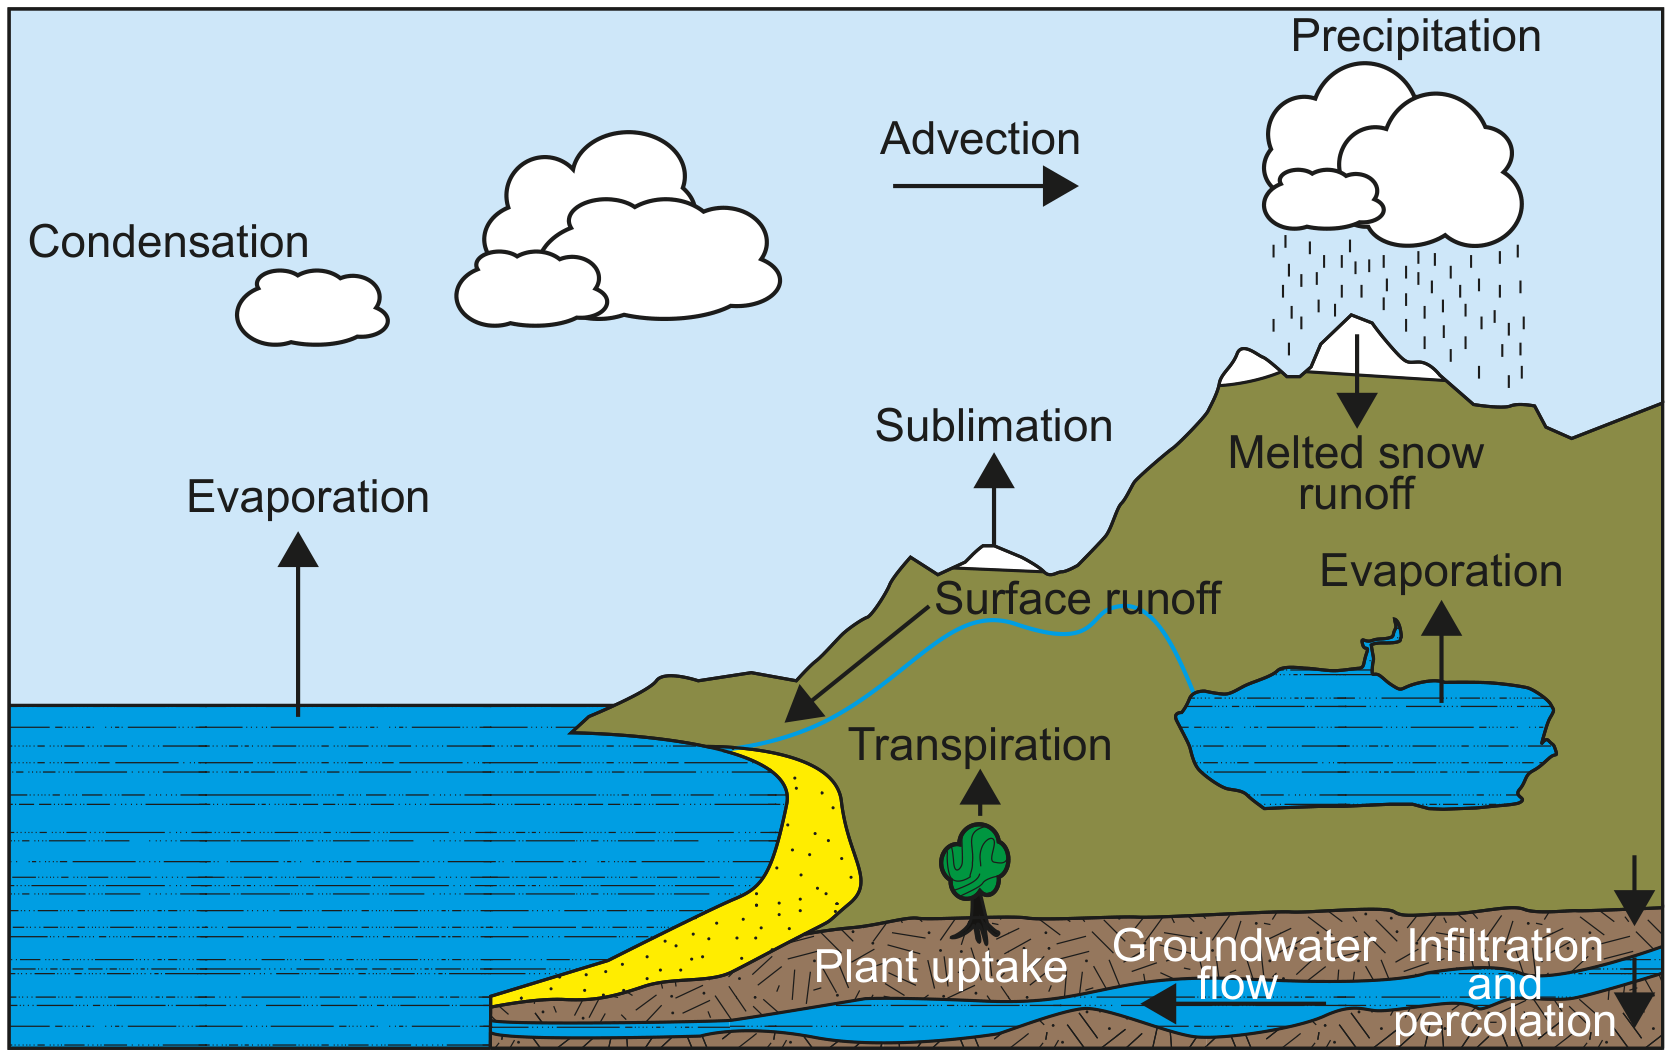
Annotate the systems diagram below with two inputs of water and two outputs of water in the marshland ecosystem.
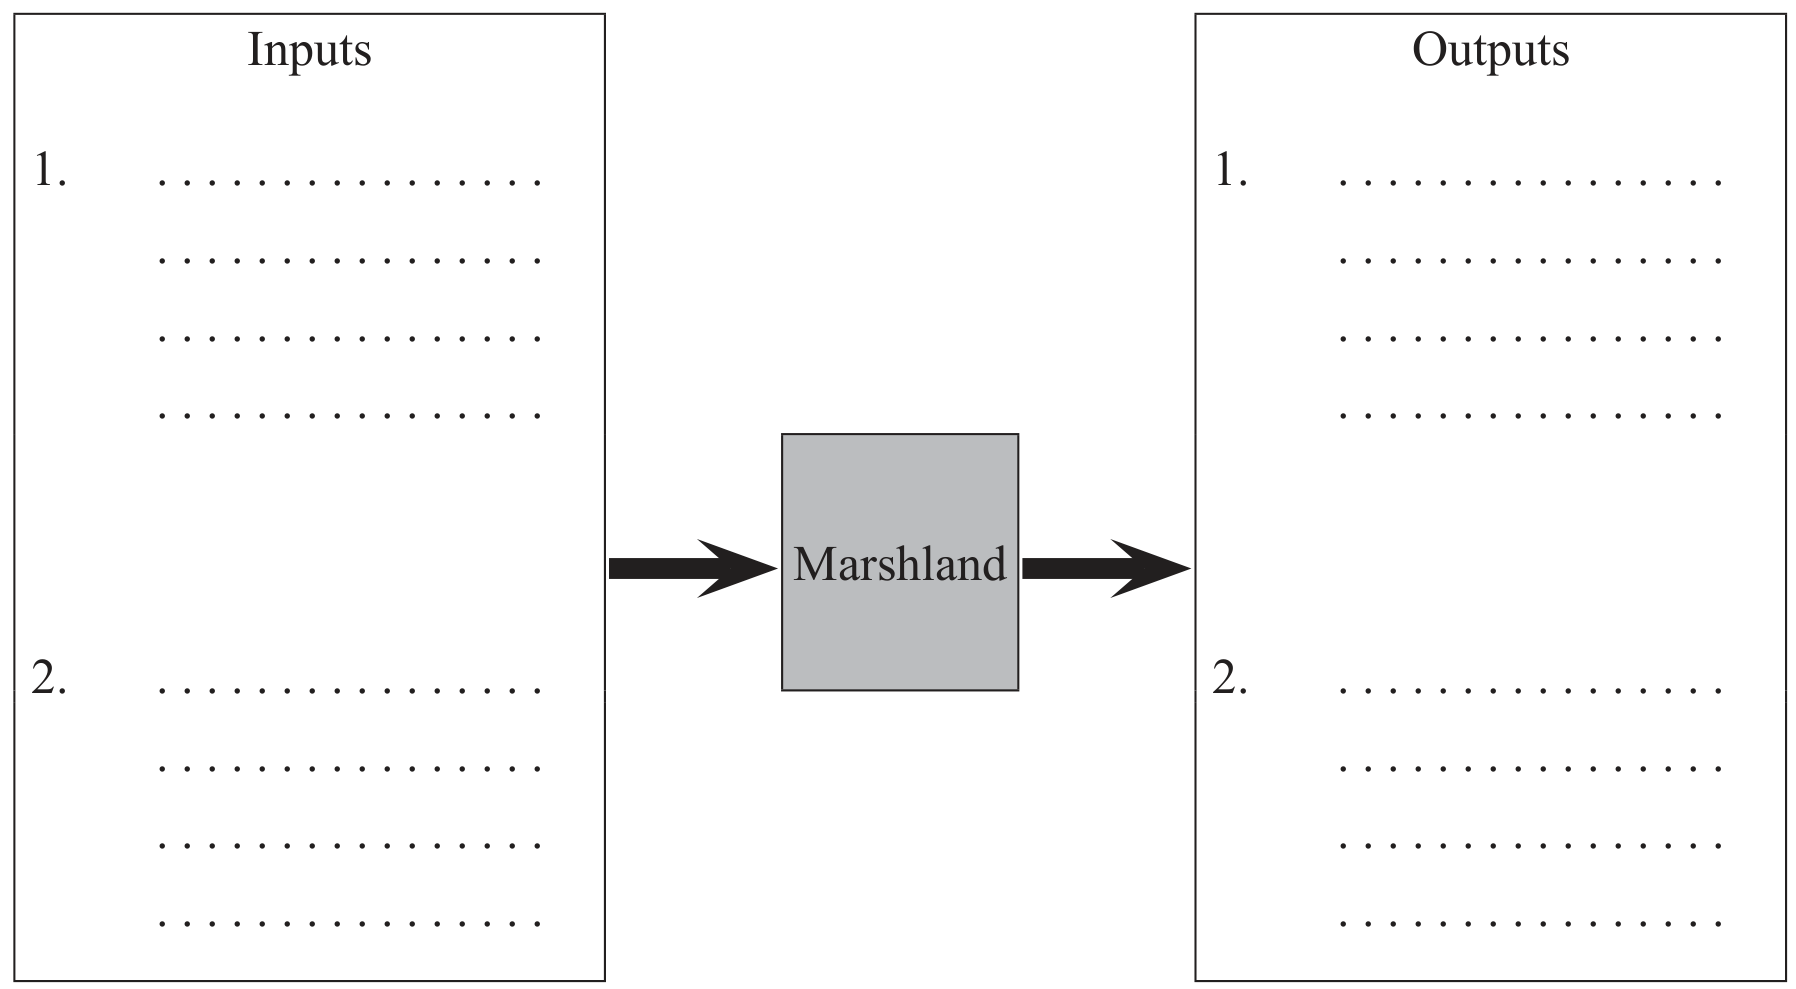
Systems diagram for water inputs and outputs in the marshland ecosystem
The Iraq/Iran marshlands once covered about 15000 km^2.
The marshes receive only about 100 mm of rainfall each year while more than 2500 mm evaporates, leaving salty water.
Spring snowmelt formerly flowed down from Iran and Turkey, bringing sediment and washing away salty water.
The wetlands developed many endemic species and filtered pollutants; local food systems used fishing and water buffalo, and reeds were used for construction.
[ 2 ]