(a)
(i)
With reference to Figure 9, compare the numbers of species in the re-flooded marsh with historical records.
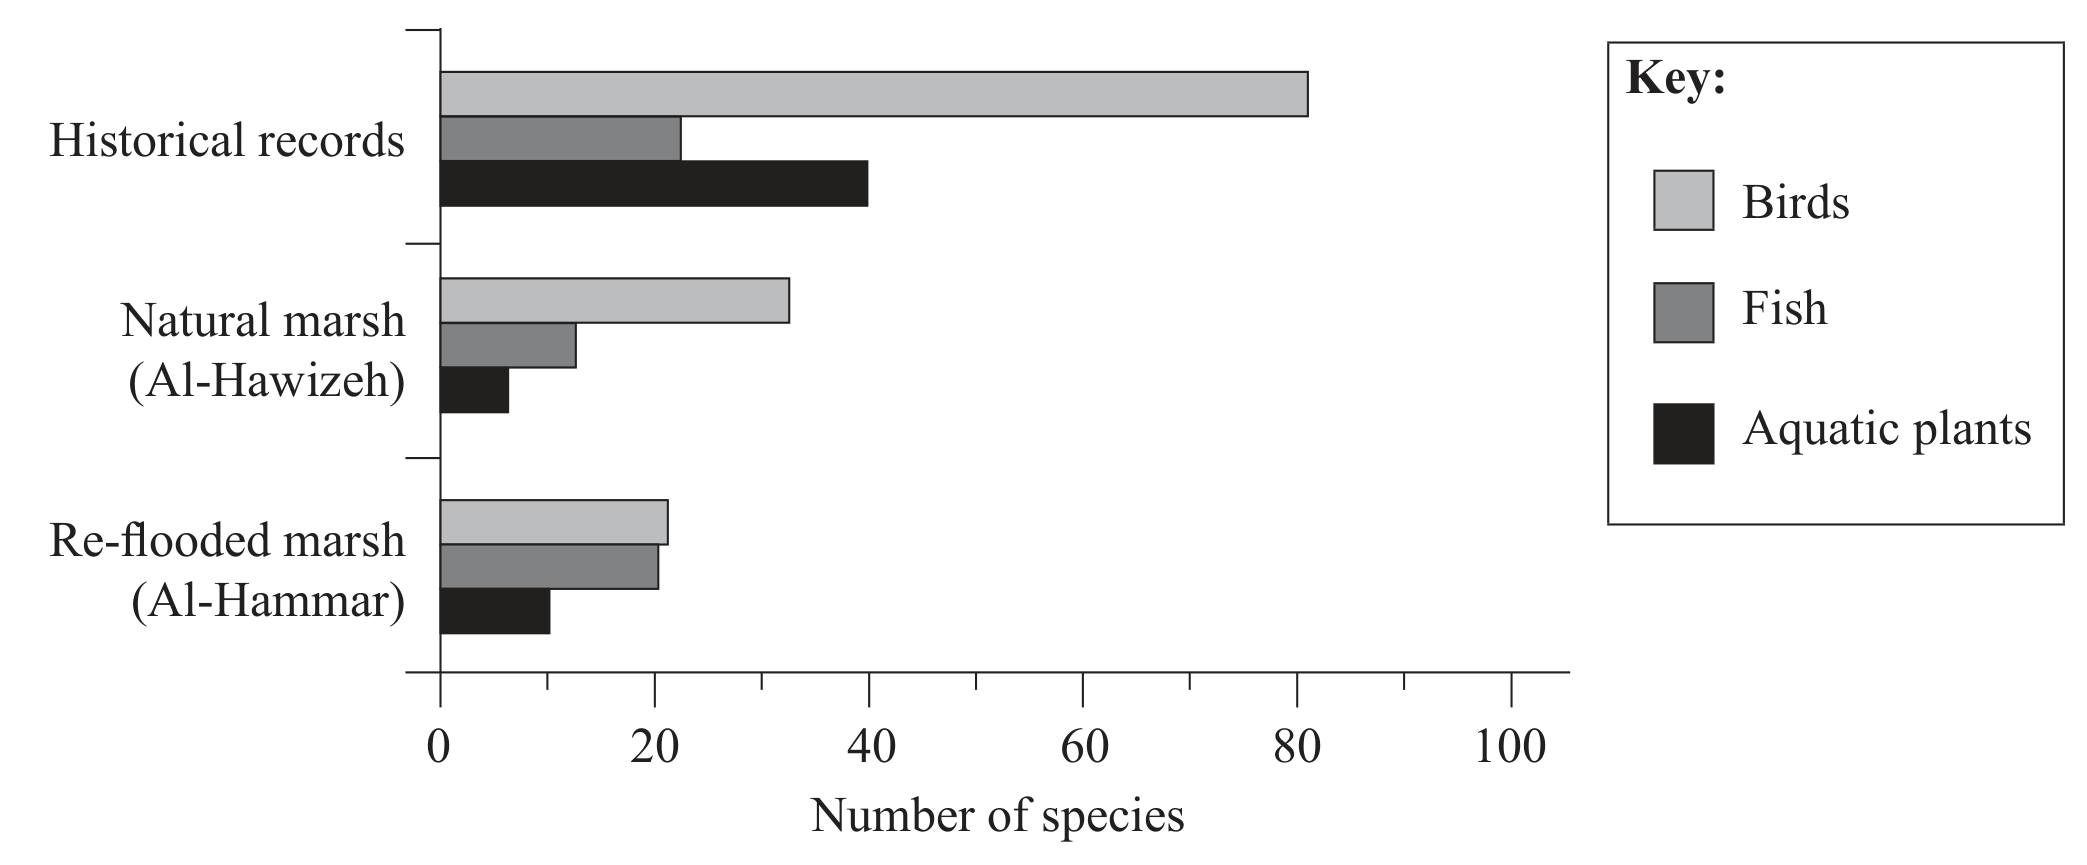
Figure 9: Species numbers in natural and re-flooded marshes
[ 2 ]
 EduNinja
With reference to Figure 9, compare the numbers of species in the re-flooded marsh with historical records.
Figure 9: Species numbers in natural and re-flooded marshes
Zebra stripes may reduce the ability of the biting flies to land on the zebra. Describe how natural selection may have led to the evolution of zebra stripes in response to biting flies.
State one reason why the Niger Delta tropical swamp forest biome is
ecologically valuable.
The biome forms on a low-lying coastal delta from sediment deposited by the Niger River. Over 80% of the delta floods seasonally and swamps remain when flood waters drain away. It has played an important role in the global economy through slave trade, palm oil and fossil fuels over 400 years. Selected organisms have critical/endangered conservation status. Flora and fauna have only been systematically surveyed since the 1980s. Endemic species include Niger Delta red colobus and Heslop’s pygmy hippopotamus. The delta may be a meeting point for chimpanzee populations. It includes 75% of Africa’s remaining mangrove forests. Swamp forests have no large-scale formal protection, although crocodiles and chimpanzees receive some protection.
Selected species shown include Abura, mangrove species, Heslop’s pygmy hippopotamus, chimpanzee, Niger Delta red colobus and West African dwarf crocodile.
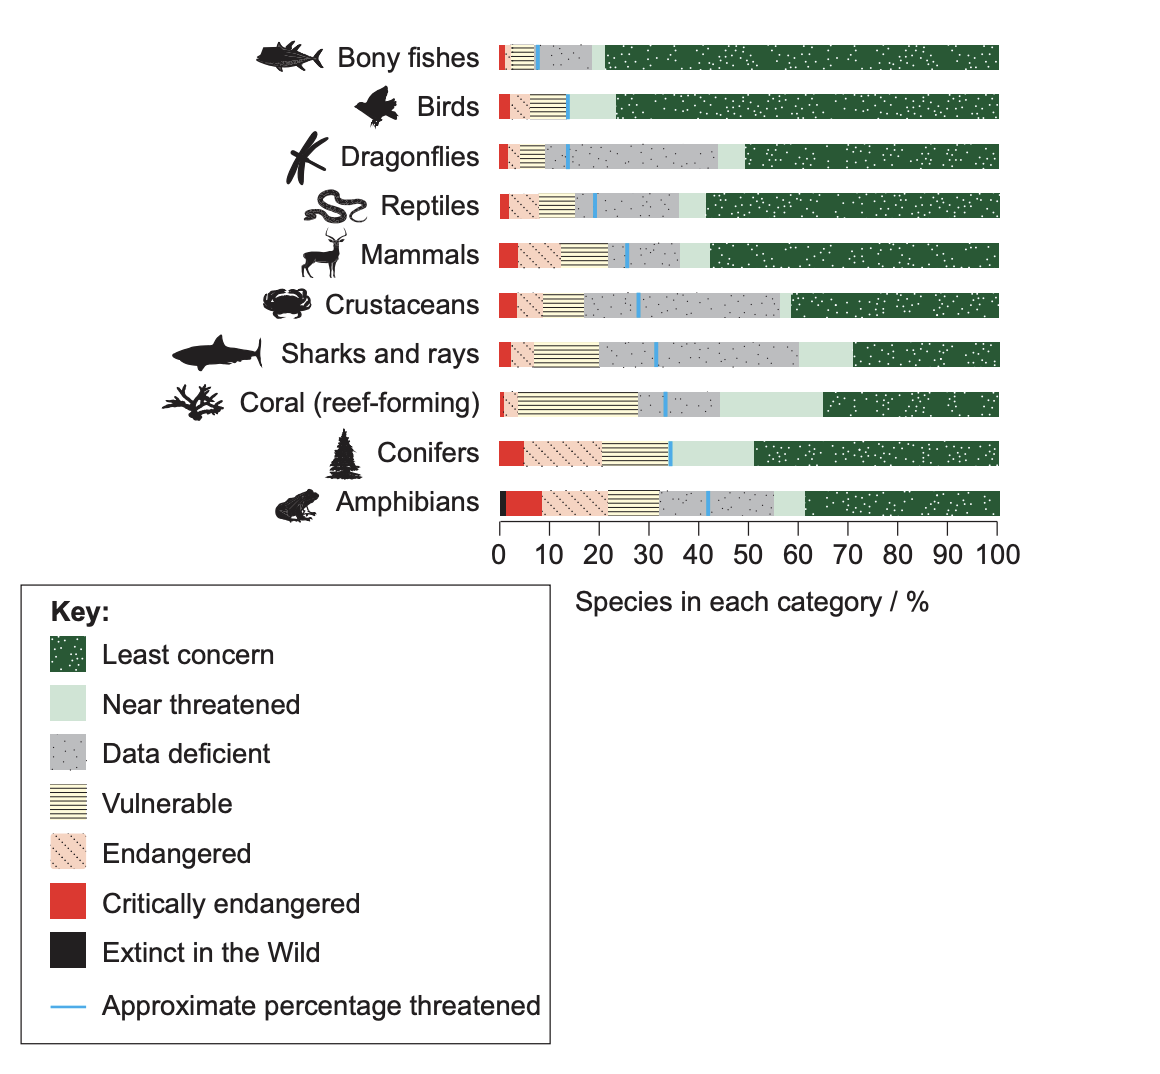
Figure 1(a): Extinction risk levels in global biodiversity
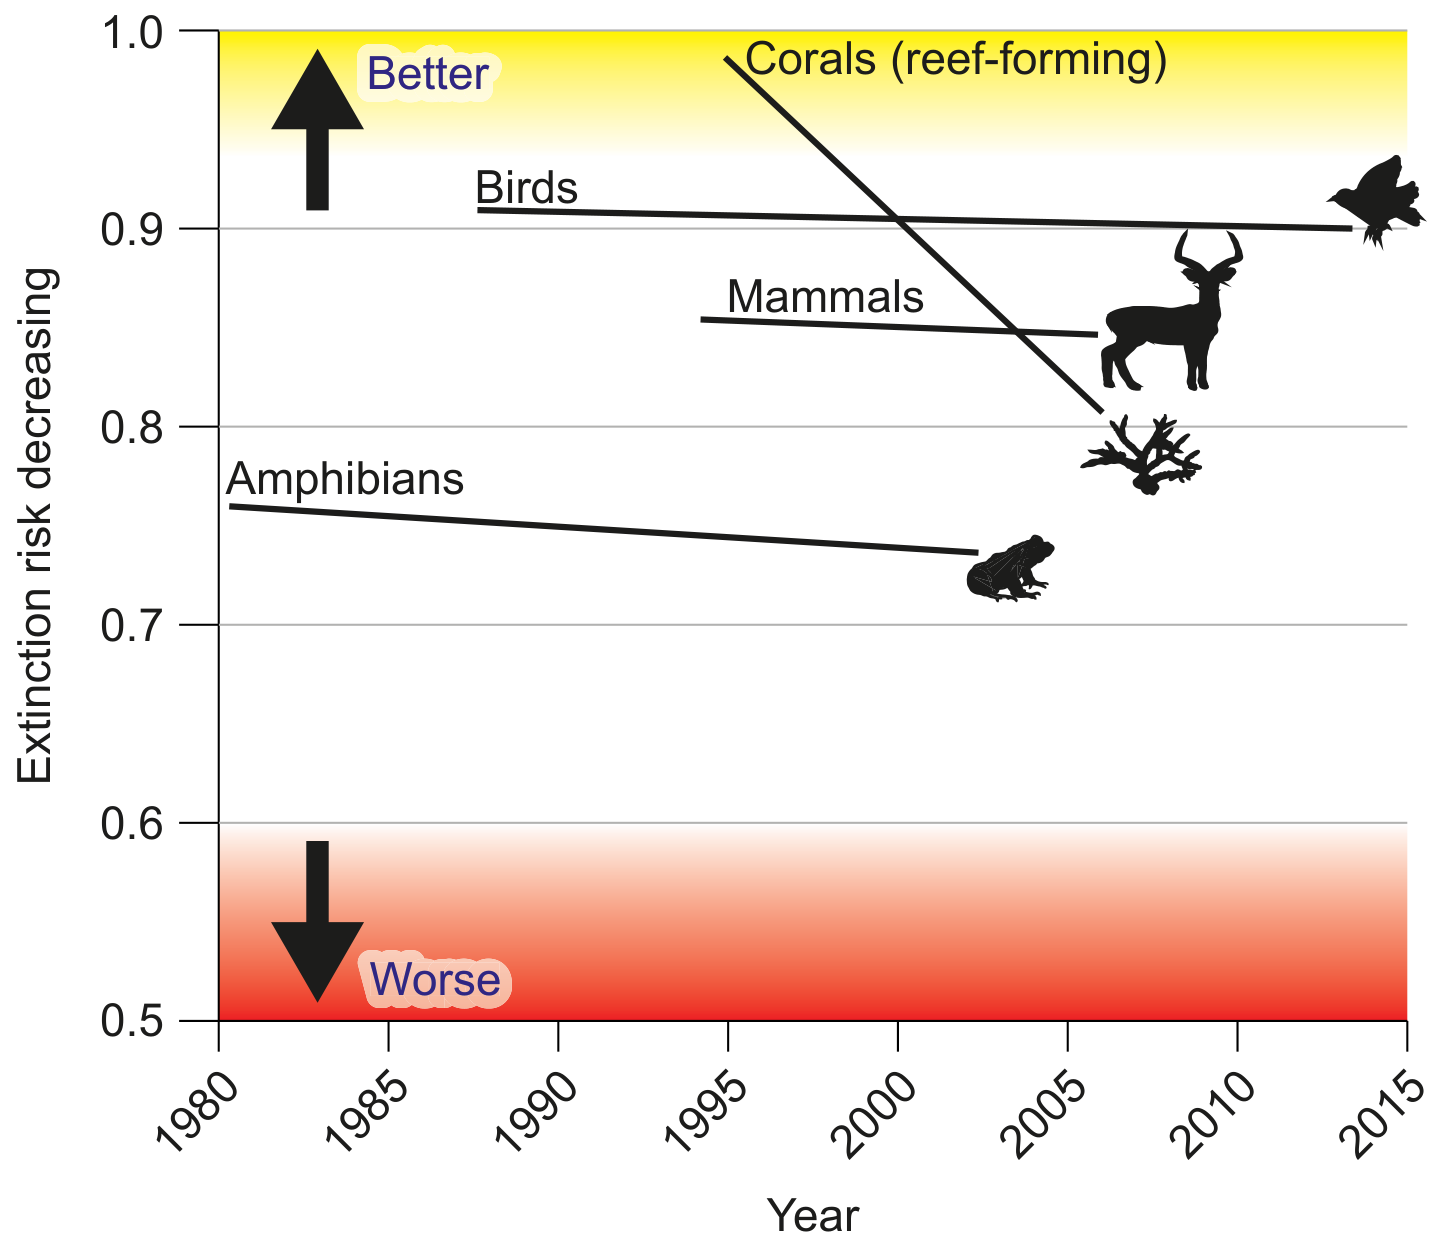
Figure 1(b): Changing species extinction risk 1980-2015
Figures 1(a) and 1(b) are based on records for species diversity. Identify one other factor that may be measured to assess the diversity of life on Earth.
The family Leporidae includes hares and rabbits. The figures show four species that can be found in western North America.
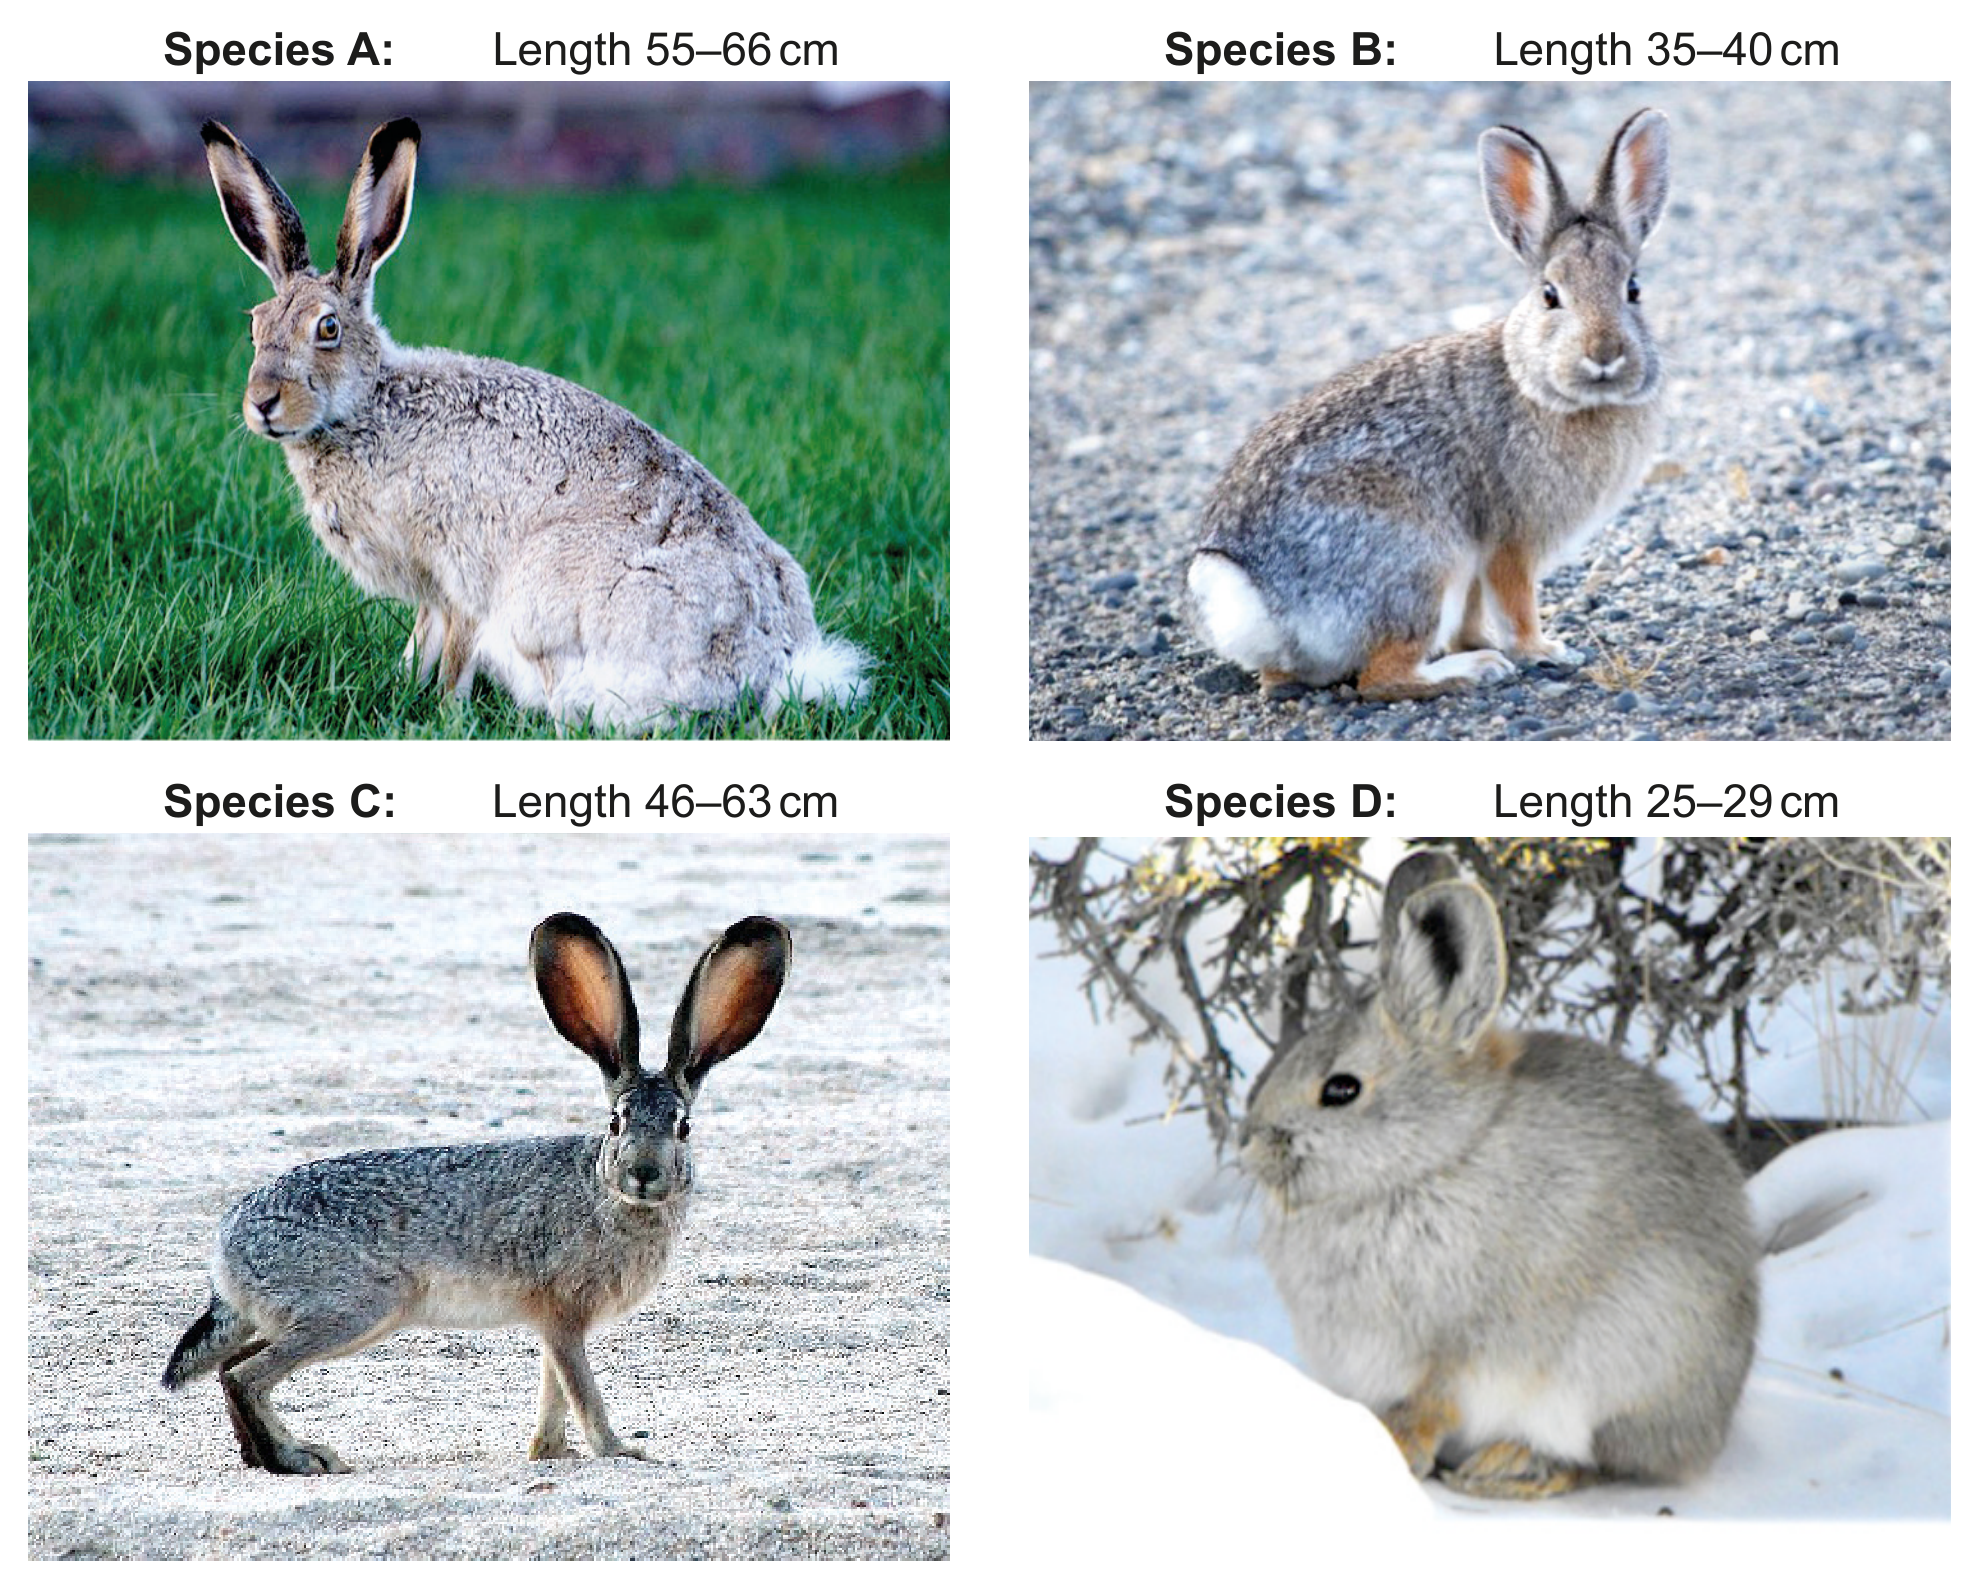
Figure 1(a): Four species of the family Leporidae
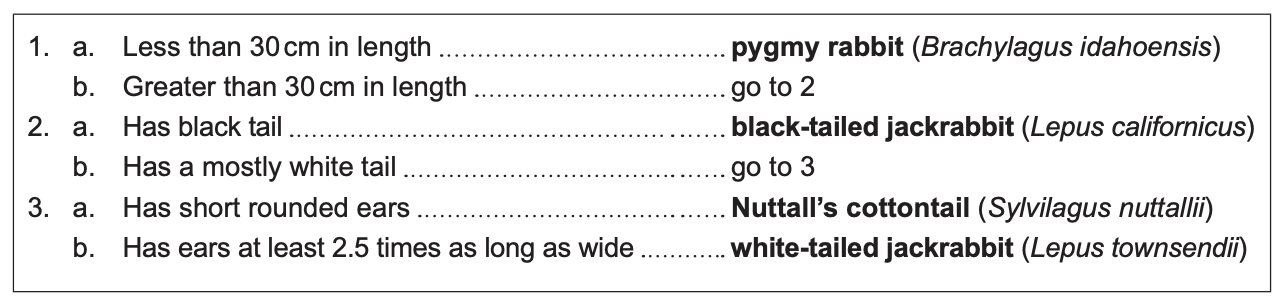
Figure 1(b): A dichotomous key for species A to D
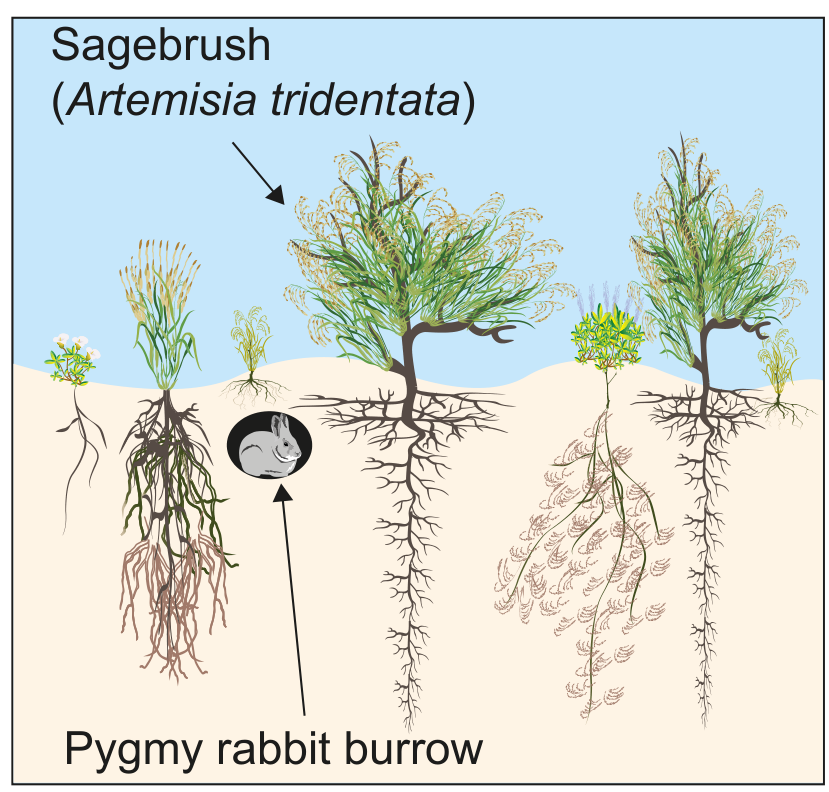
Figure 1(c): Sagebrush ecosystem without invasive cheatgrass
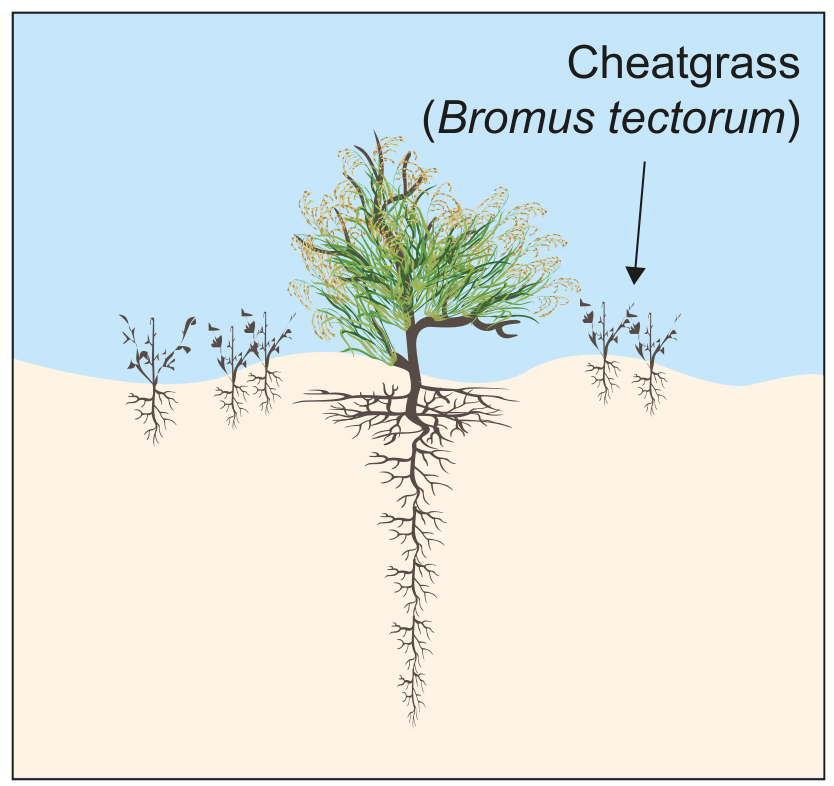
Figure 1(d): Sagebrush ecosystem with invasive cheatgrass
Distinguish between the biodiversity of the sagebrush ecosystems in
Figures 1(c) and 1(d).
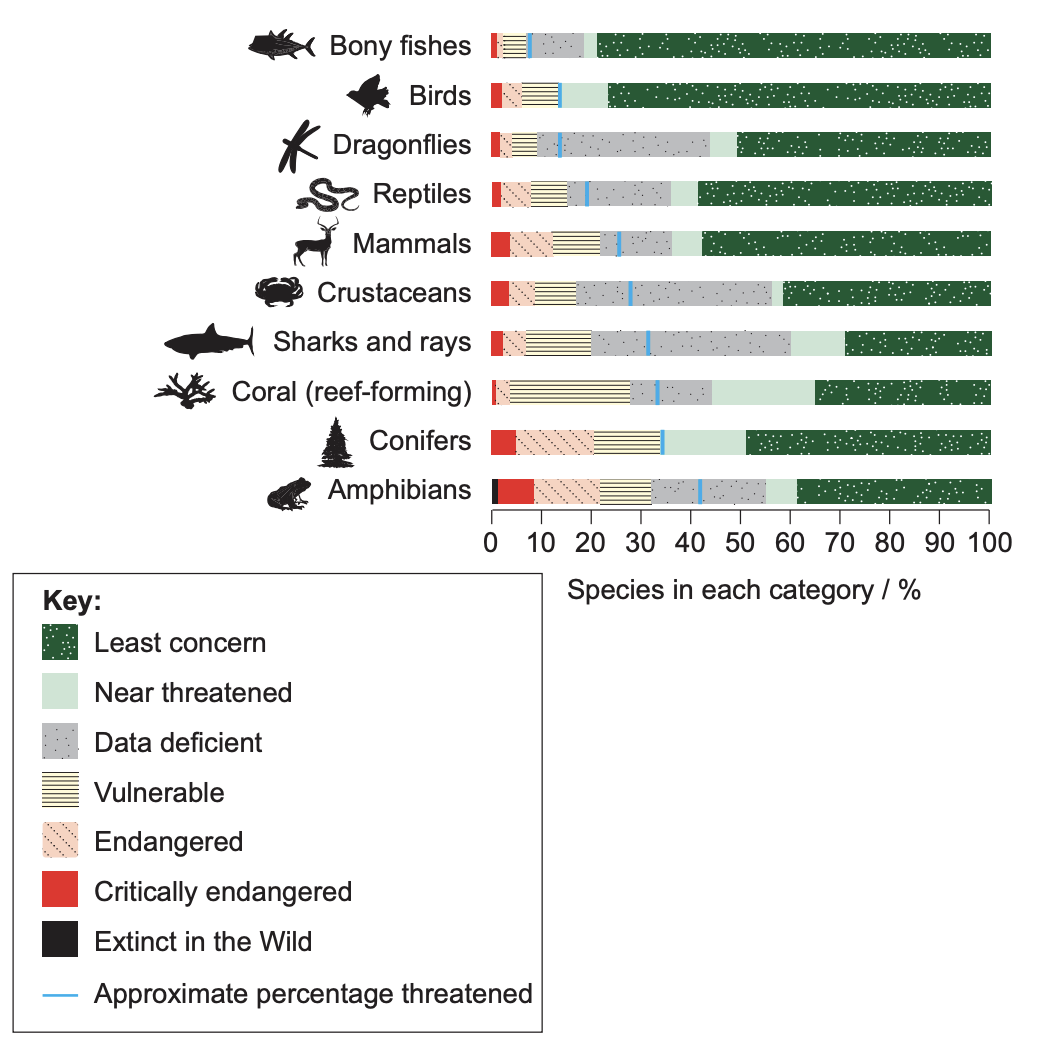
Figure 1(a): Extinction risk levels of species in global biodiversity by category
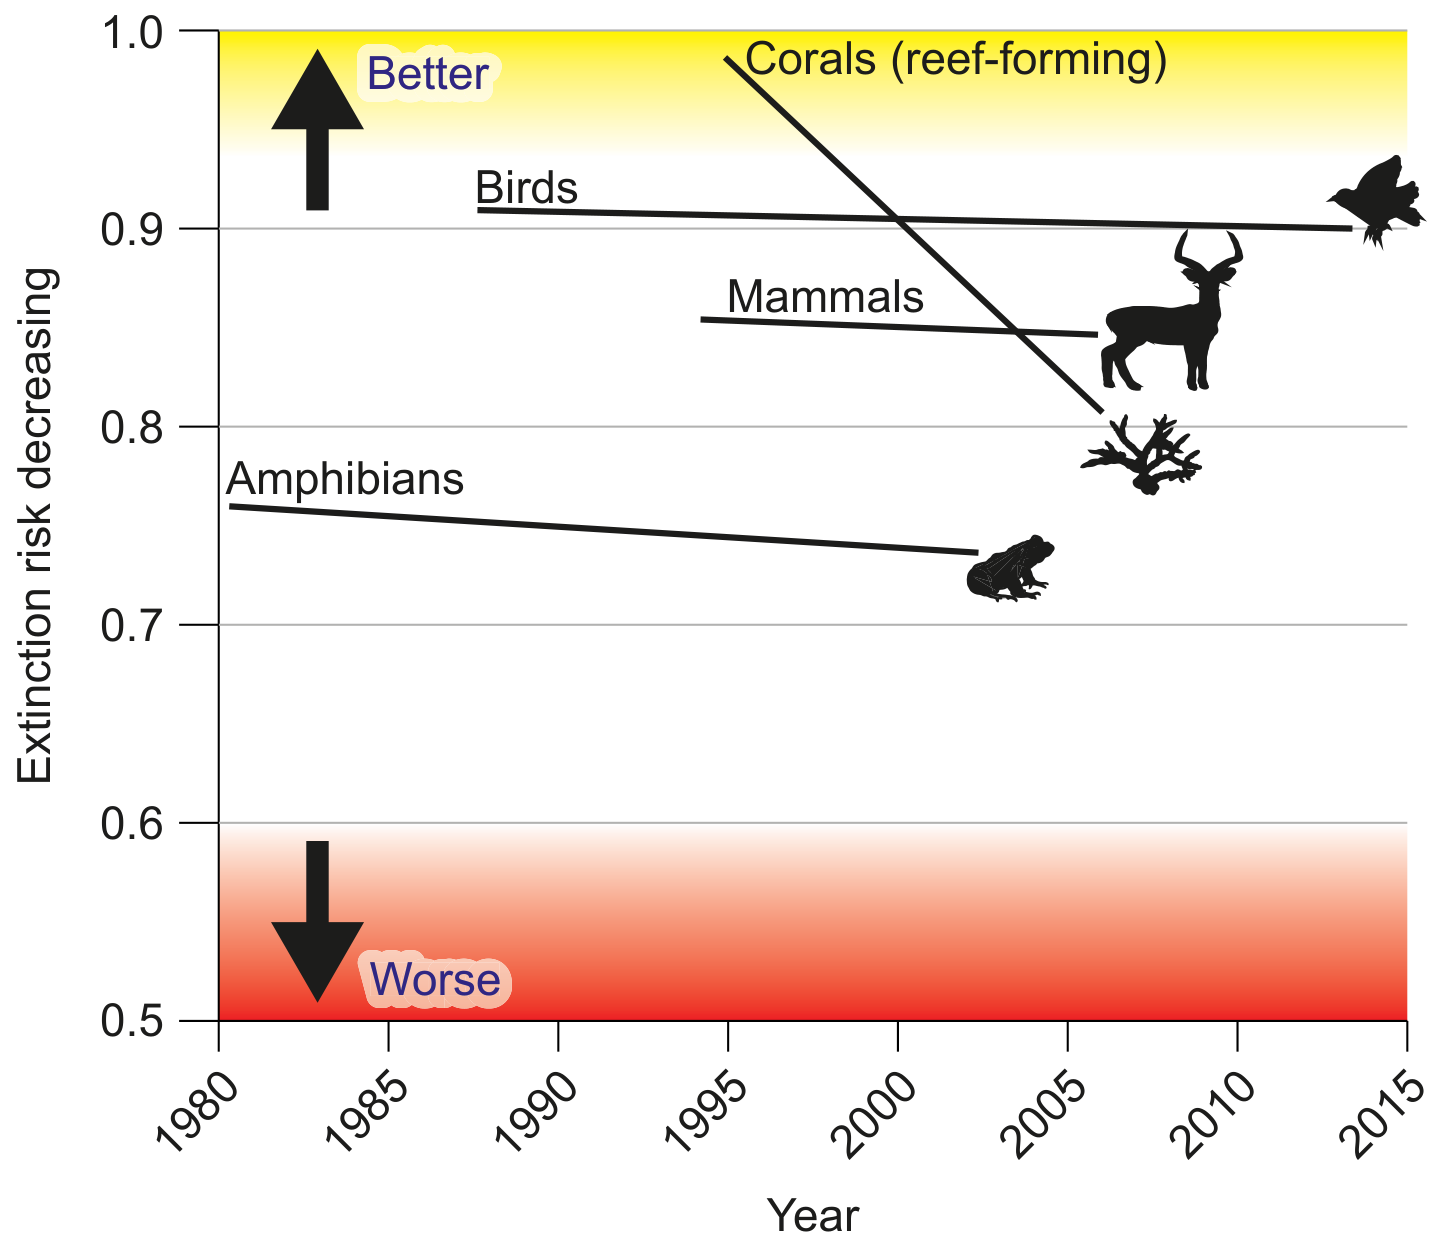
Figure 1(b): Changing species extinction risk by category 1980-2015
Figures 1(a) and 1(b) are based on records for species diversity. Identify one other factor that may be measured to assess the diversity of life on Earth.
With reference to Figures 4(b) and 4(c), suggest how fish diversity may be influenced by the habitat diversity of the Coral Triangle.
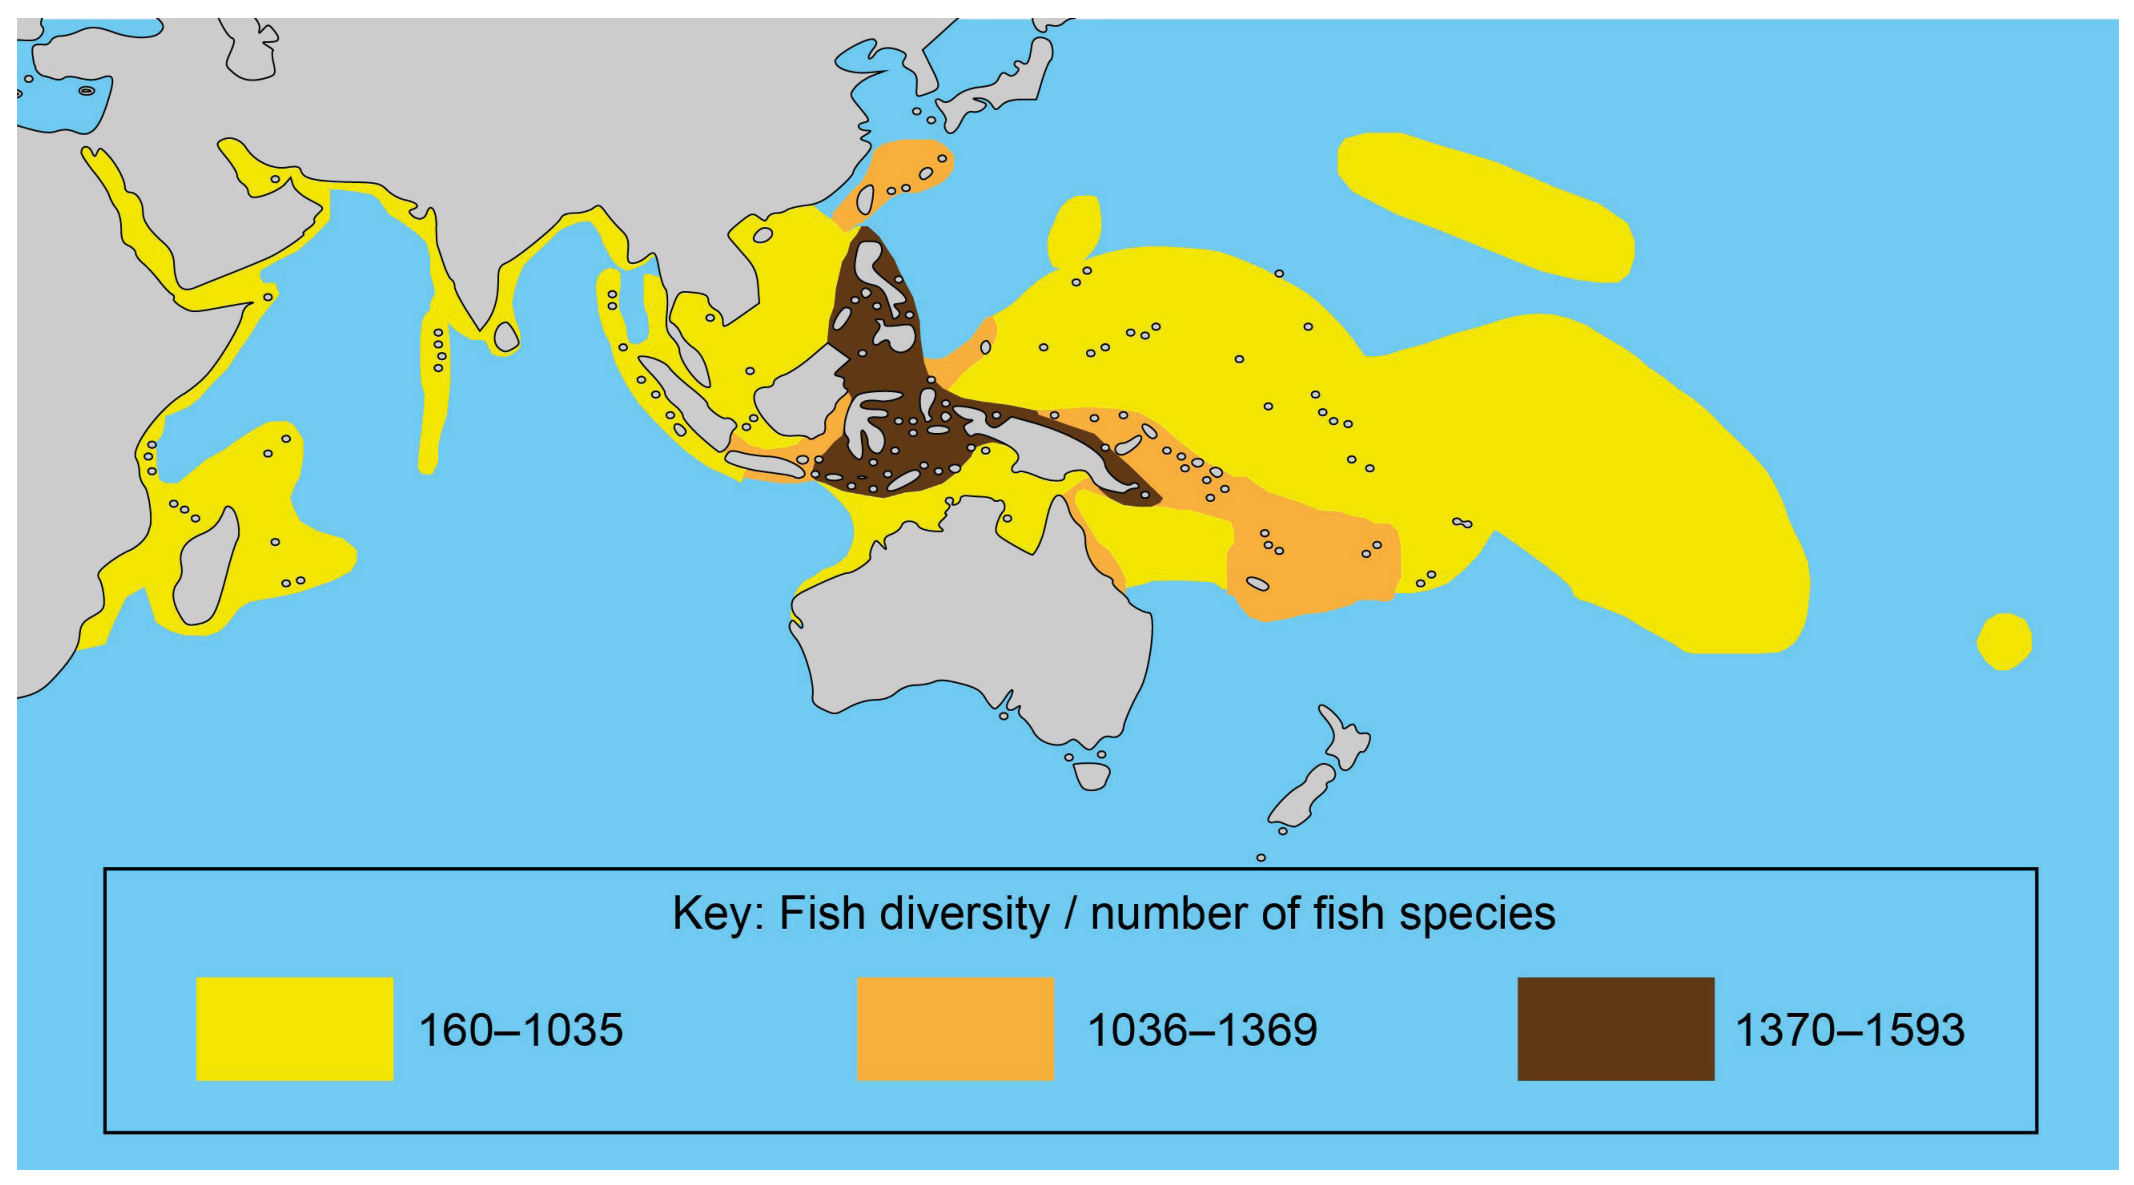
Figure 4(b): Coral reef fish diversity
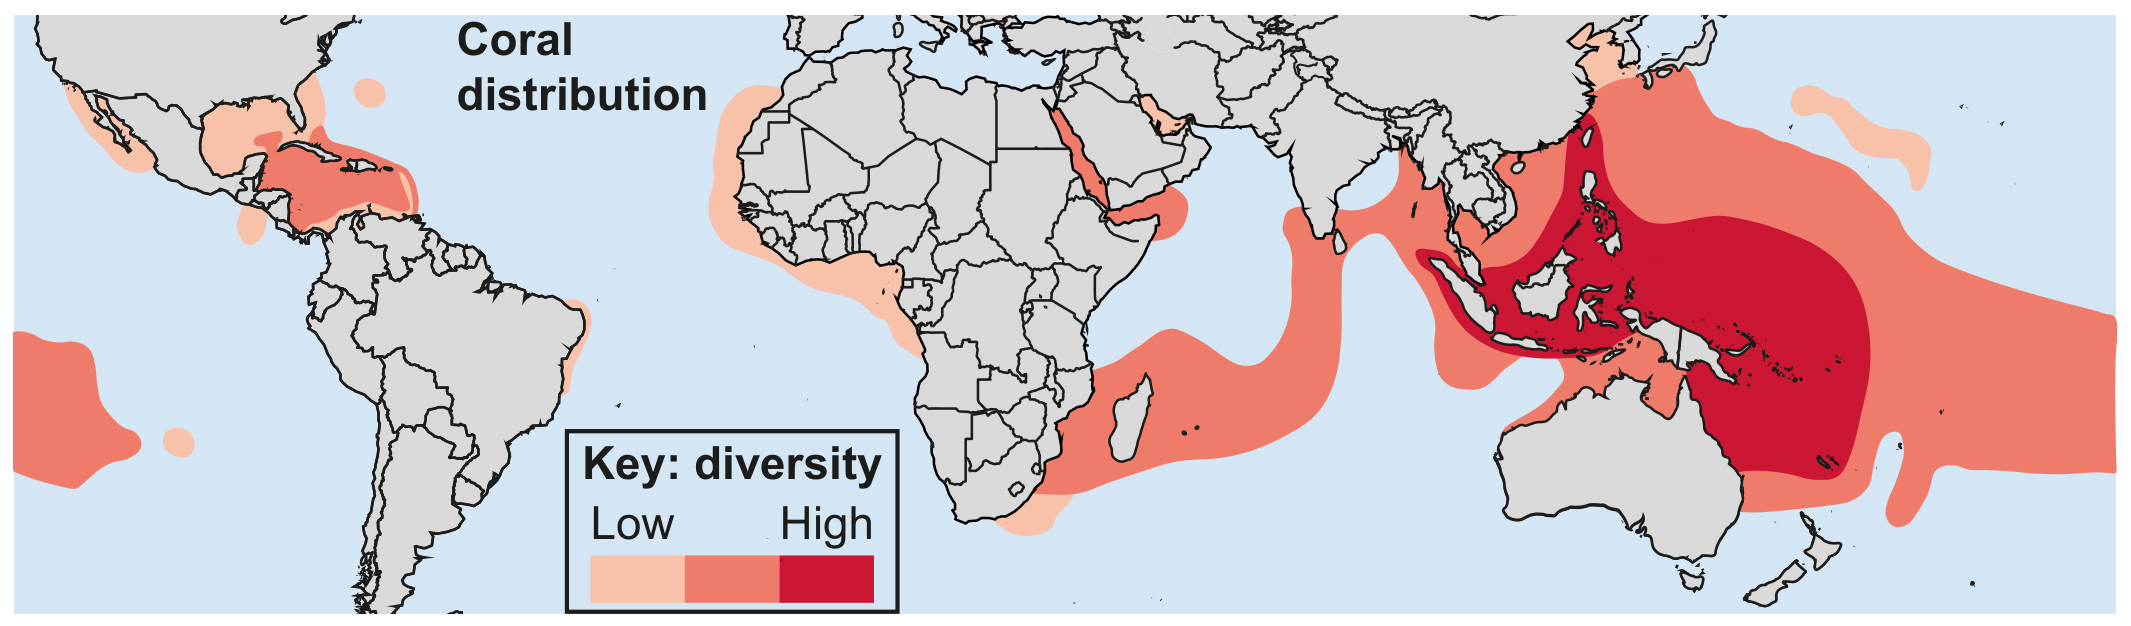
Figure 4(c): Coral distribution and diversity
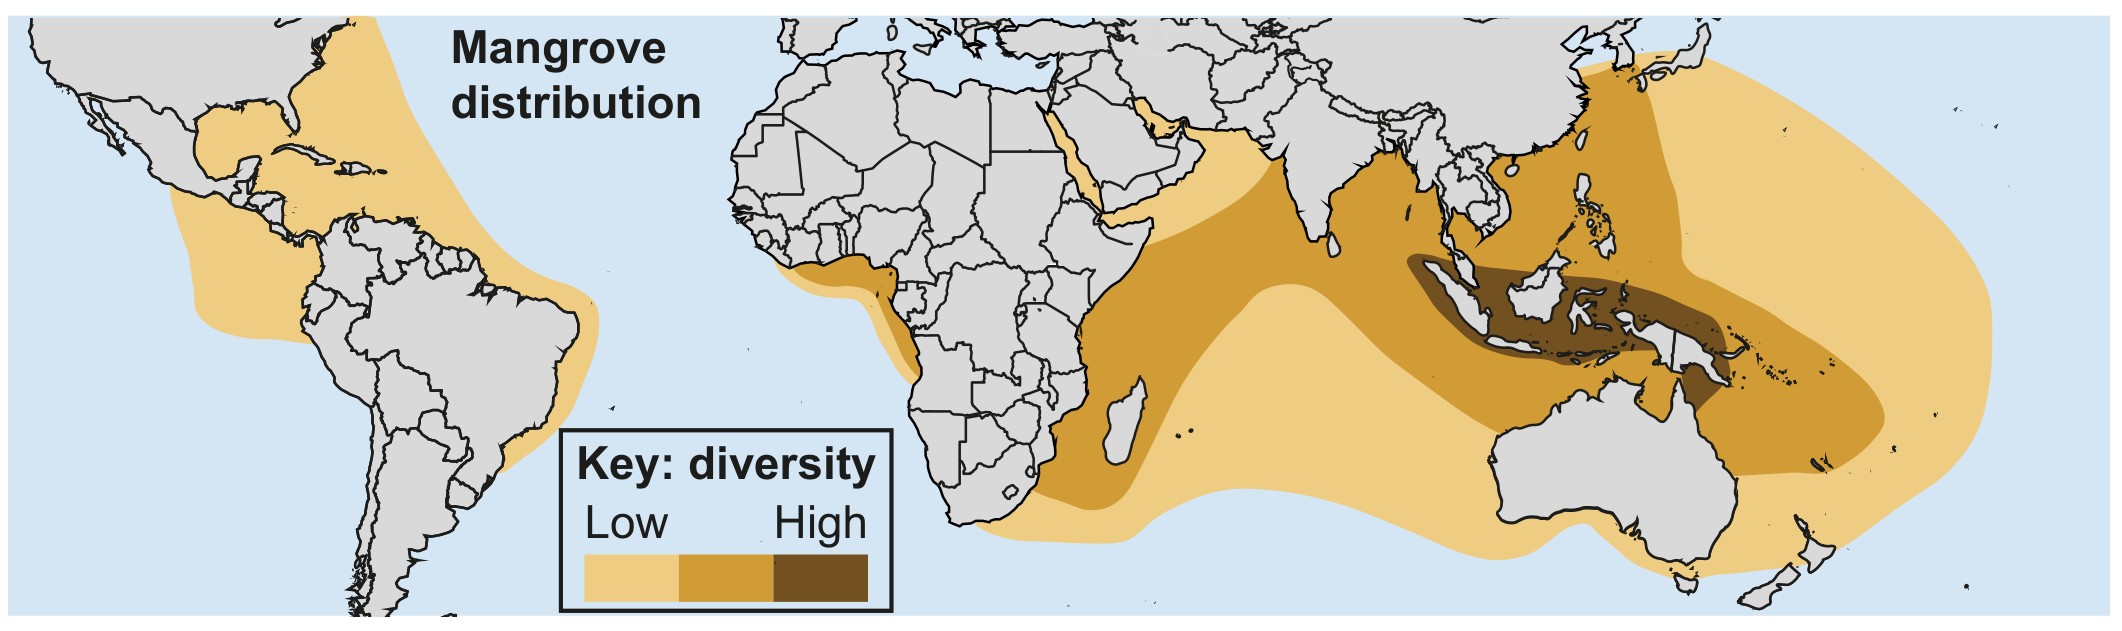
Figure 4(c): Mangrove distribution and diversity
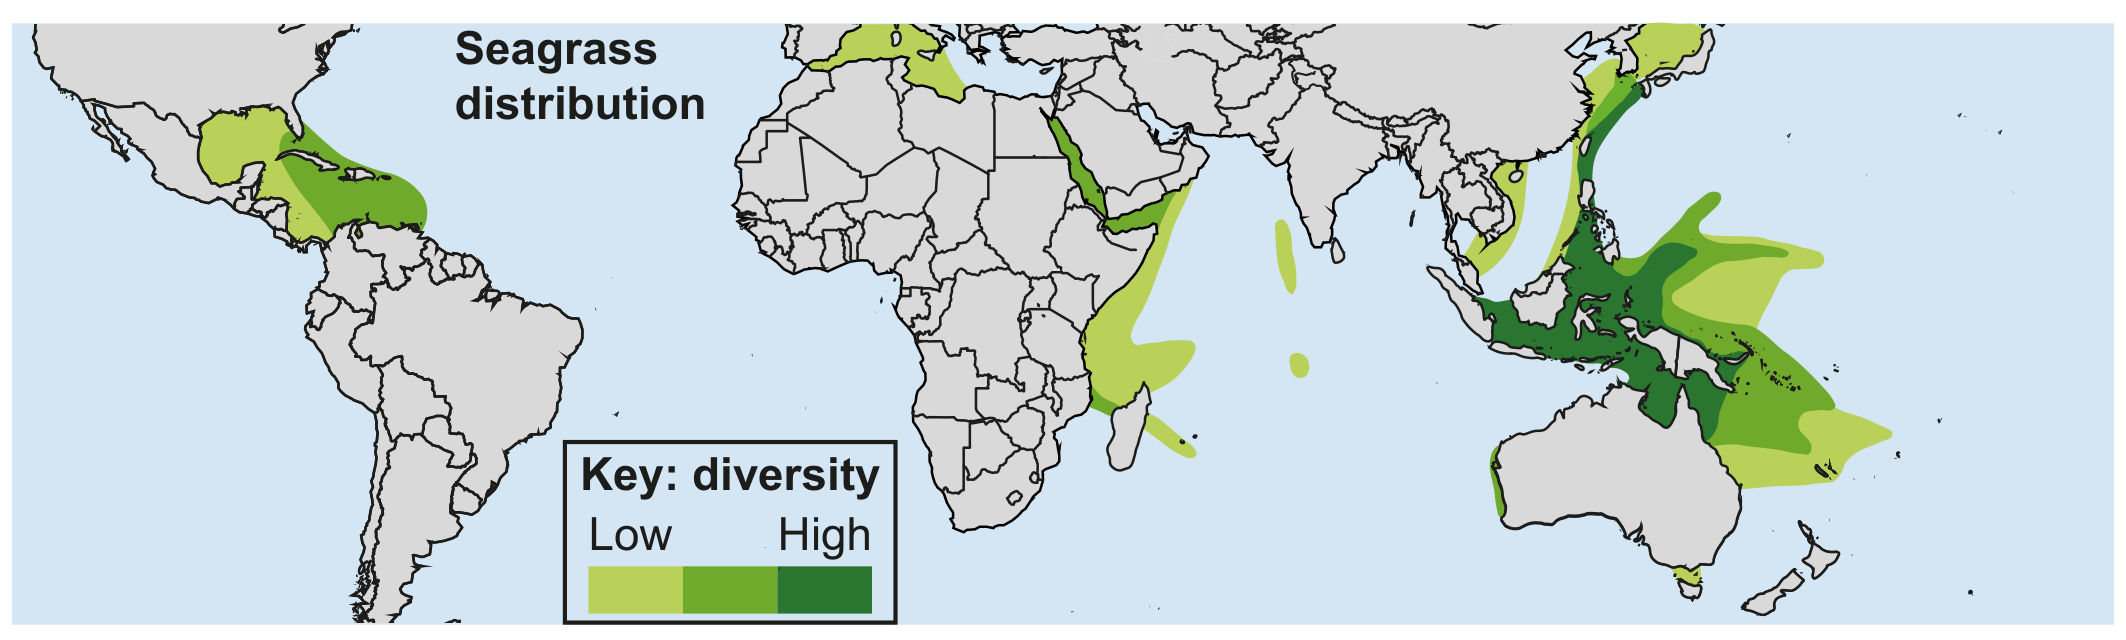
Figure 4(c): Seagrass distribution and diversity
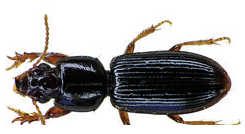
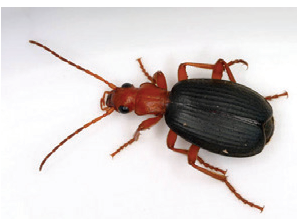
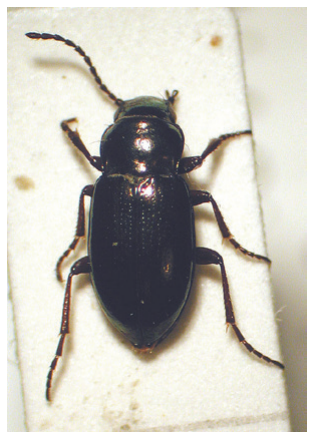
Figure 1: The photographs ( A, B, C, D and E ) are of five different insect species found in the litter layer of a small area of a forest. The number of each species are shown below each photograph.
A
(5)
B
(2)
c
(6)

Figure 1
D
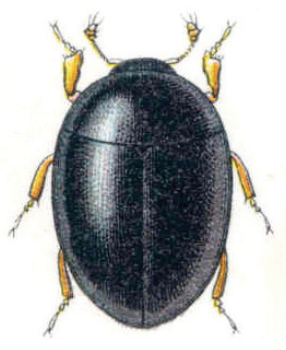
(1)
E
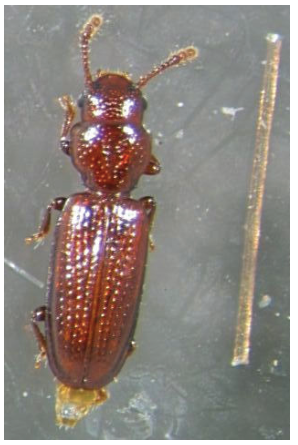
(22) org/wiki/File:Clivina_fossor_bl.jpg\#/media/File:Clivina_fossor_bl.jpg
"Brachinus spPCCA20060328-2821B" by Patrick Coin (Patrick Coin) - Photograph taken by Patrick Coin. Licensed under CC BY-SA 2.5 via Commons - https://commons.wikimedia.org/wiki/File:Brachinus_spPCCA20060328-2821B.jpg\#/media/ File:Brachinus_spPCCA20060328-2821B.jpg
"Trachypachus zetterstedtii" by M. Virtala - http://wibe.ath.cx/insectimages/file?dir=images\&op=show Species\&order=COL\&family=Trachypachidae\&genus=Trachypachus\&species=zetterstedtii\&photographer=. Licensed under Copyrighted free use via Commons - https://commons.wikimedia.org/wiki/File:Trachypachus_zetterstedtii.jpg\#/ media/File:Trachypachus_zetterstedtii.jpg
"Sphaerius.acaroides.Reitter.tafel64" by cutted from Reitter (1845-1920): "Fauna Germanica: Die Käfer des deutschen Reiches". Licensed under Public Domain via Commons - https://commons.wikimedia.org/wiki/File:Sphaerius.acaroides.Reitter. tafel64.jpg\#/media/File:Sphaerius.acaroides.Reitter.tafel64.jpg (E) "Saphophagus" by S.E. Thorpe, courtesy of I. Stringer - photo of specimen. Licensed under Public Domain via Commons https://commons.wikimedia.org/wiki/File:Saphophagus.jpg\#/media/File:Saphophagus.jpg] (a) (i) Calculate the Simpson's diversity index for the insect species found in Figure 1.
(ii) Identify two possible reasons why species B and C were not present in the litter layer when it was resampled six months later.
(b) (i) Identify one abiotic factor which may affect the population of insects in a forest.
(ii) Describe a method measuring changes in the abiotic factor you have identified in 2(b)(i).
(c) Distinguish between a mutualistic relationship and a parasitic relationship.
Figure 2: Graph showing changes in the populations of two forest species over time.
Please go to: http://www.nature.com/scitable/knowledge/library/dynamics-of-predation-13229468
"Dynamics of Predation" © 2010 Nature Education
We use Figure 3.
(d) Explain the relationship between the prey and predators shown in Figure 2.
Resource booklet context: protected areas and biodiversity
- Over 25% of land is protected forest and reserves with over 190 protected sites.
- Ecosystems range from coral reefs and mangroves to tropical rainforests and provide goods and environmental services.
| Total number of species | more than 500000 |
|---|---|
| Flowering plants | 9000 |
| Ferns | 800 |
| Mammals | 250 |
| Birds | 850 |
| Reptiles | 220 |
| Amphibians | 200 |
| Insects | more than 300000<br>(including more than 1200 butterflies and 8000 moths) |
Figure 5(b): Estimated number of species in Costa Rica
Outline one reason why it is difficult to determine the exact number of species in Costa Rica.
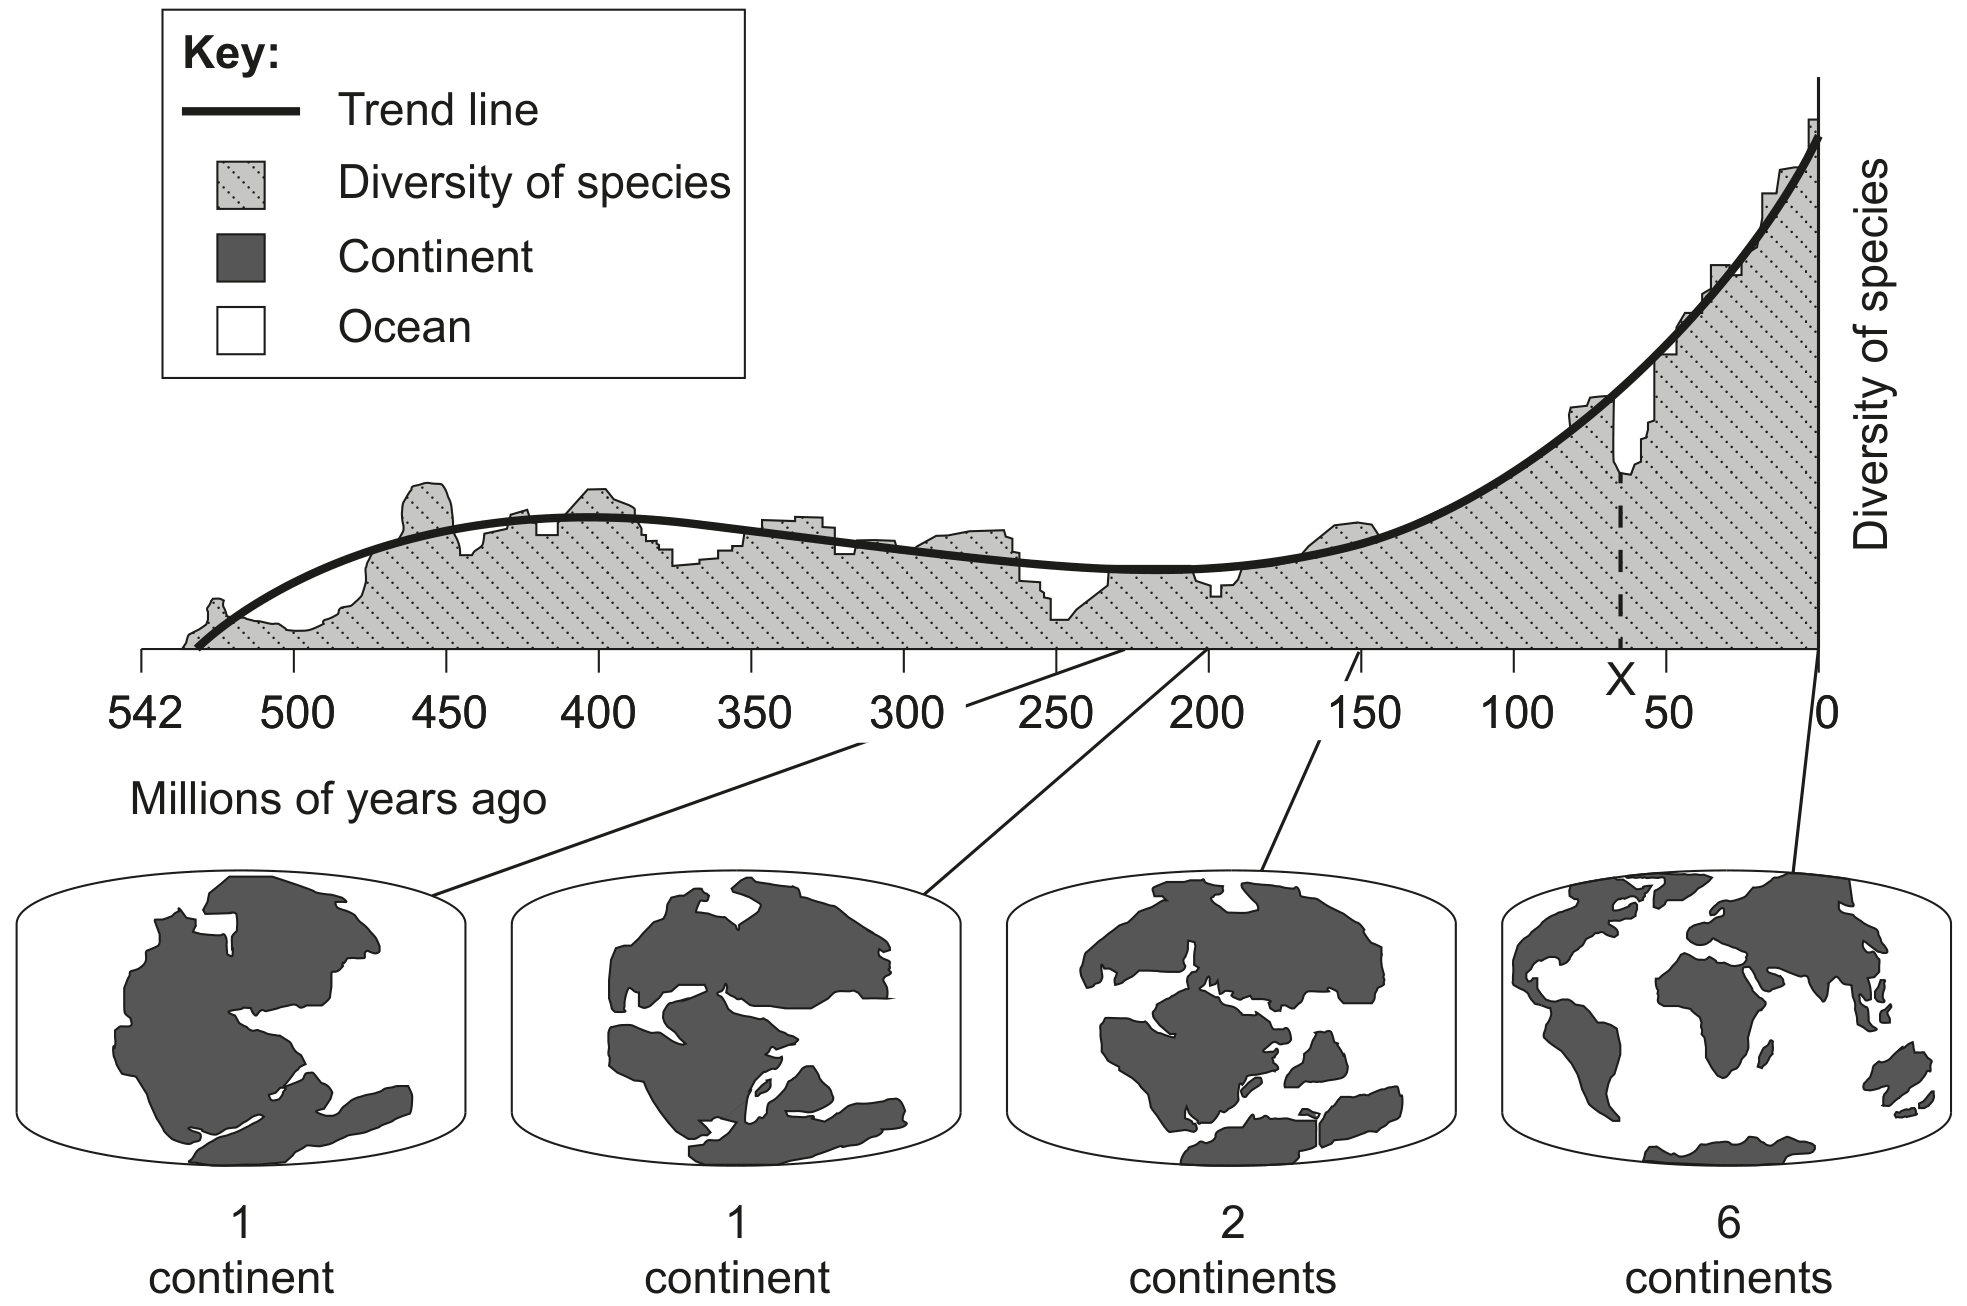
Figure 2: Distribution of continents and diversity of species over time
With reference to Figure 2, identify when the diversity of species was lowest in the past 400 million years.
Identify the relationship between the number of continents and the diversity of species during the past 250 million years.
Describe two reasons why there is a relationship between the number of continents and the diversity of species.
Outline the role of natural selection in increasing the diversity of species.