(a)
Suggest one method that could have been used to estimate the tiger population.
[ 1 ]
(b)
Outline one difficulty that might be encountered in collecting this type of data.
[ 1 ]
 EduNinja
Suggest one method that could have been used to estimate the tiger population.
Outline one difficulty that might be encountered in collecting this type of data.
The family Leporidae includes hares and rabbits. The figures show four species that can be found in western North America.
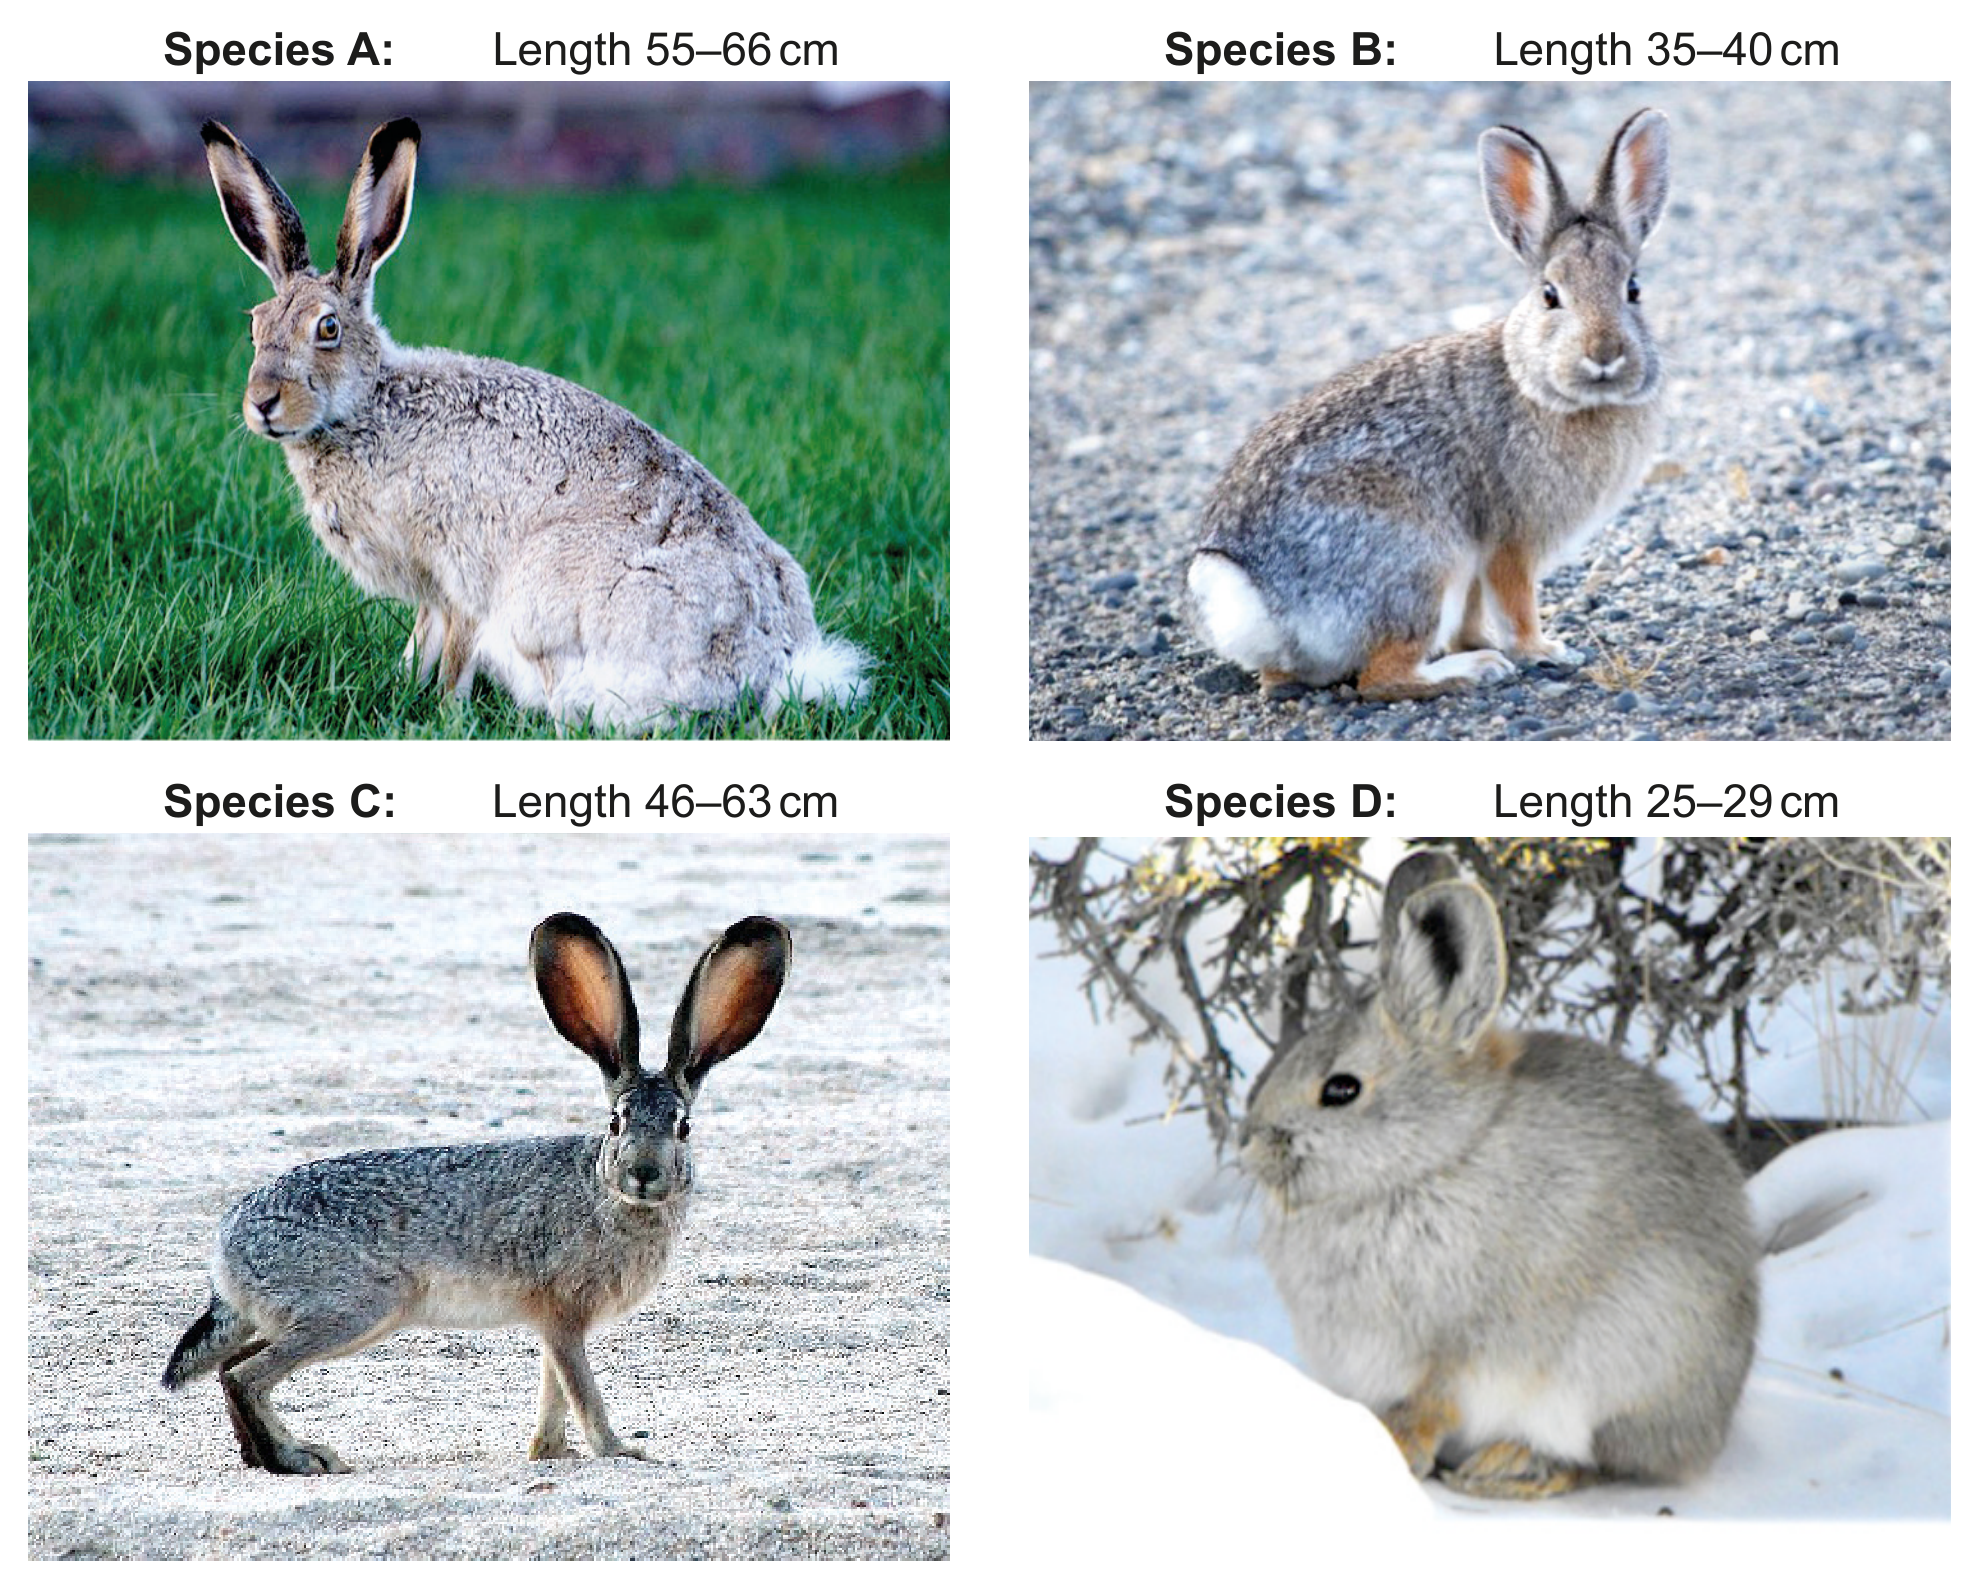
Figure 1(a): Four species of the family Leporidae
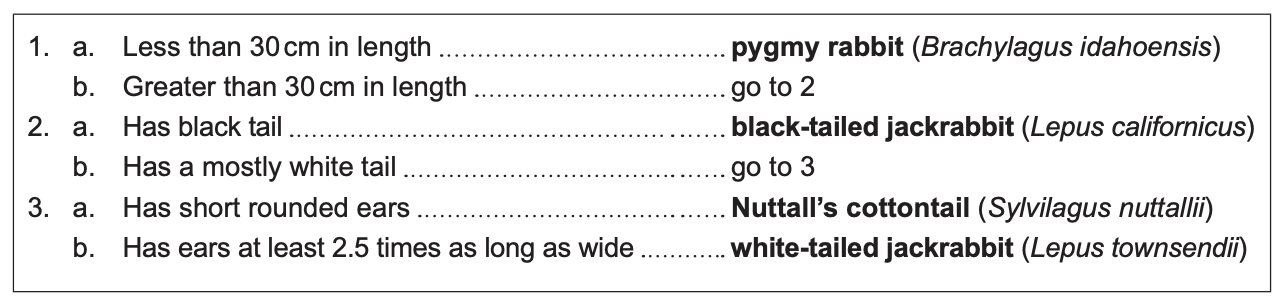
Figure 1(b): A dichotomous key for species A to D
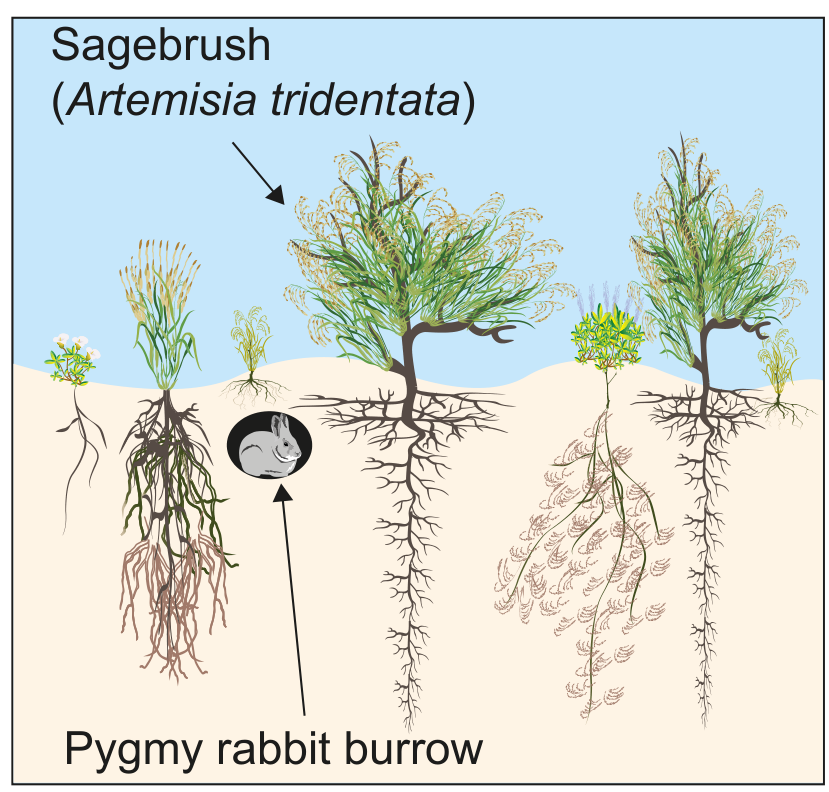
Figure 1(c): Sagebrush ecosystem without invasive cheatgrass
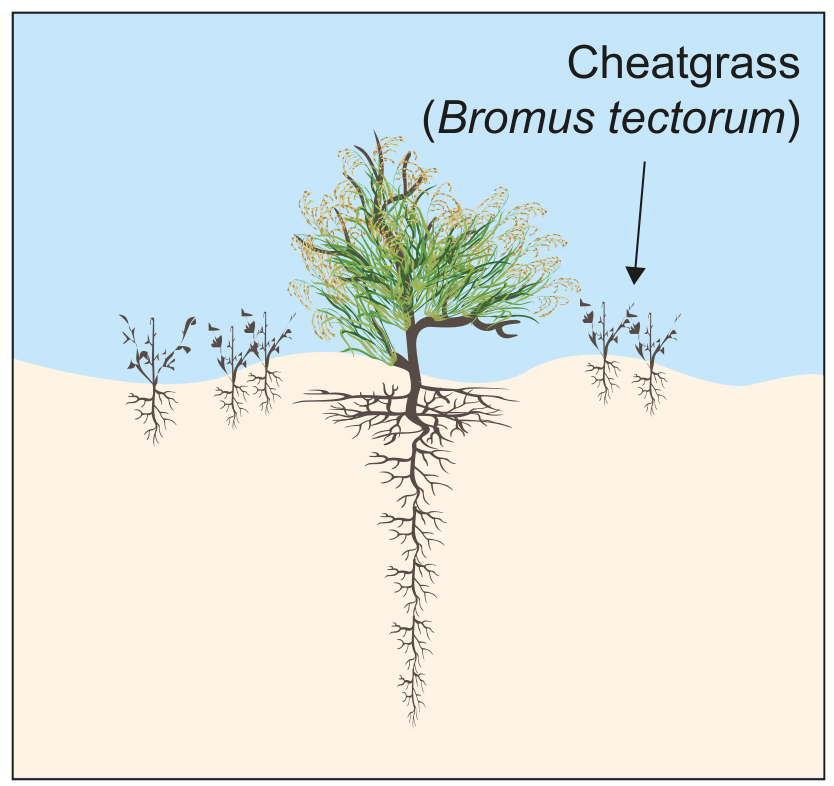
Figure 1(d): Sagebrush ecosystem with invasive cheatgrass
Use Figures 1(a) and 1(b) to identify Species B and Species C.
The sagebrush ecosystem provides a habitat for pygmy rabbits. Suggest one reason why there might be a greater number of pygmy rabbits in the ecosystem shown in Figure 1(c) than in the ecosystem shown in Figure 1(d).
Describe one method to determine the impact of invasive cheatgrass on sagebrush density.
State the trophic level of the zebra.
State the type of relationship that exists between biting flies and the zebra.
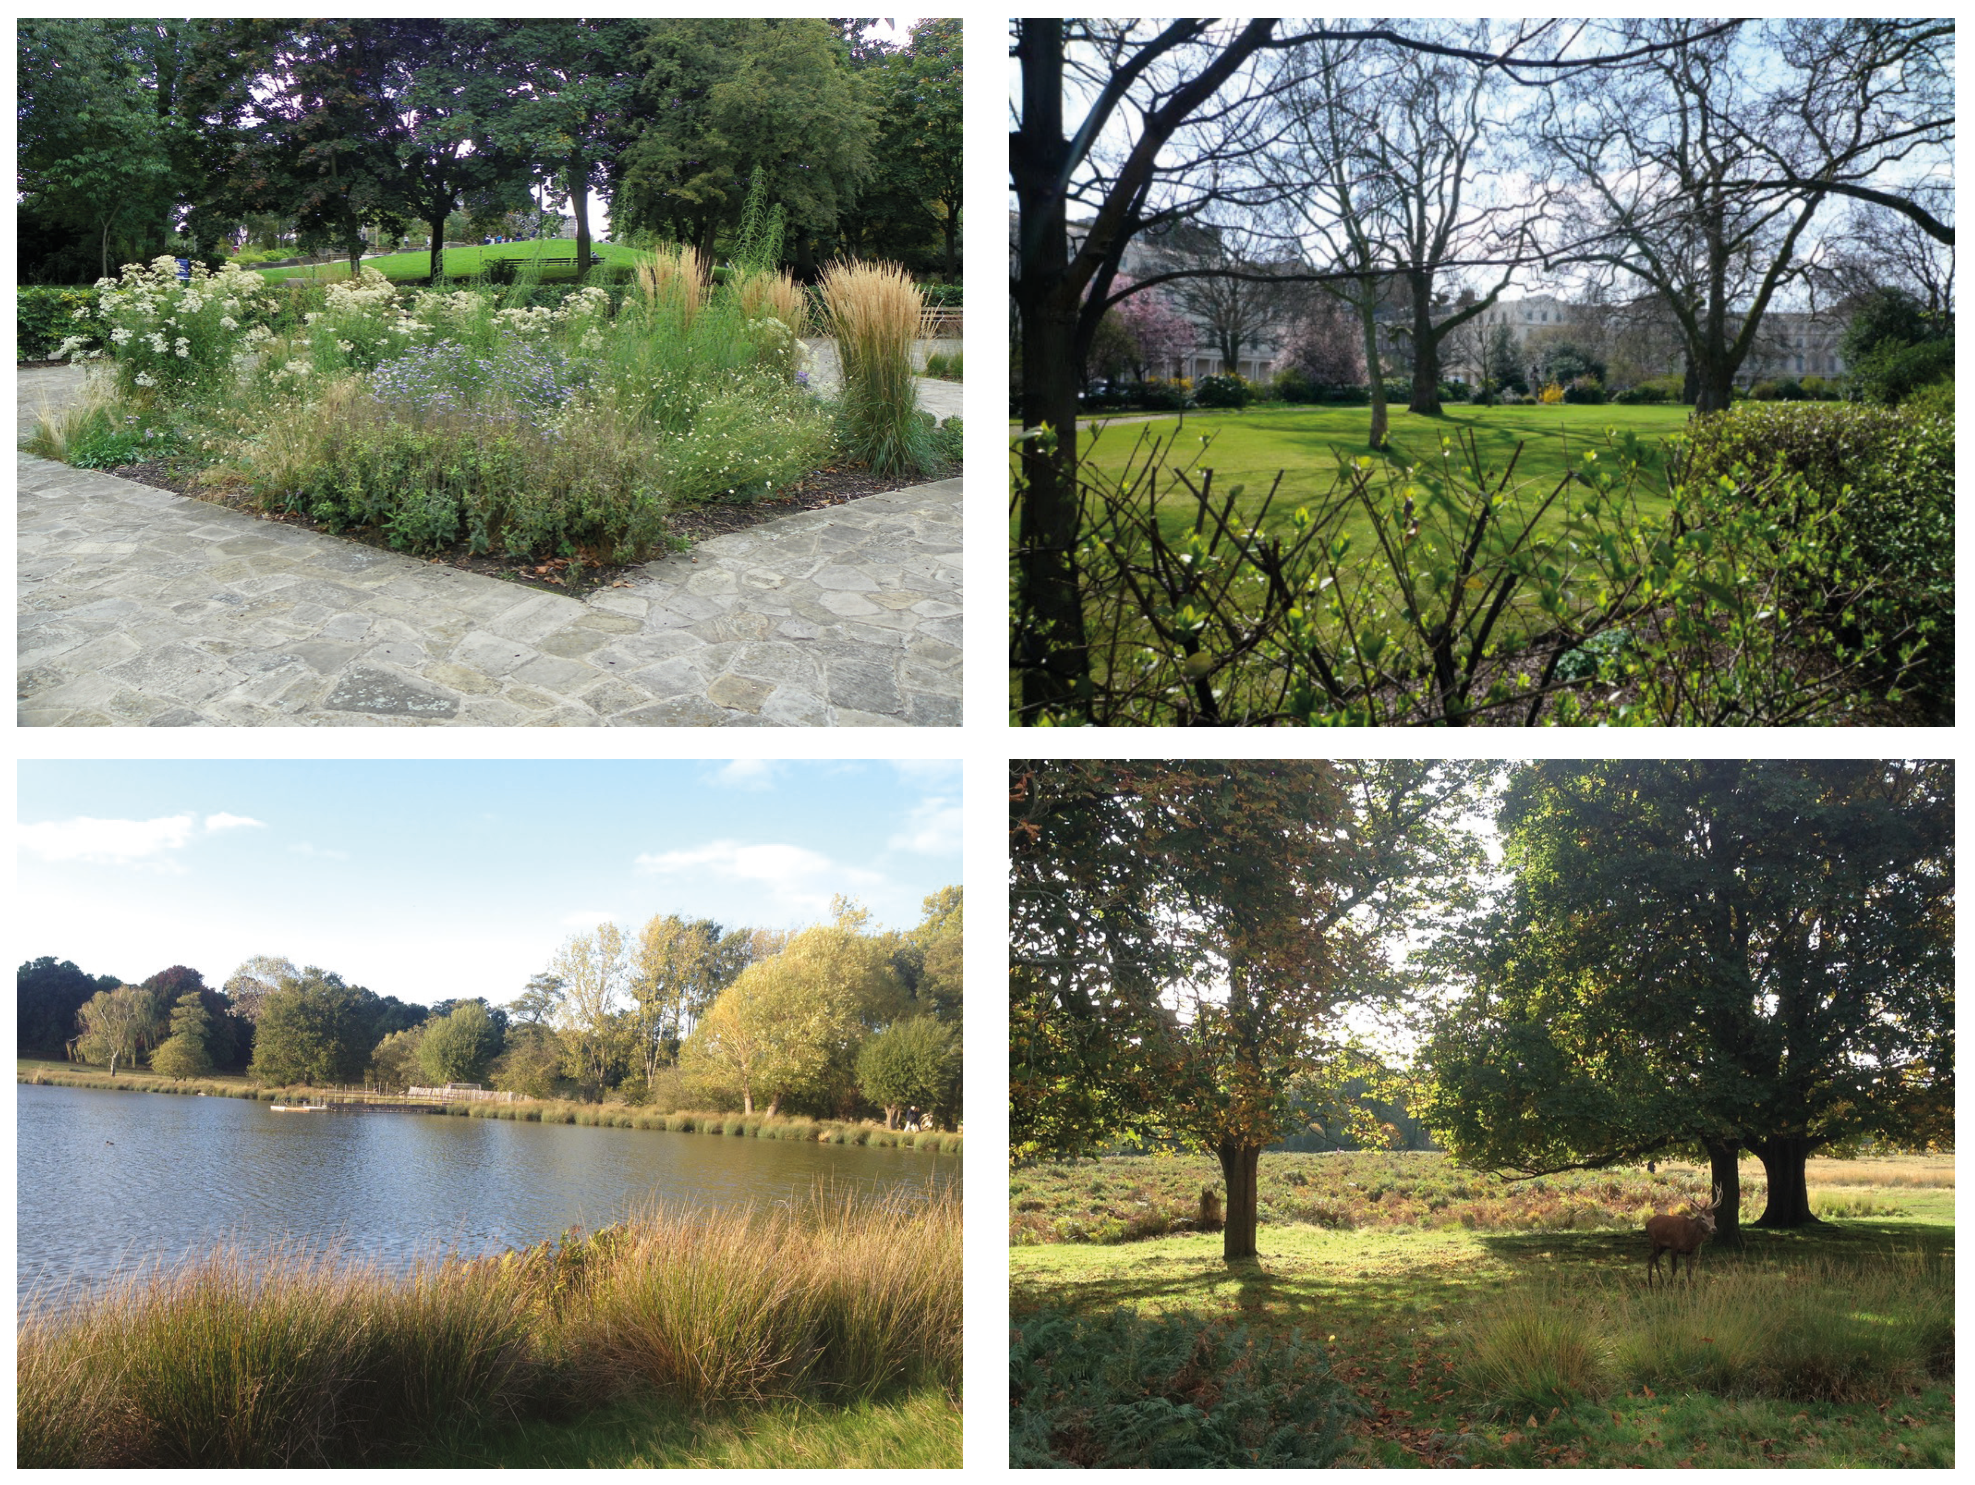
Figure 2(a): Fact file on London
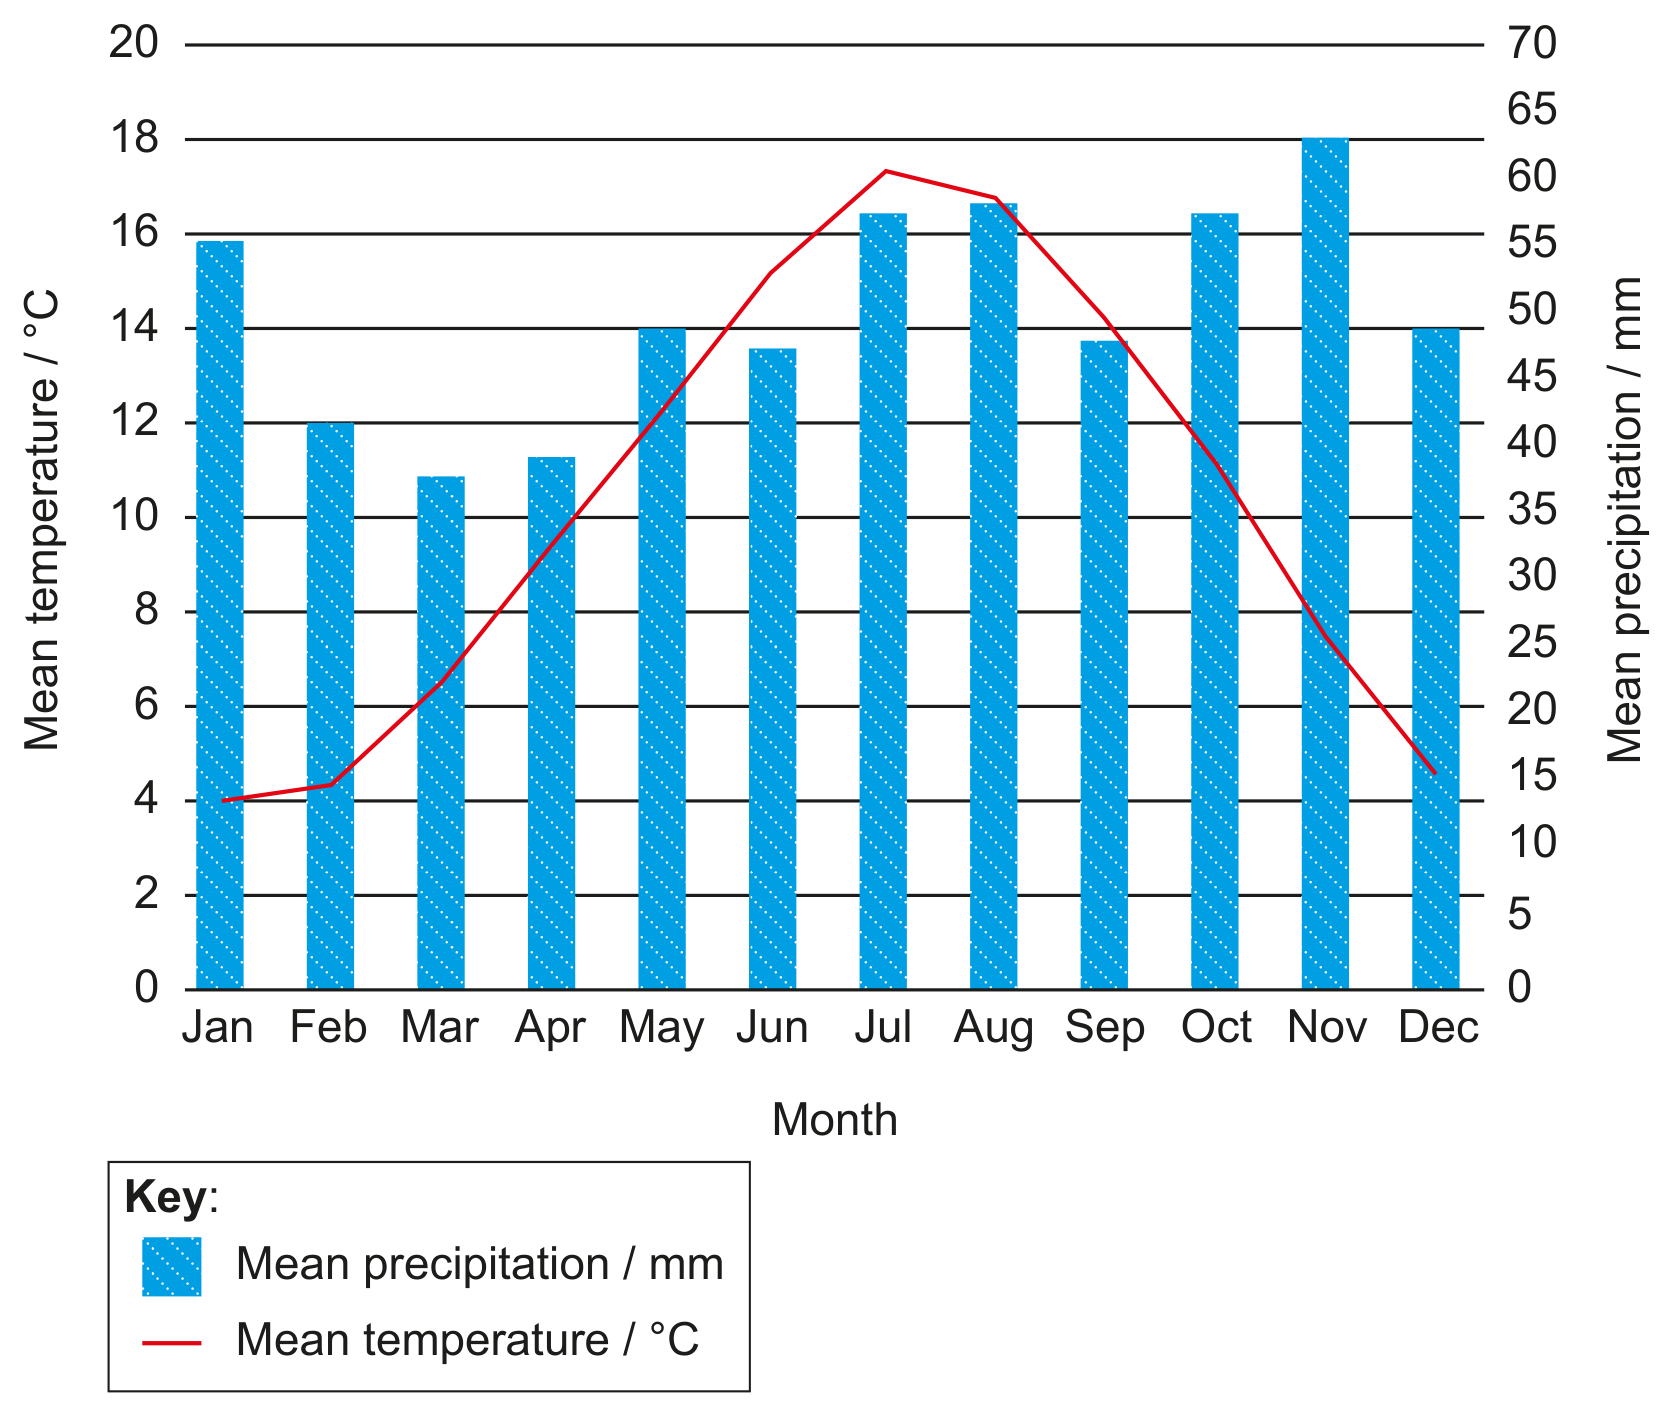
Figure 3: Climate graph for London
With reference to Figures 2(b) and 3, identify an ecosystem found in London.
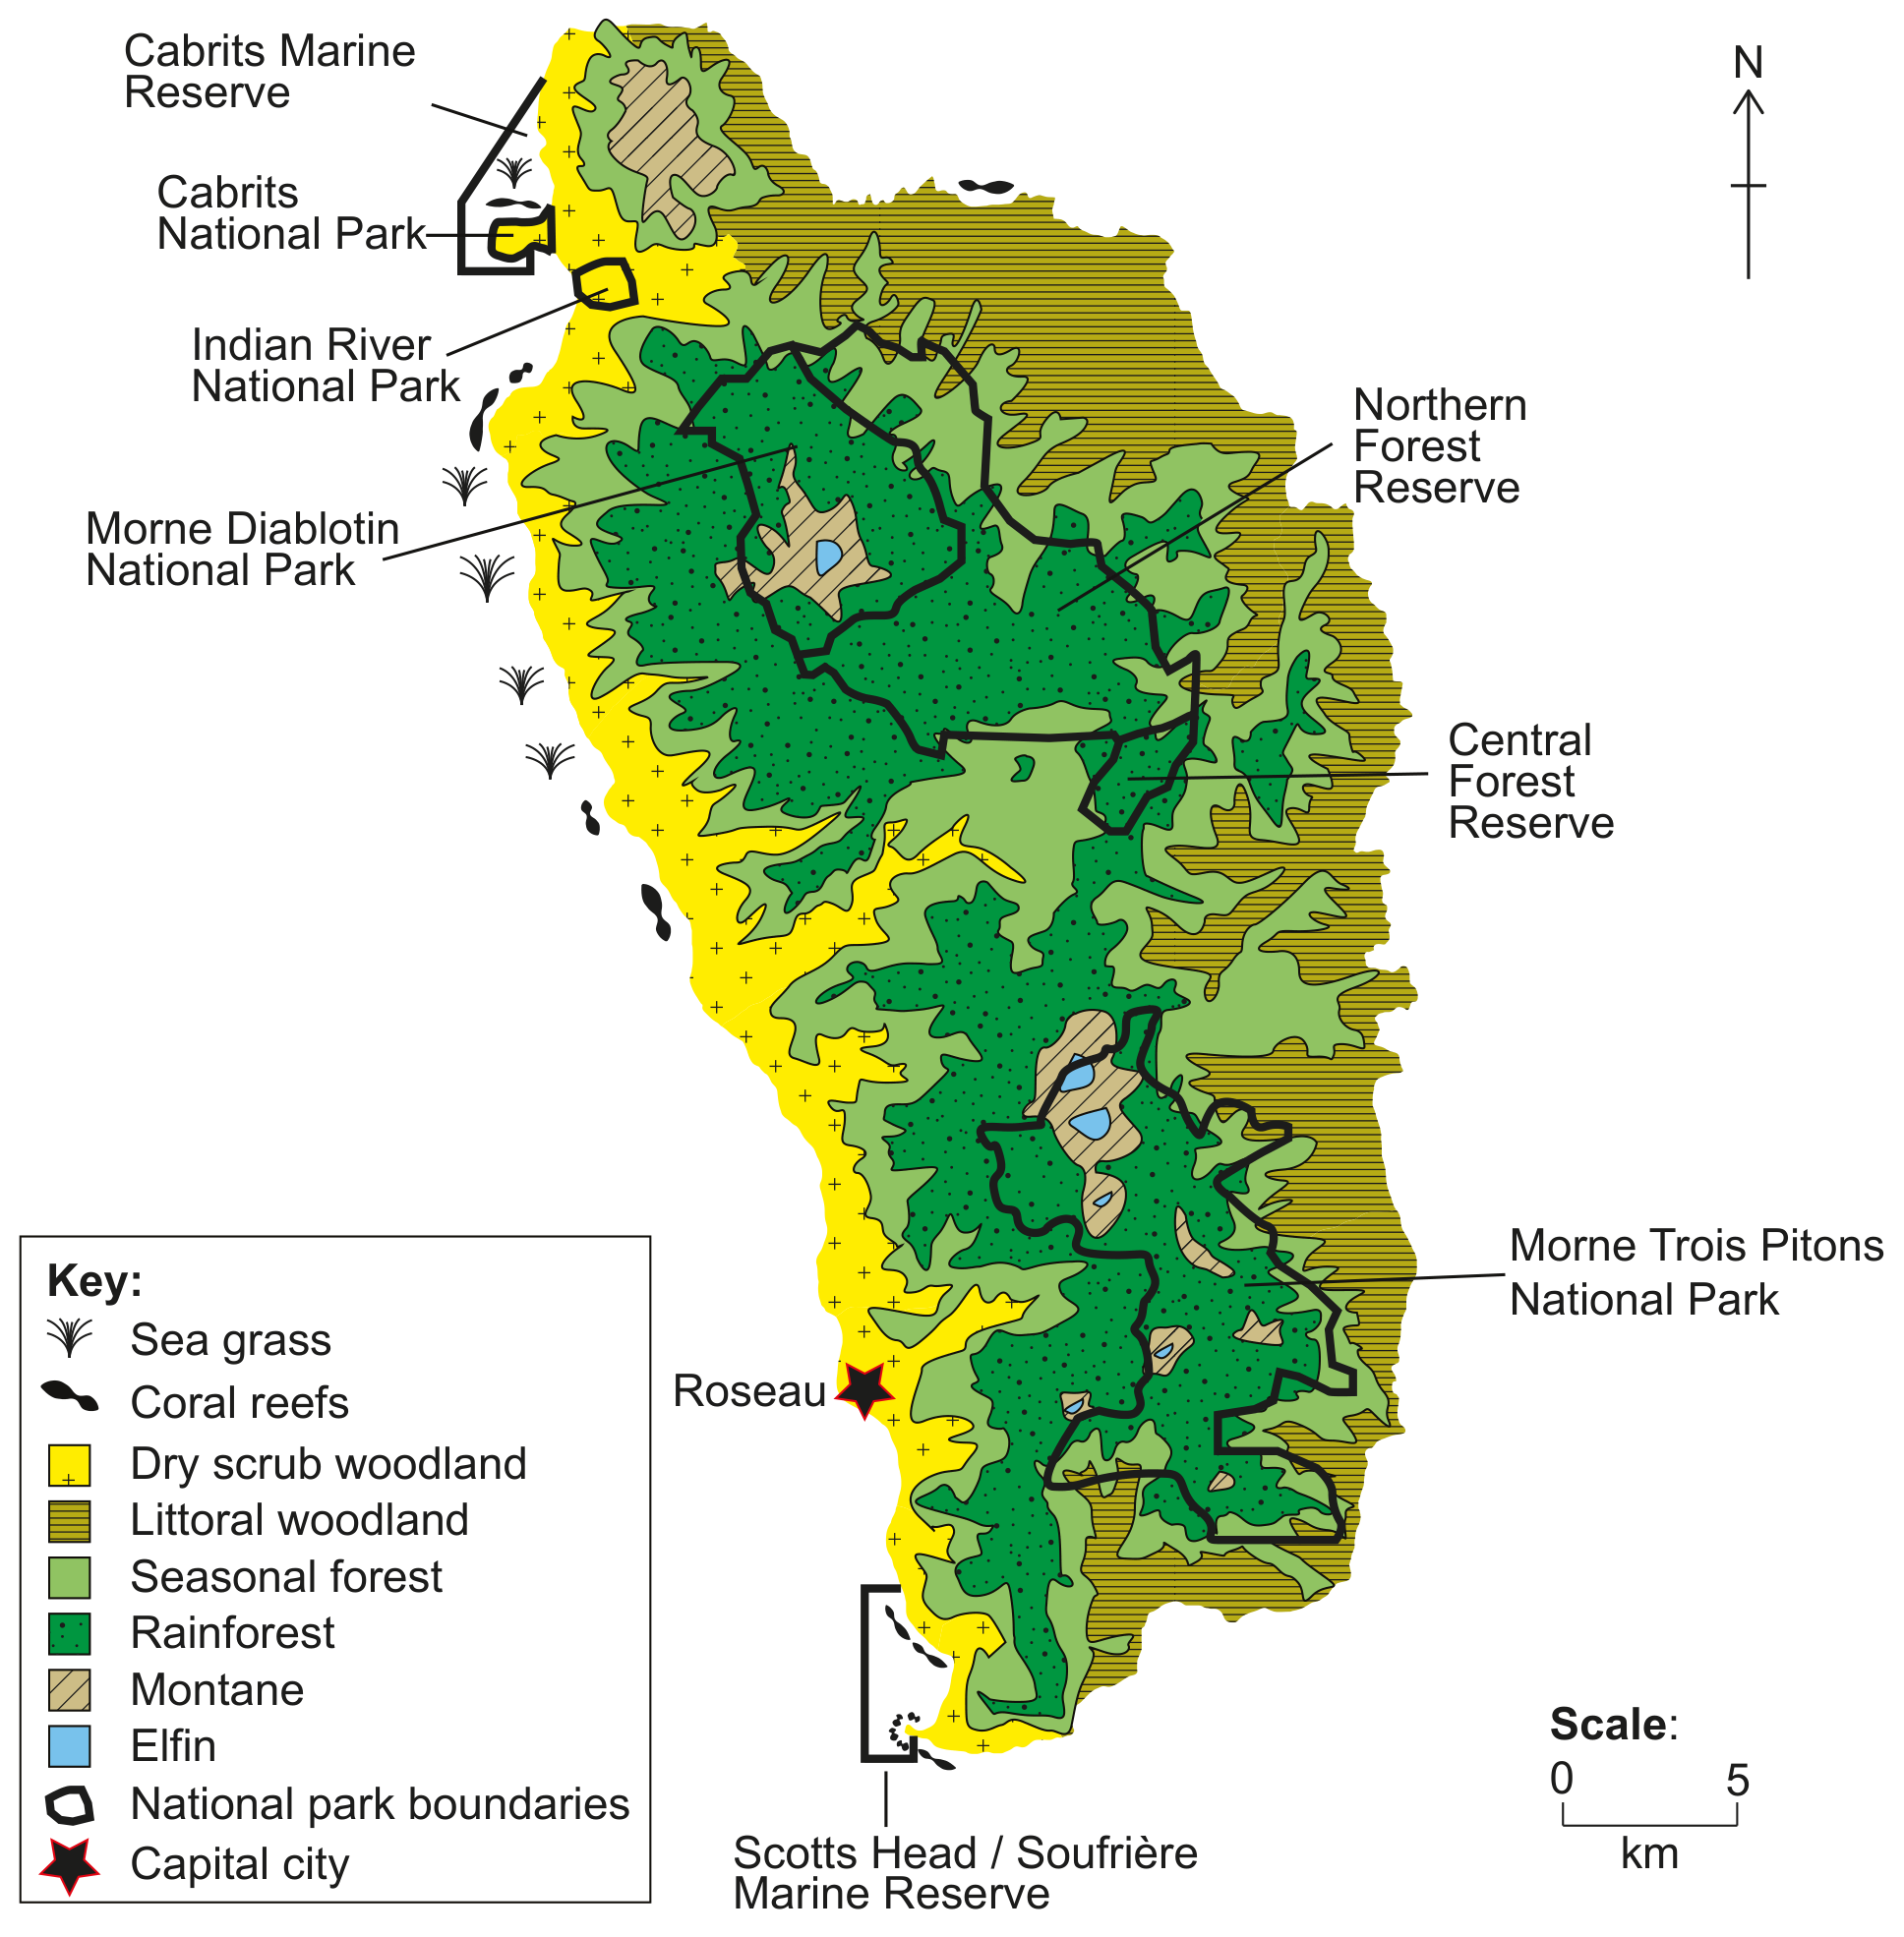
Figure 1(c): Ecosystems of Dominica
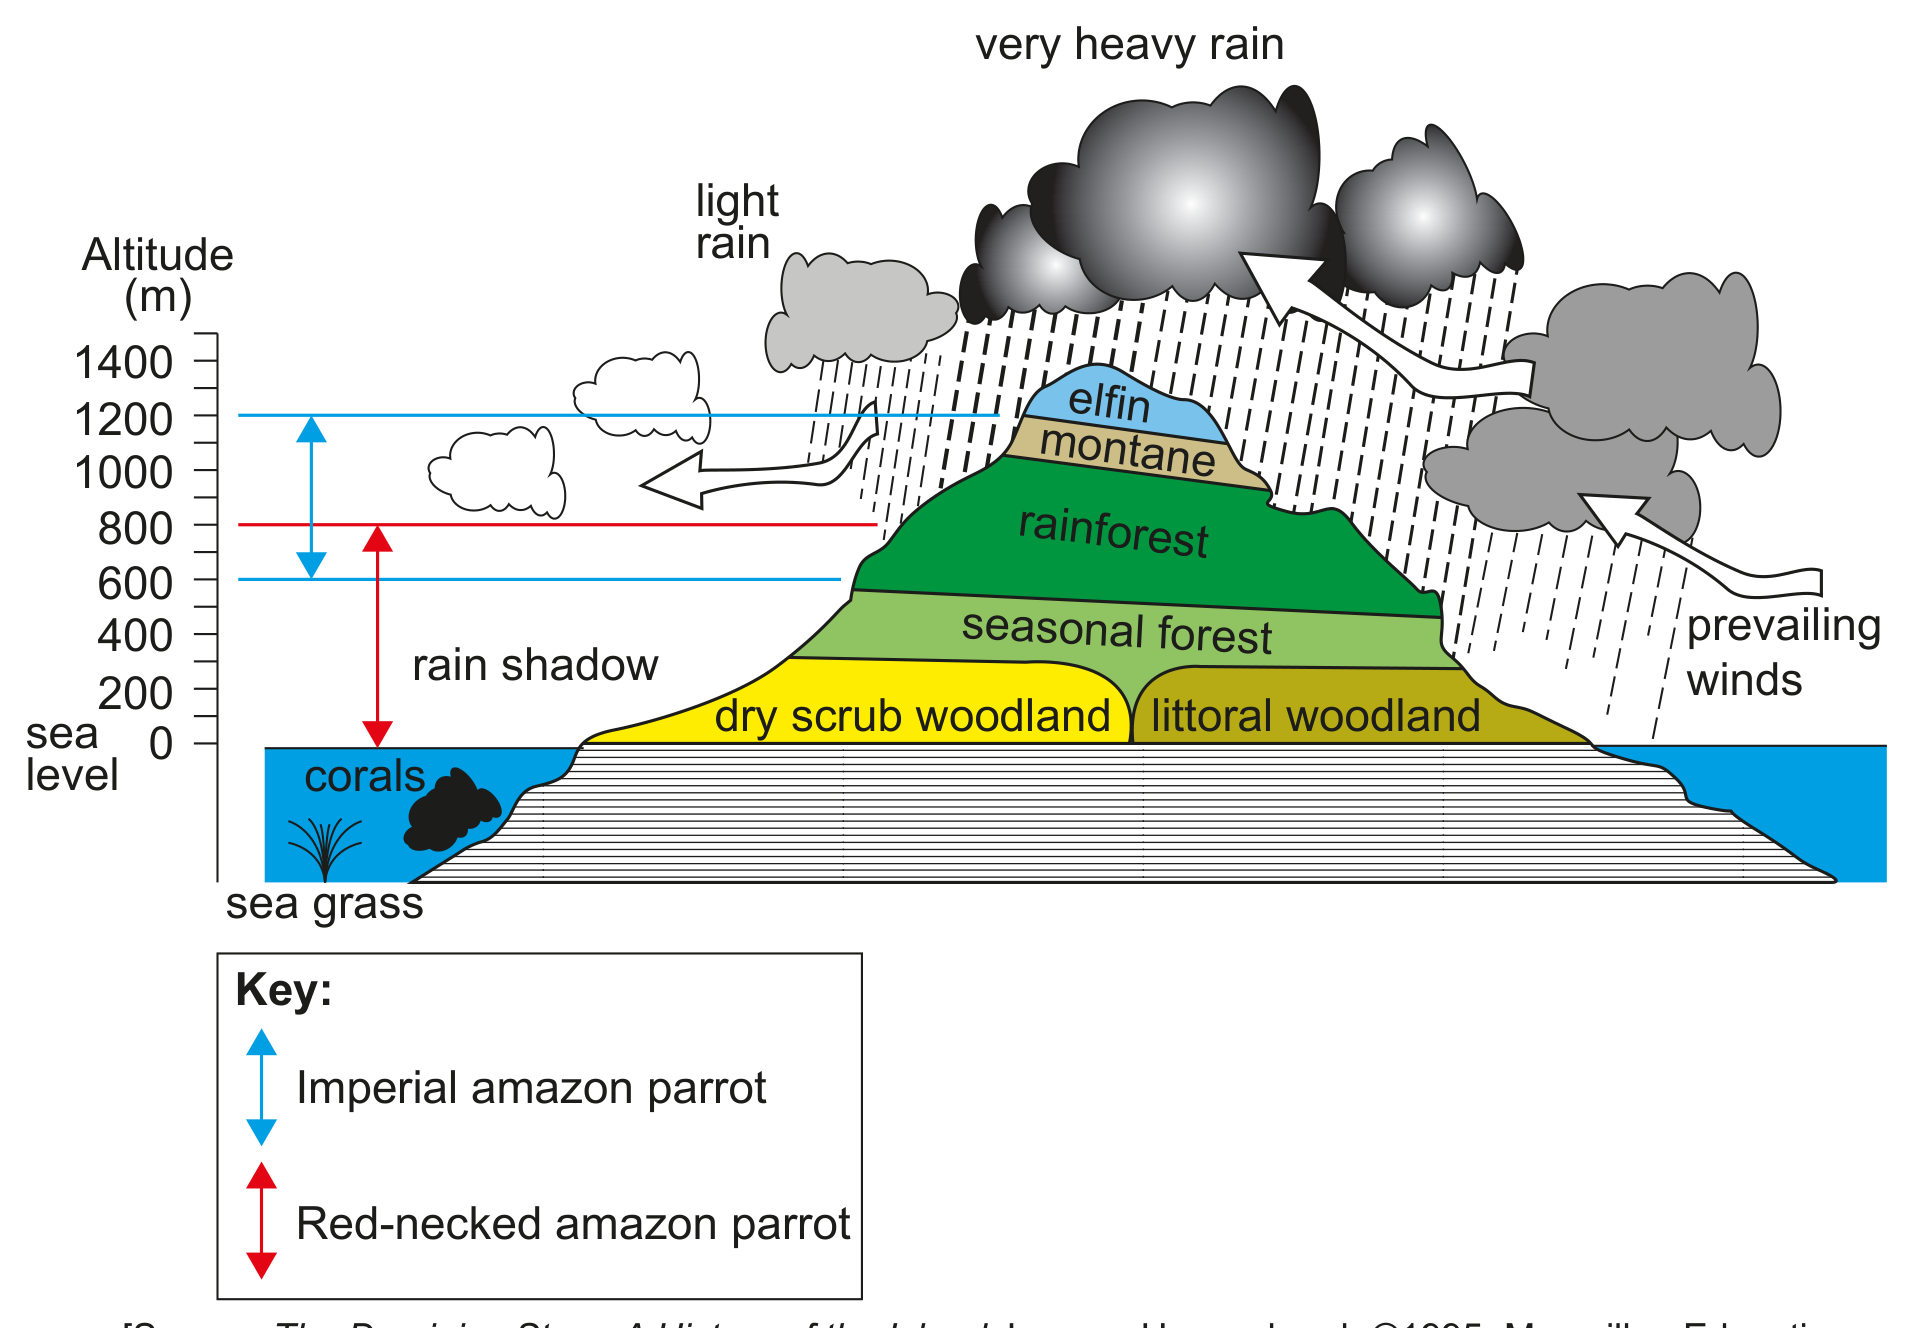
(Figure 1(c) continued) West
Using Figure 1(c), state one ecosystem found at sea level in Dominica.
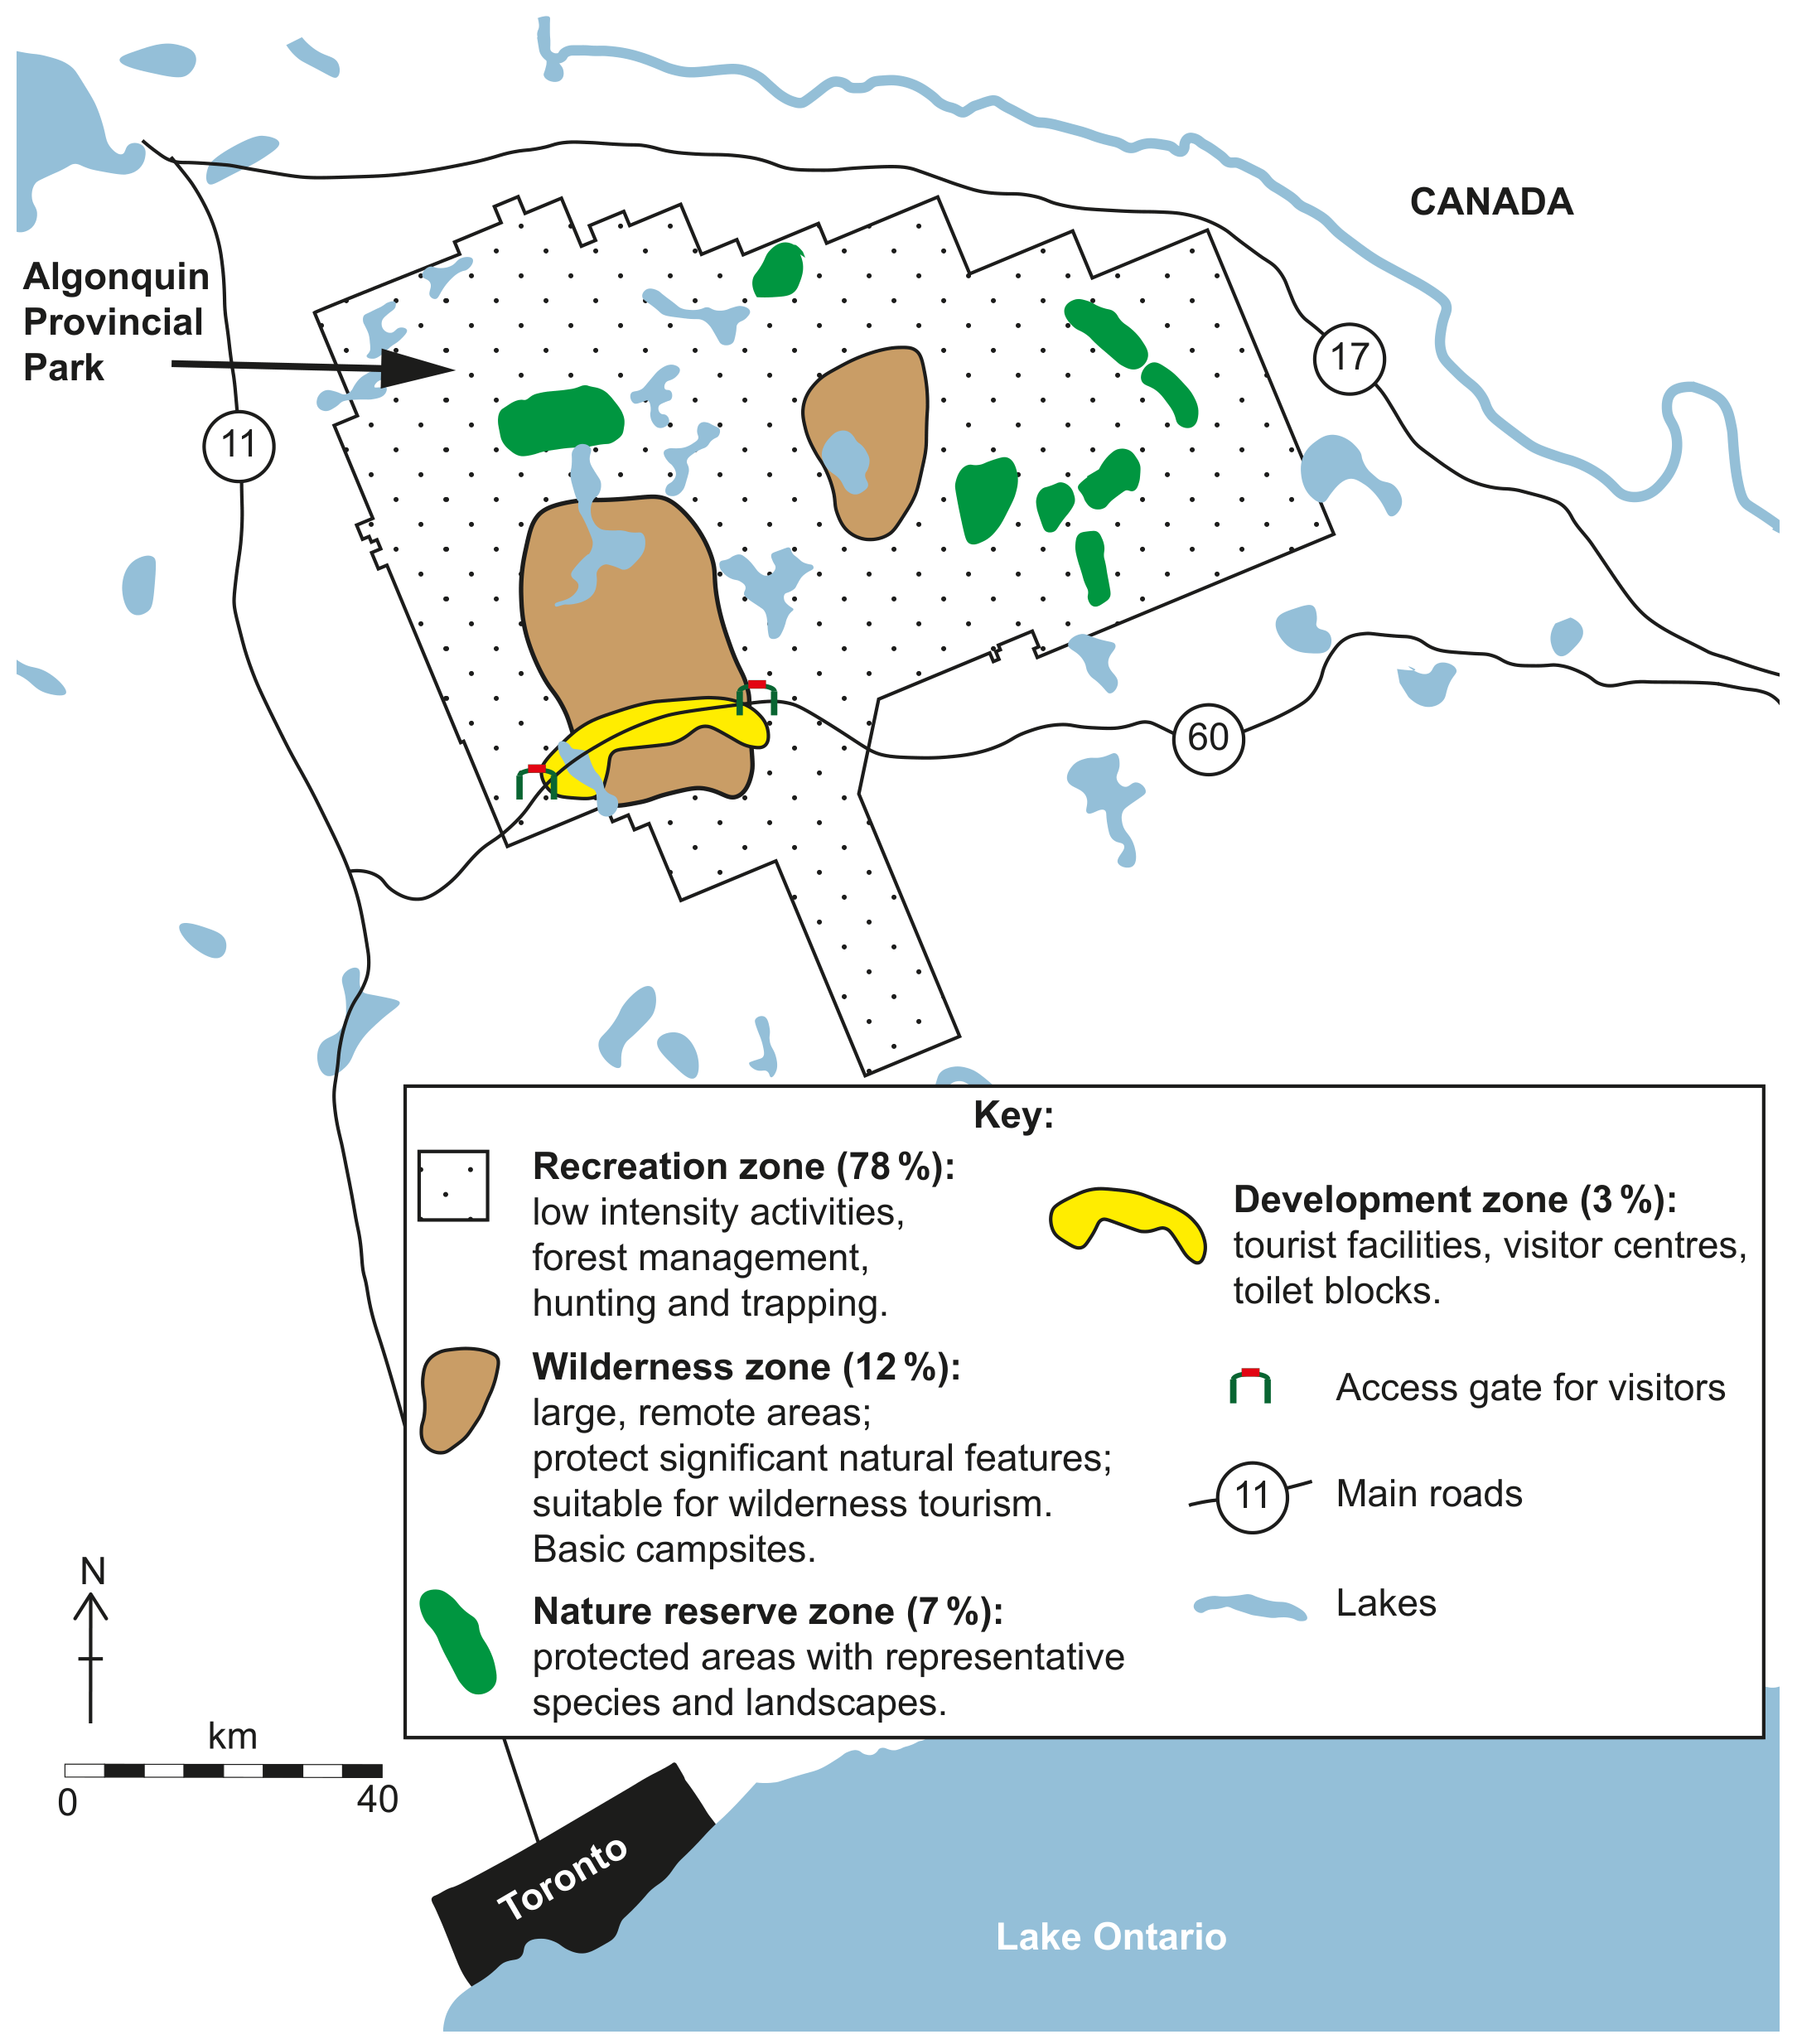
Figure 1(b): Map of Algonquin Provincial Park, Canada
Identify one ecosystem in Algonquin Provincial Park.
The concentration of DDT at different trophic levels of the food chain.
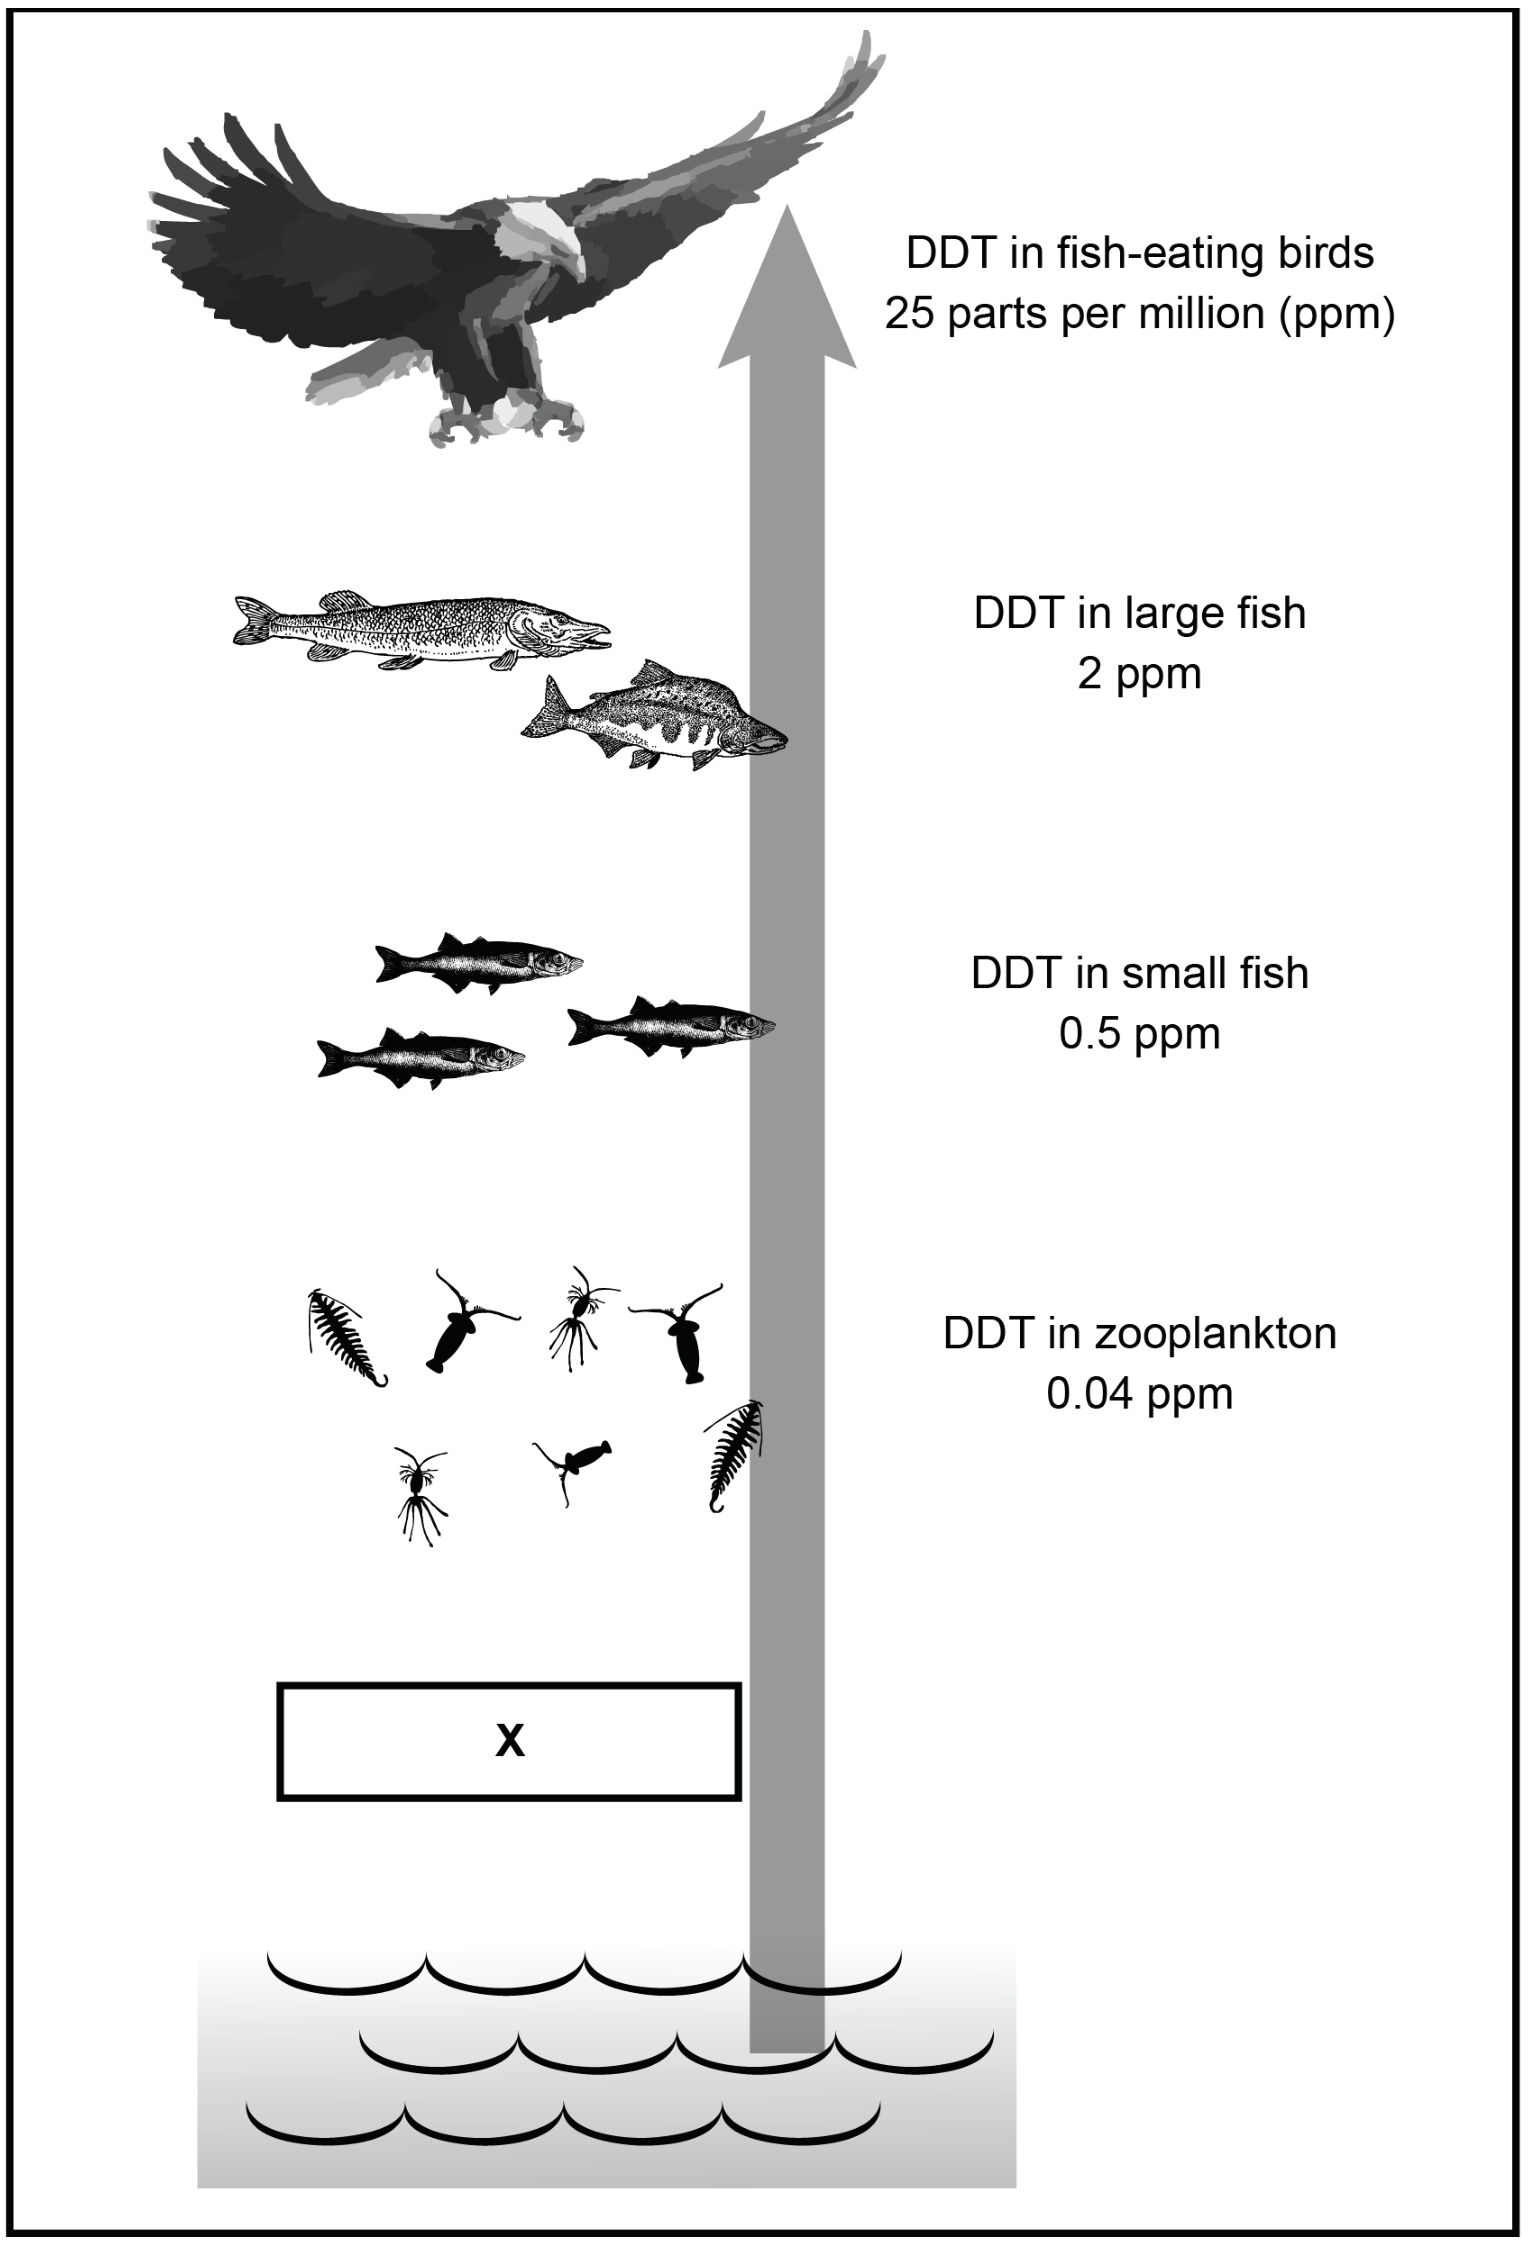
Figure 1: Levels of concentration of DDT in food chain
State the relationship between large and small fish in Figure 1.
Outline how this relationship may be of benefit to the populations of both species.
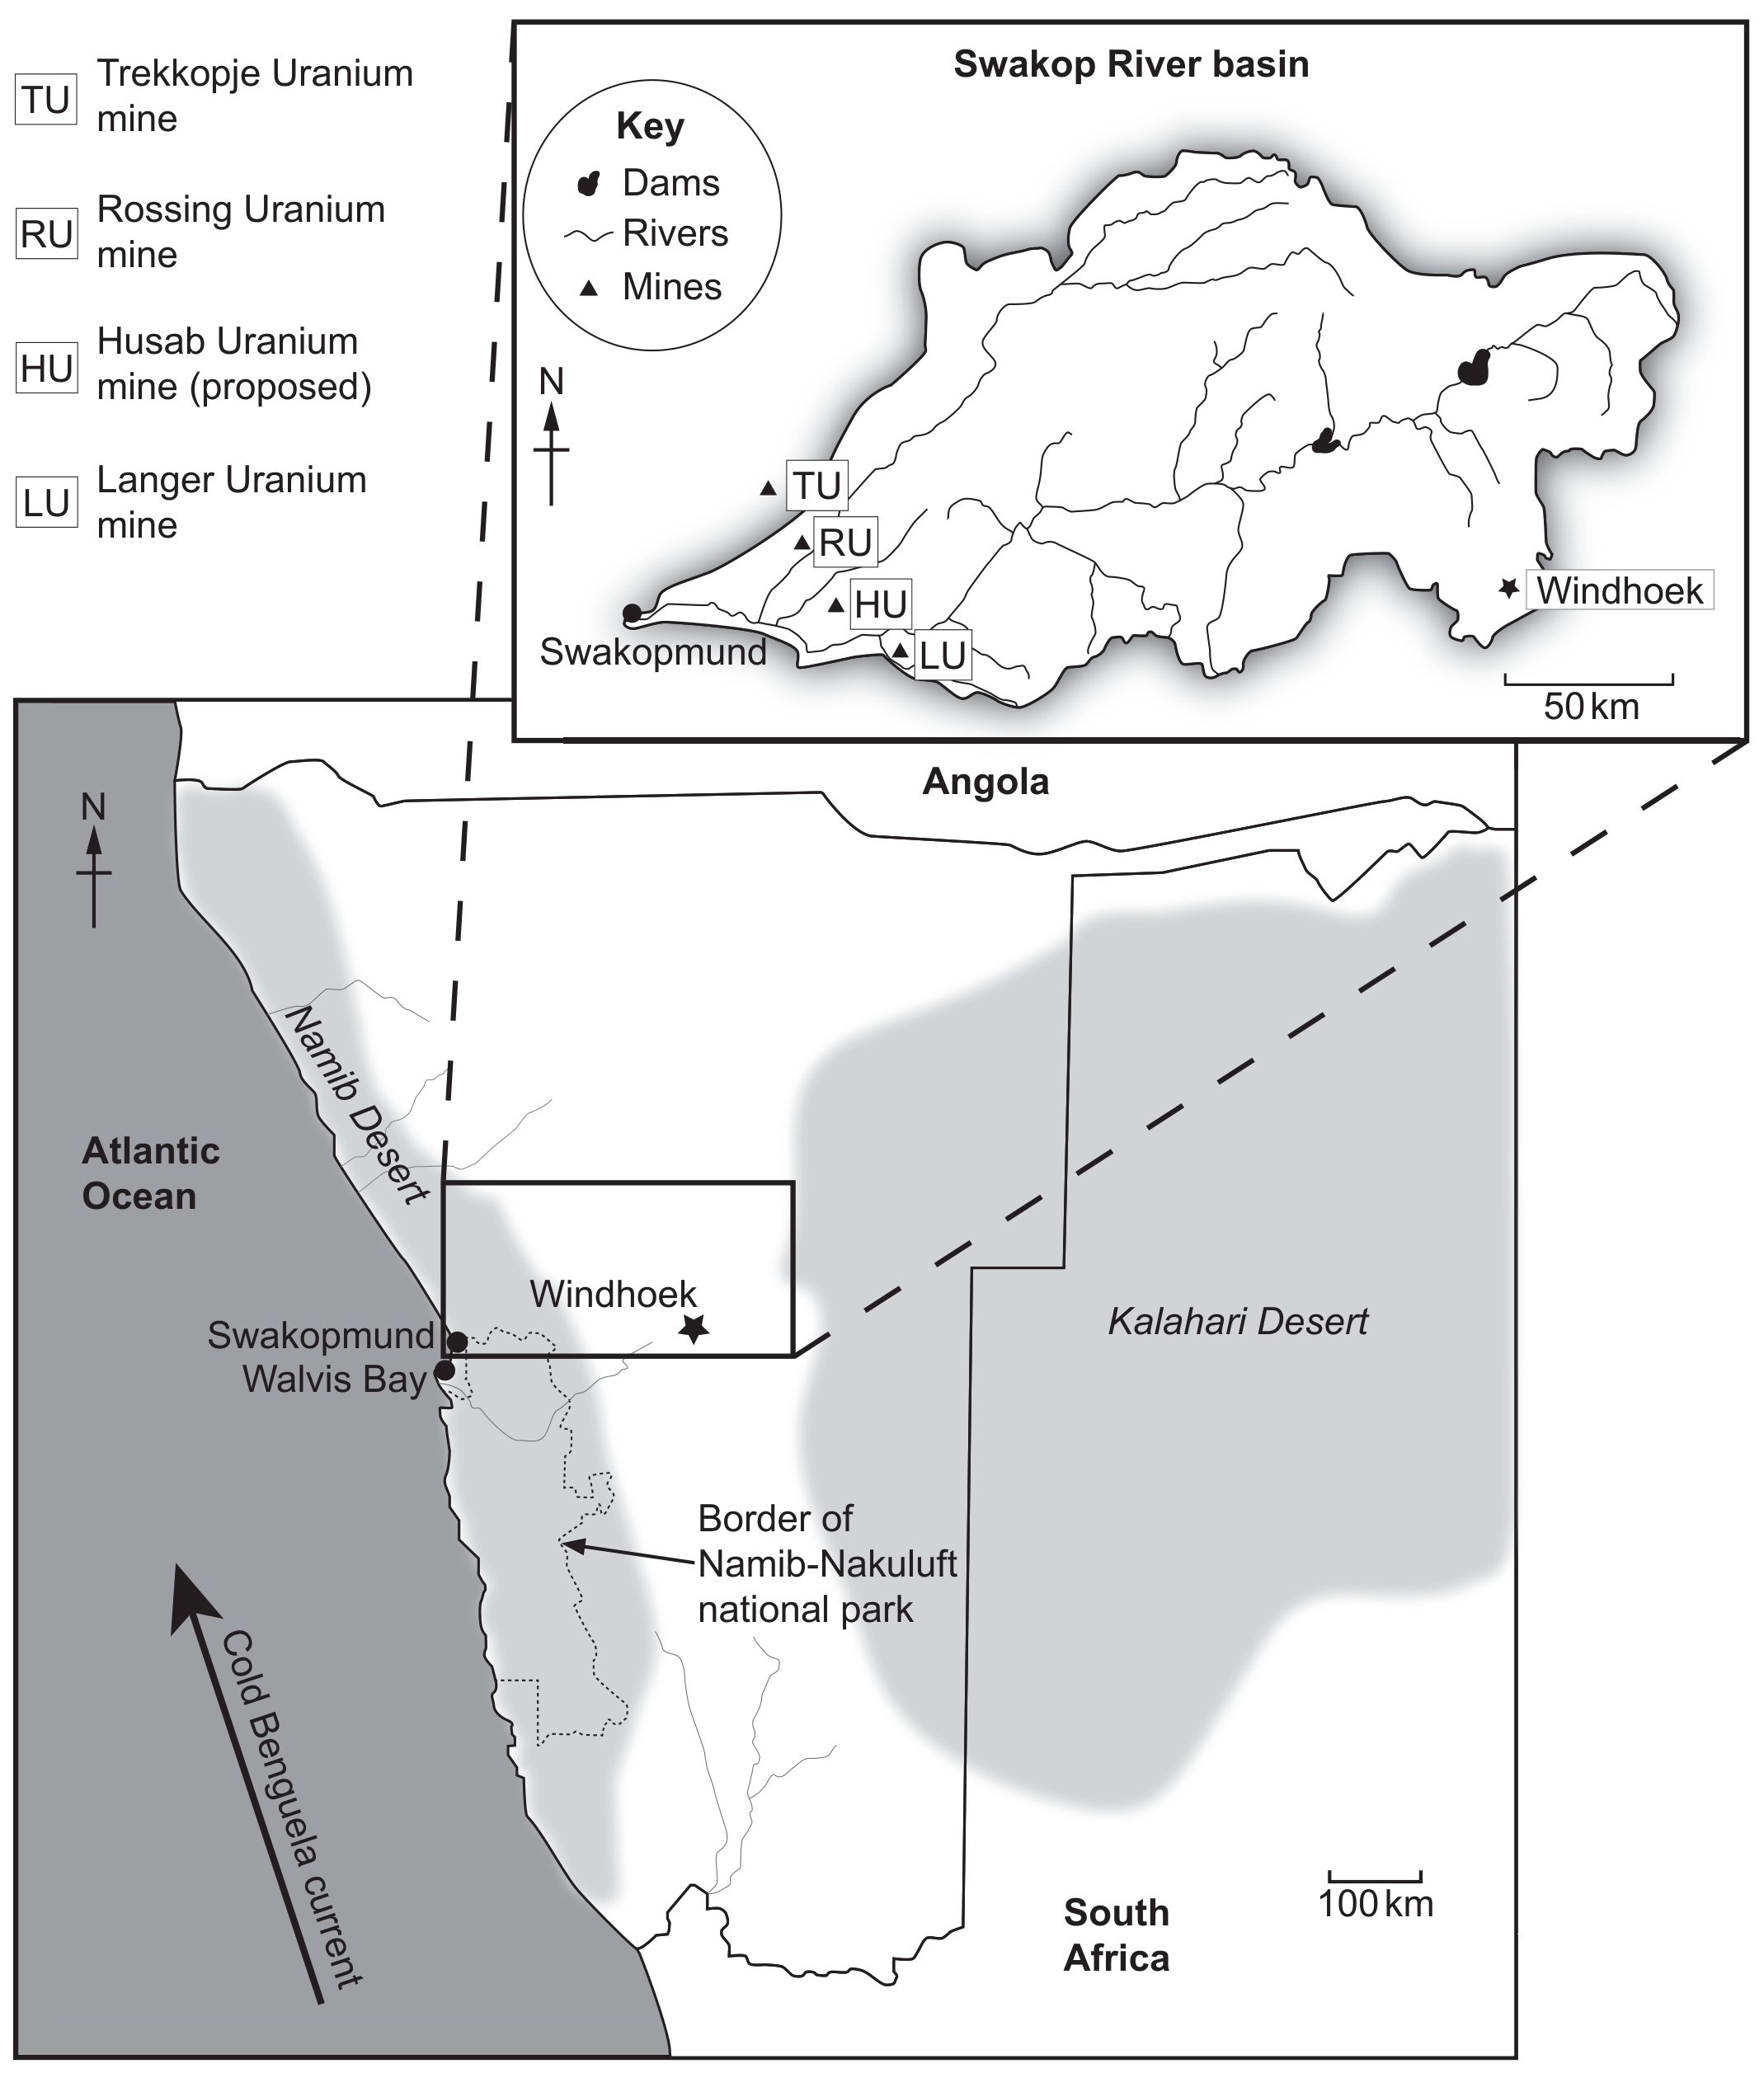
Figure 1(b): Map showing Swakop River in Namibia
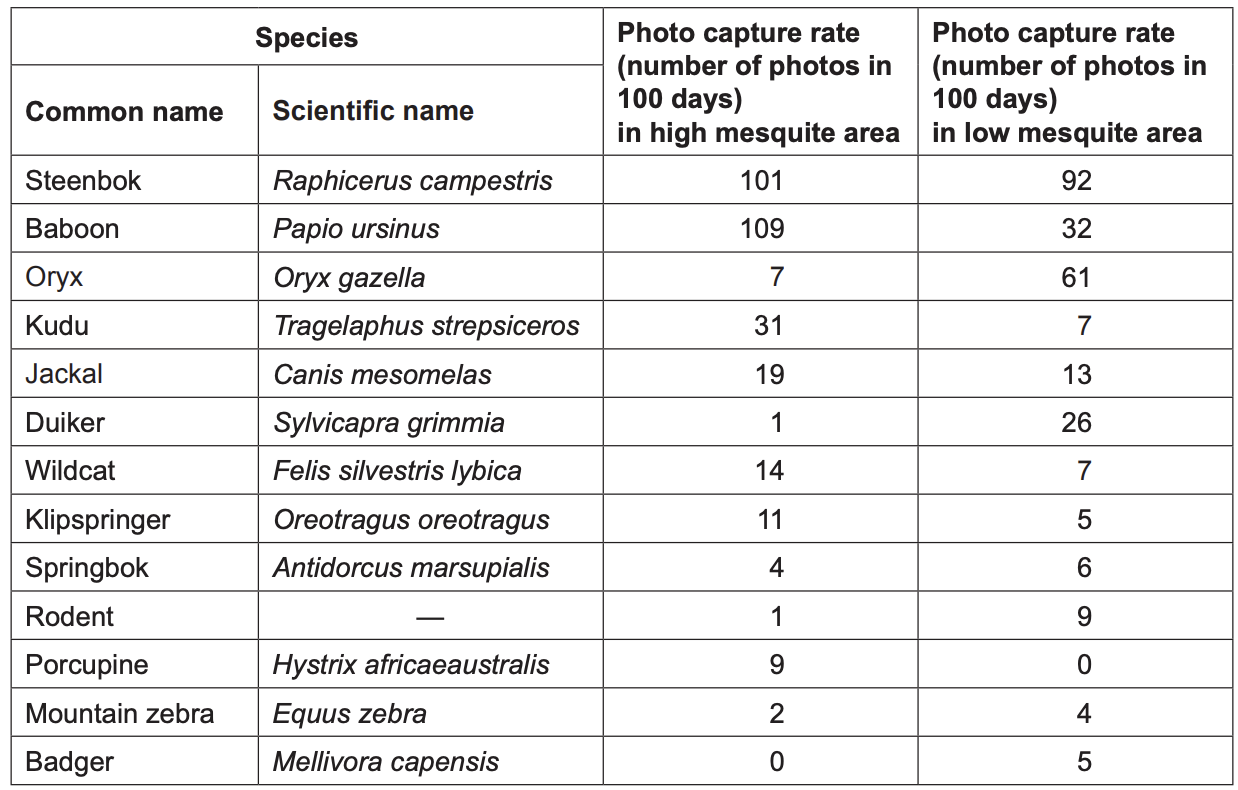
Figure 4(b): Camera trap data for high and low mesquite areas
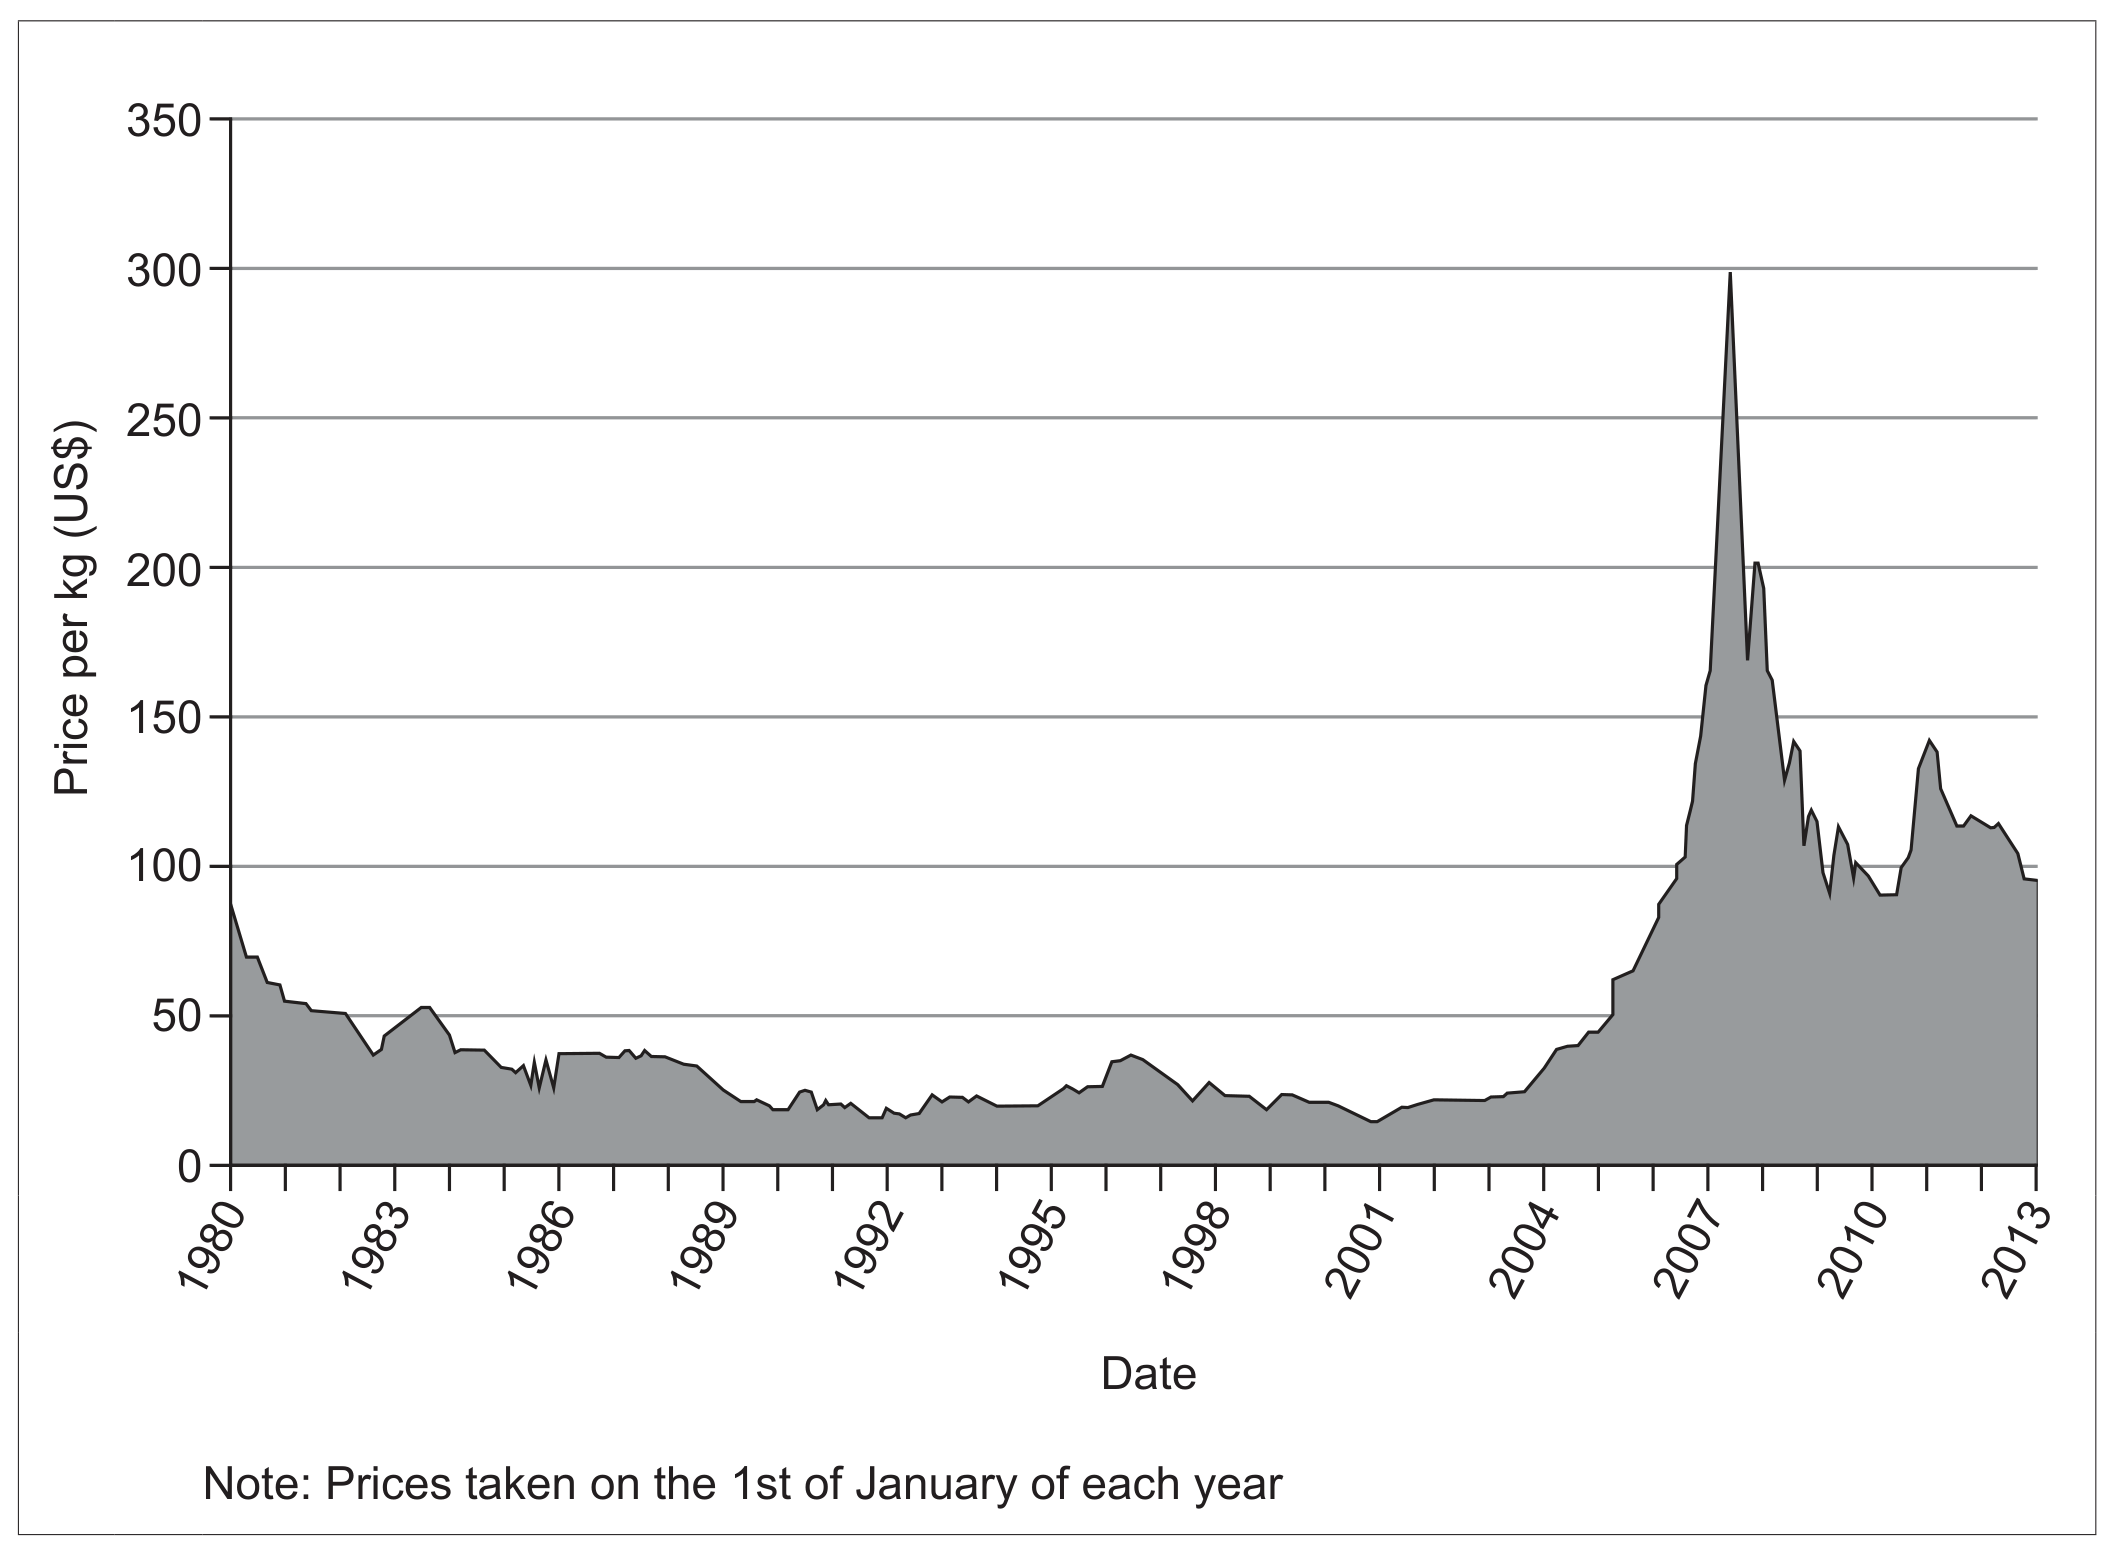
Figure 5(a): Uranium prices from 1980 to 2013
Outline two reasons why the Swakop river is considered to be ecologically important.
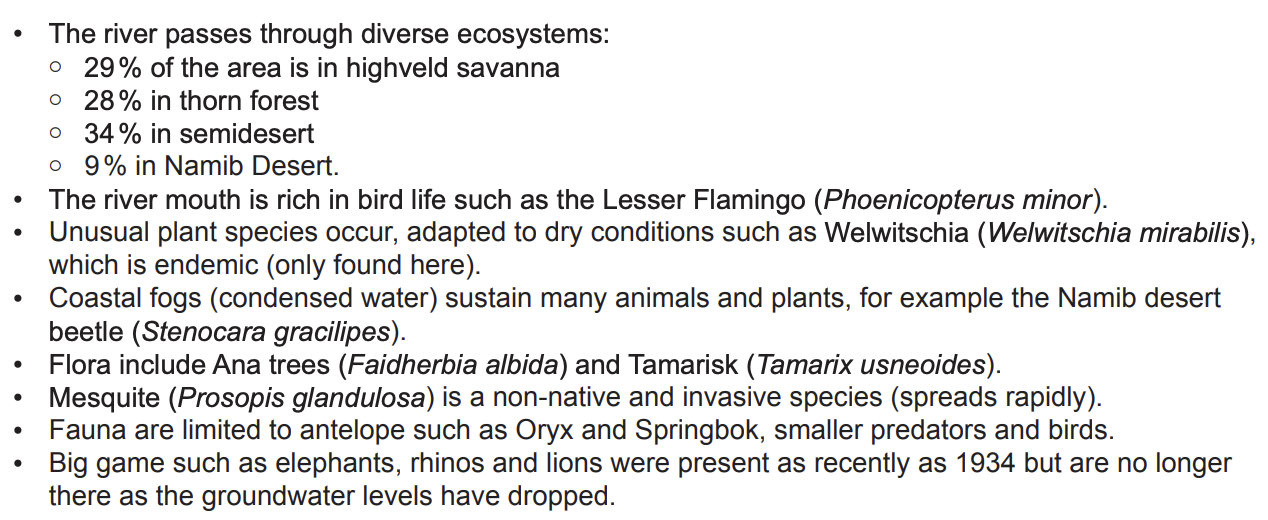
Figure 3(a): Ecological features of Swakop River Valley
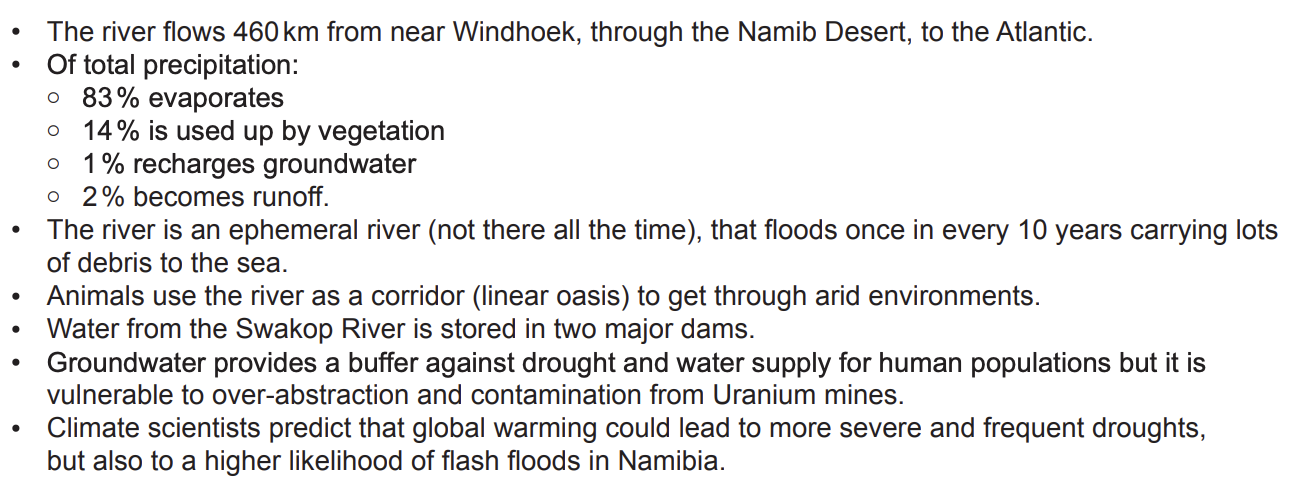
Figure 3(c): Fact file on the Swakop water resources
With reference to the data in Figure 4(b), suggest two conclusions which can be drawn from the camera trap data.
Define the term species.
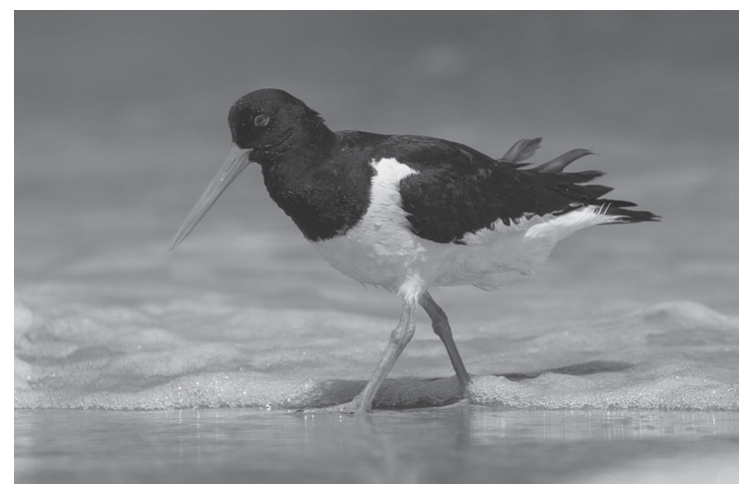
The four species shown in Figure 1 can be found in wetland ecosystems.

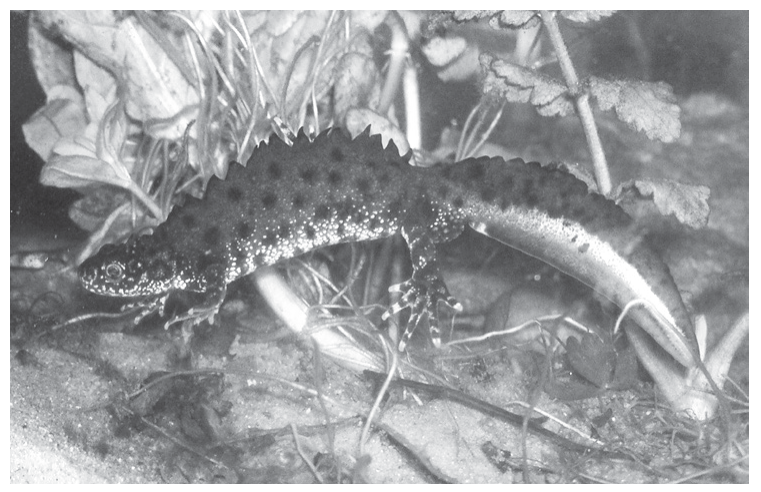
Crested Newt (Triturus cristatus)
newt\#/media/File:Kammmolchmaennchen.jpg, by Rainer Theuer]
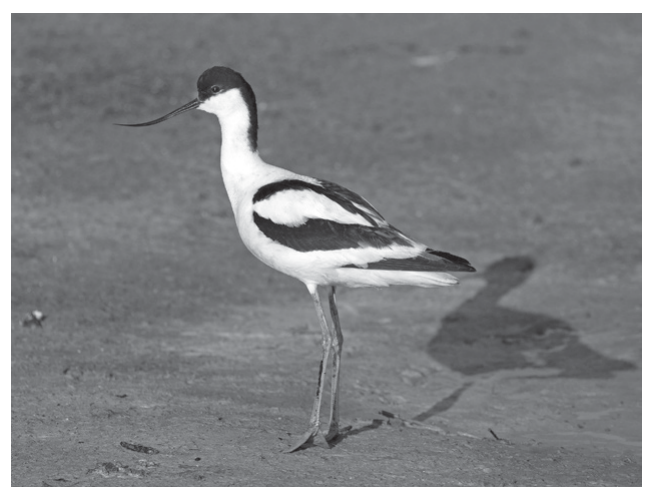
Avocet (Recurvirostra avosetta)
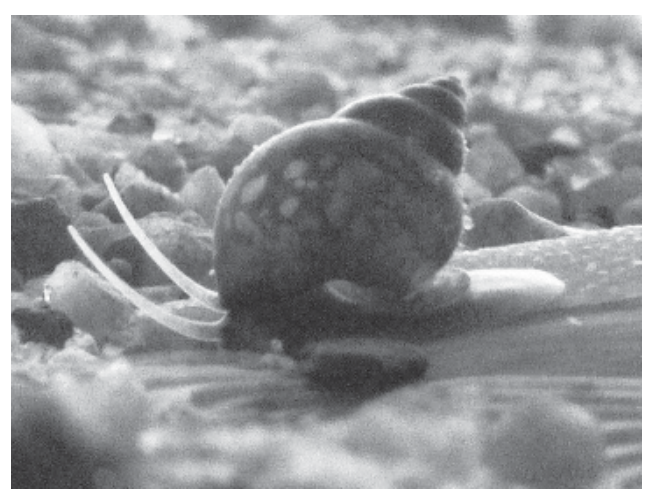
Bithynia (Bithynia tentaculata)
media/File:Bithynia_tentaculata.jpg, by Michal Maňas]
Construct a classification key to identify these animals by entering appropriate contrasting features and the names of the organisms to complete the table below:
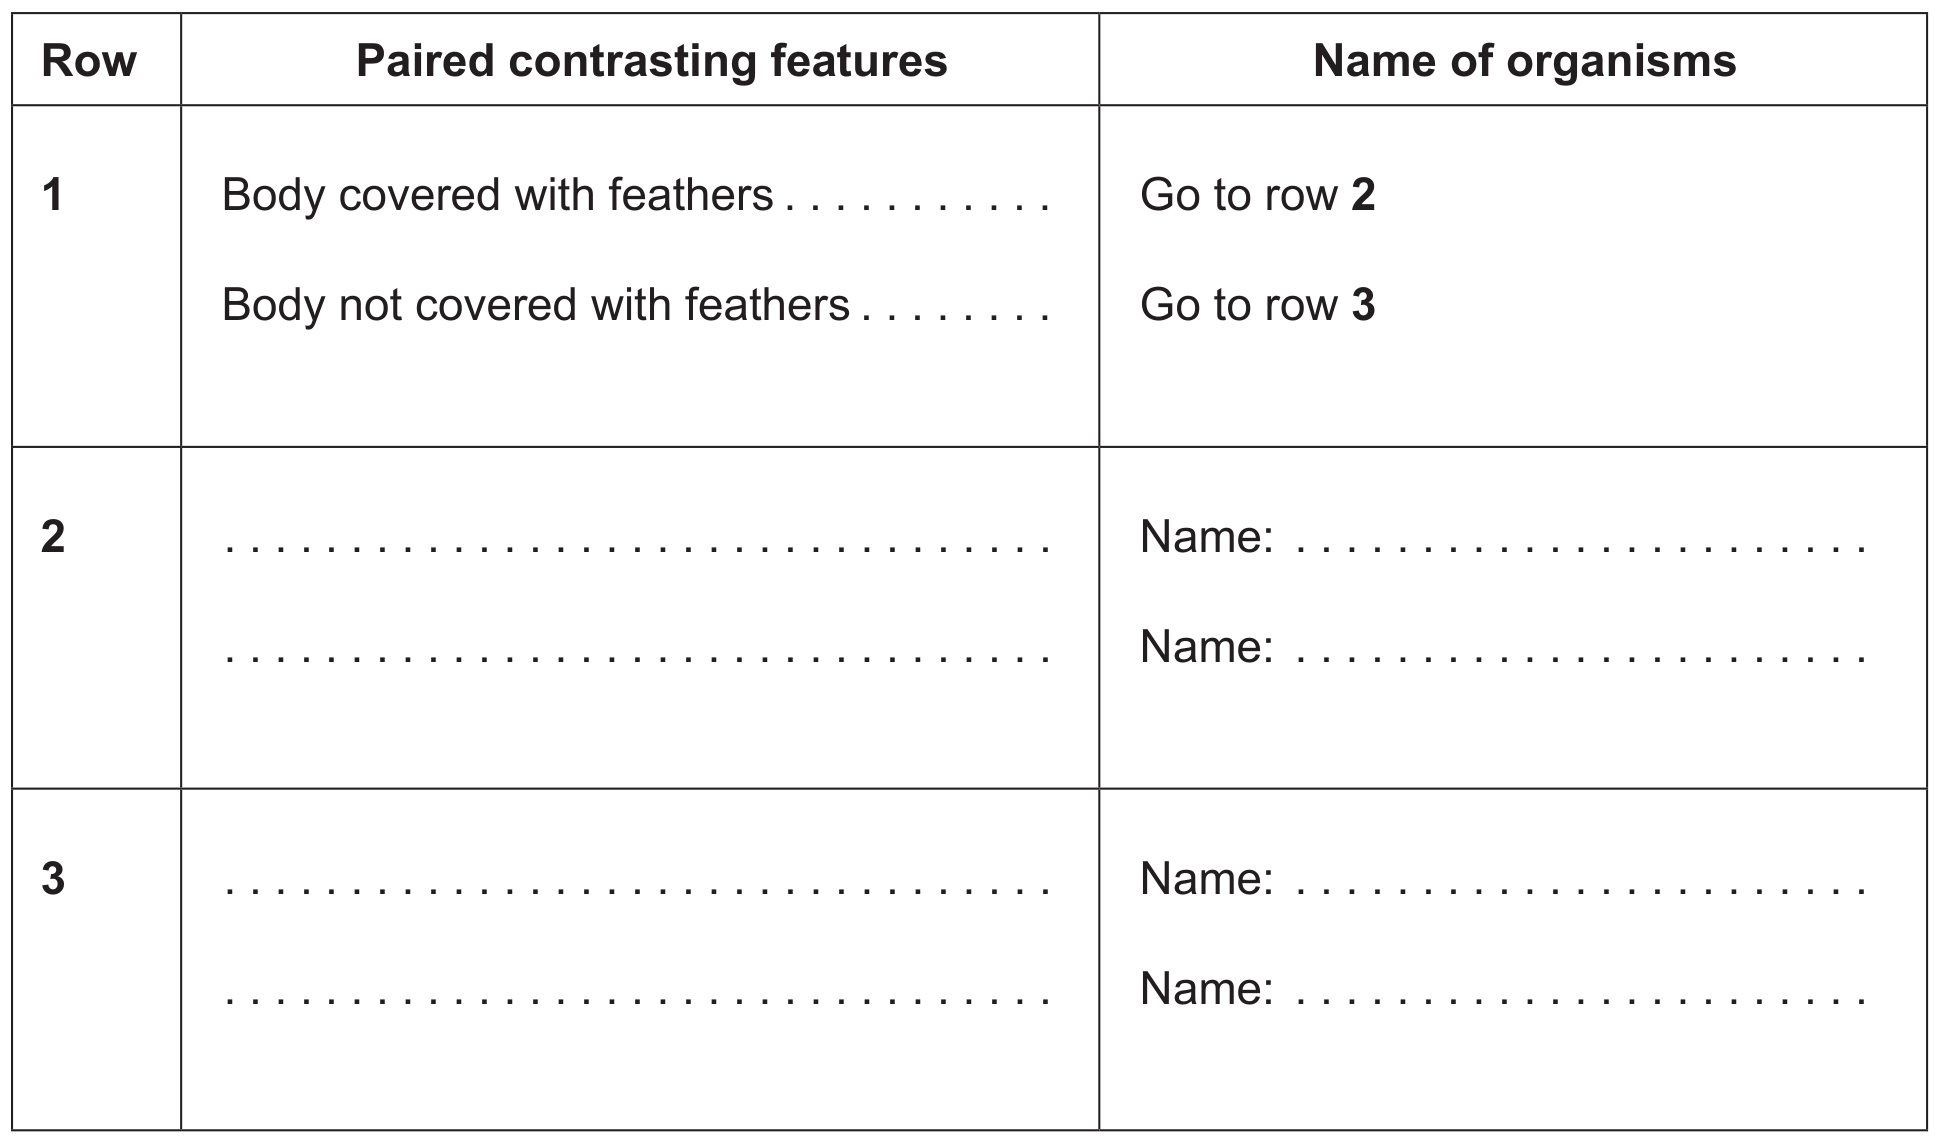
State one limitation of using a key to identify organisms.
Avocets, seen in Figure 2, often gather in large populations of up to a few thousand birds before migrating.
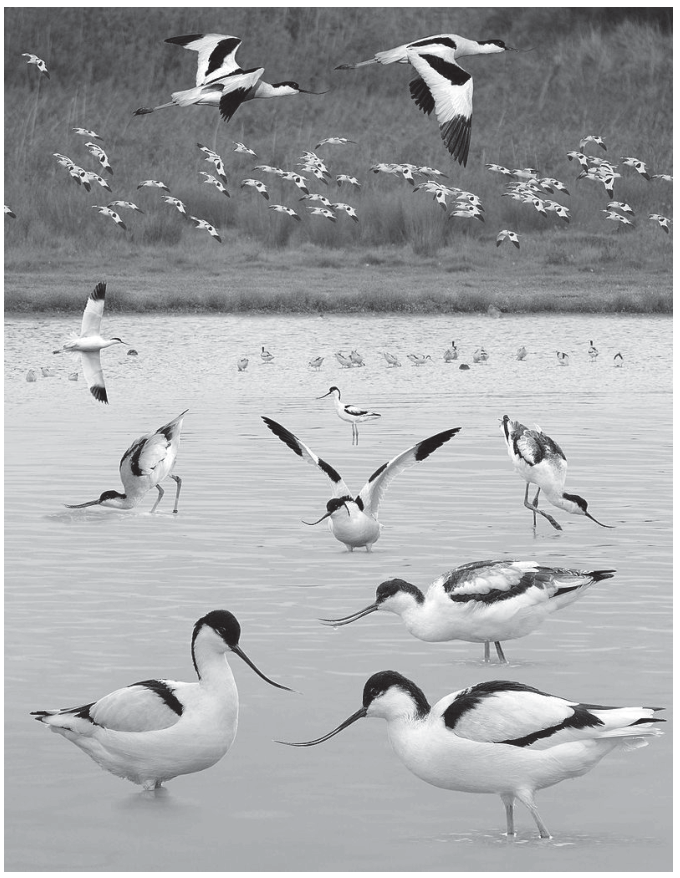
Figure 2
Describe a method to estimate the size of an avocet population.
Oystercatchers and avocets both feed on small animals in the mud of the wetlands. State the most likely relationship between these two species.
Estimate the number of people in the 15 to 19 age group in the population pyramid in Figure 3.
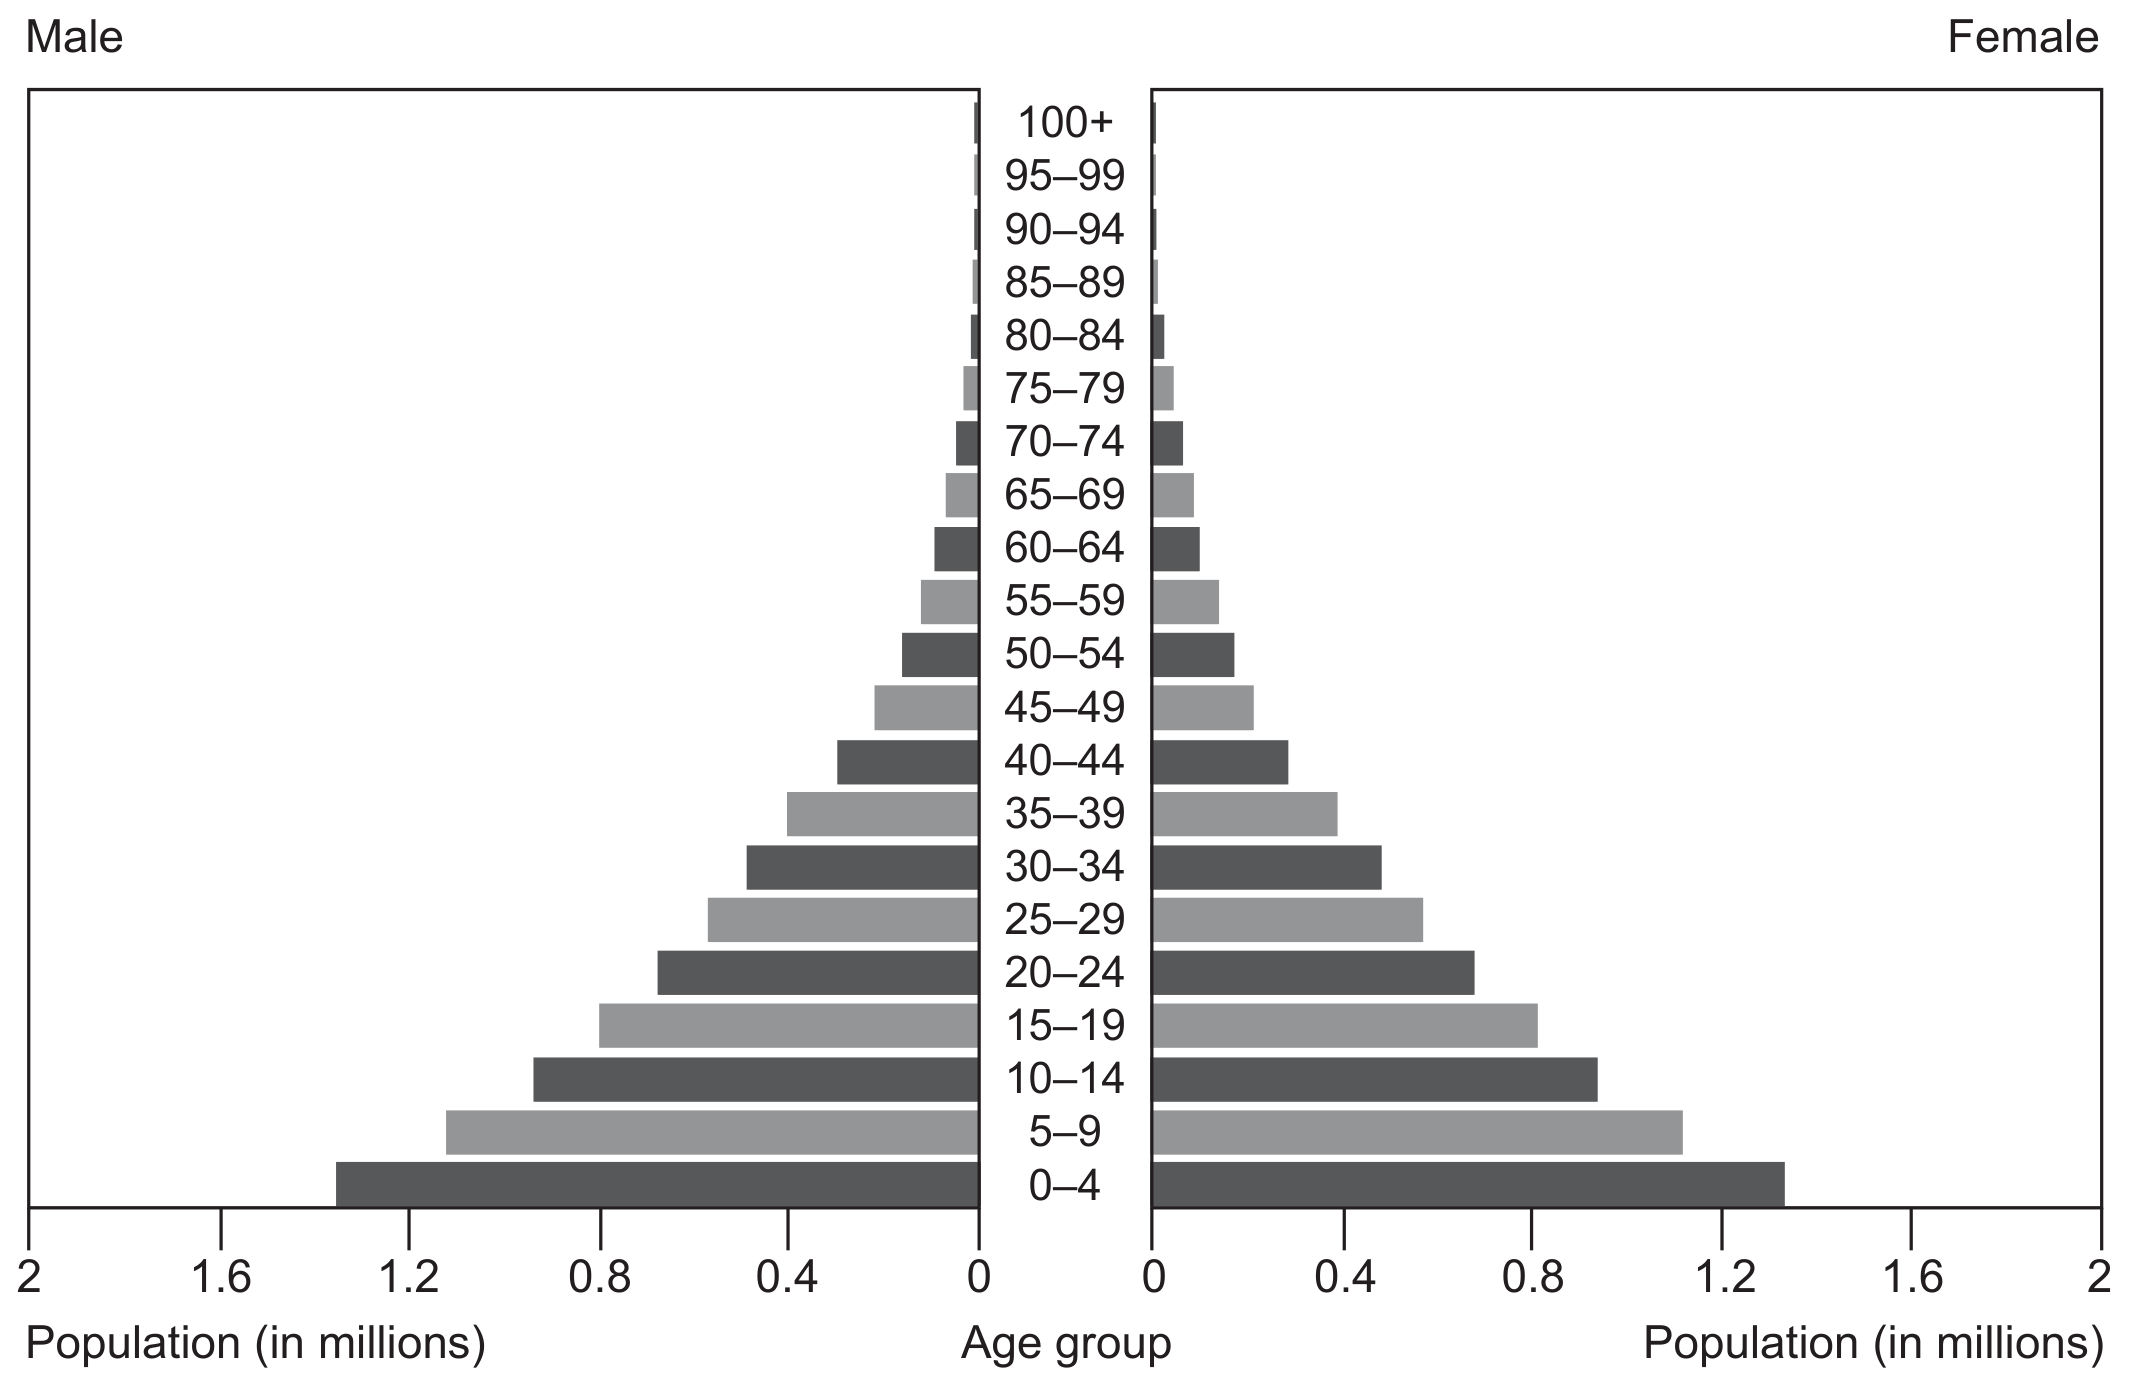
Figure 3: Population pyramid for Zambia, 2014