(a)
(i)
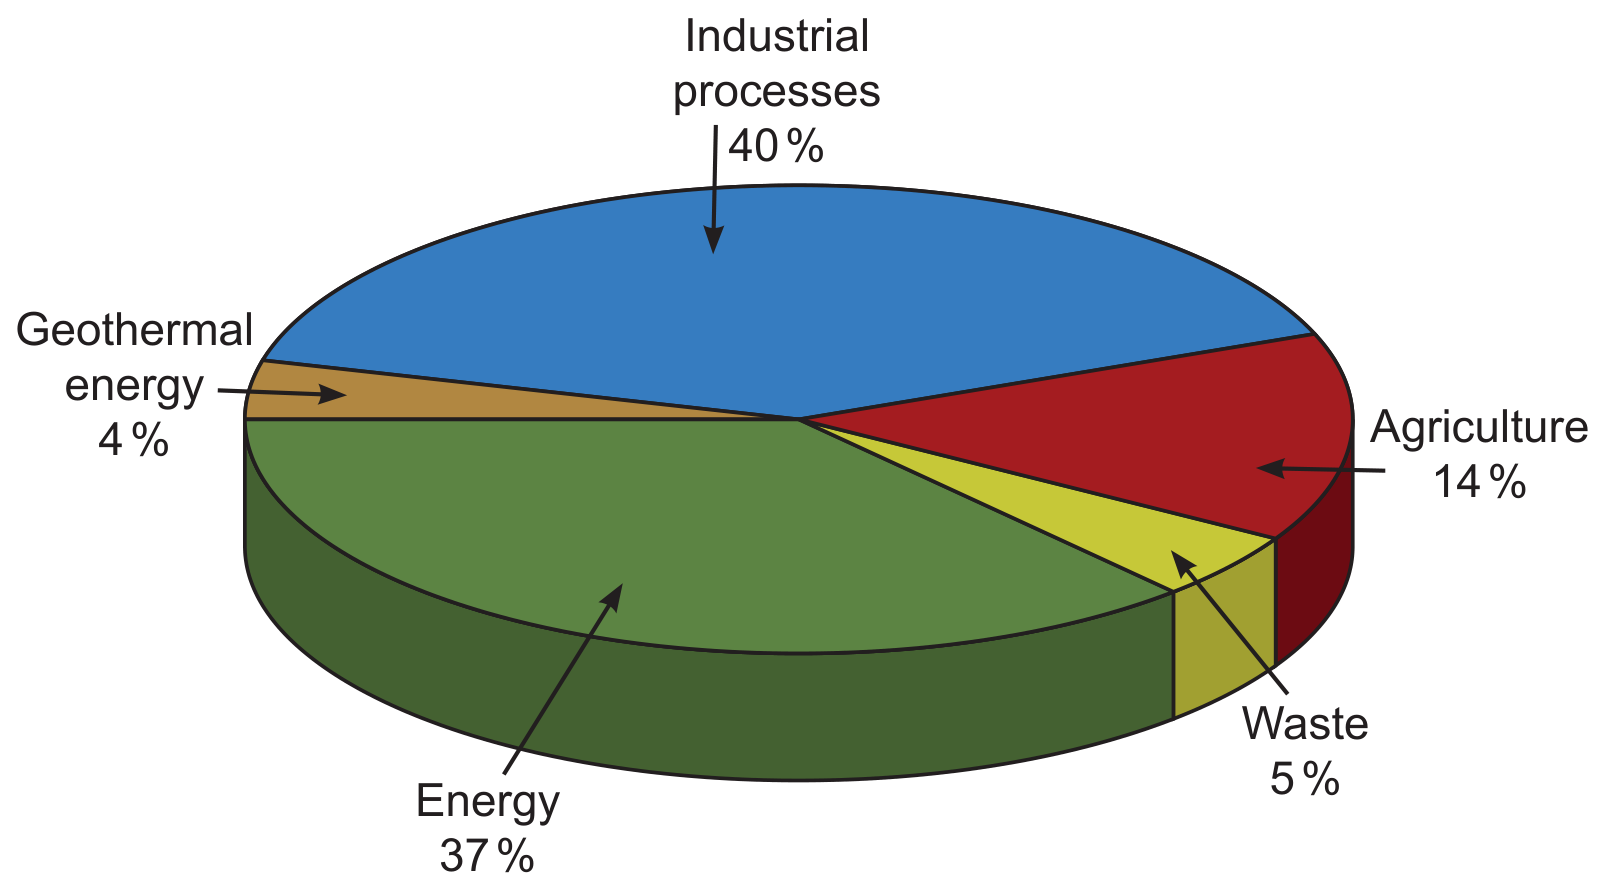
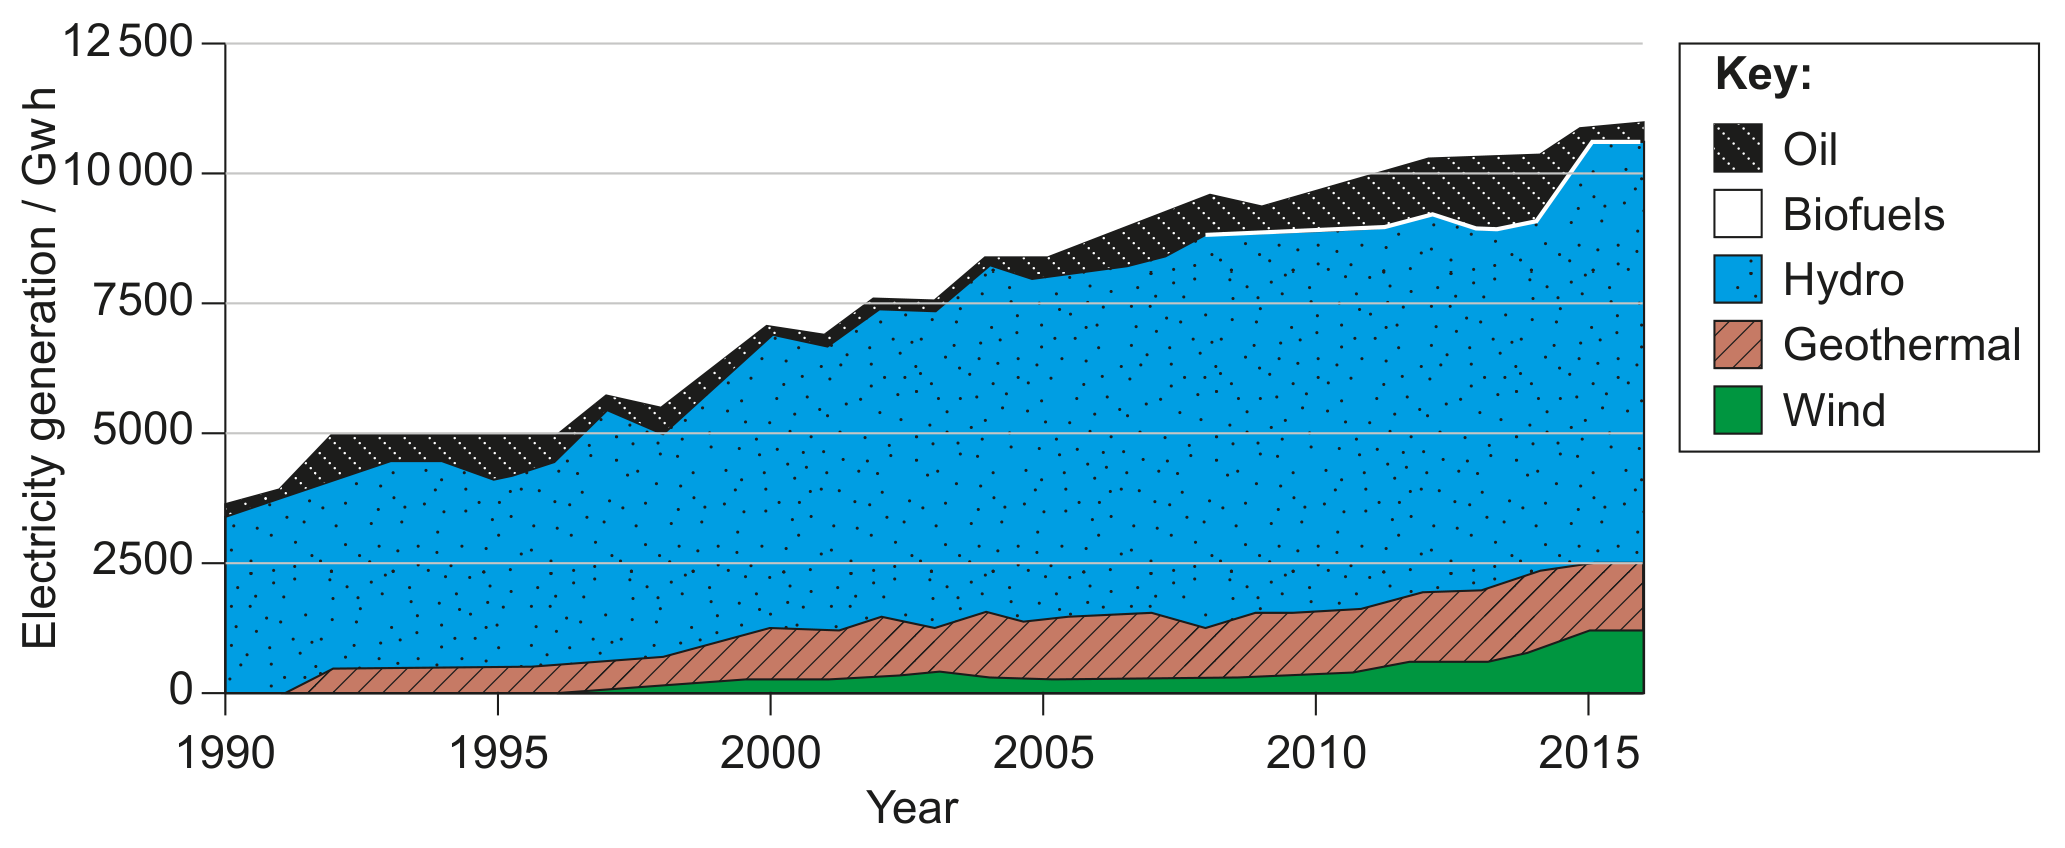
With reference to Figure 2, calculate the percentage of Kenya's electricity supply currently accounted for by renewable energy sources.
| Population (2010) | 40 million |
|---|---|
| Population growth rate | 2.6\% per year |
| People connected to electricity grid | 9.0\% |
| Traditional fuel consumption | 70.6\% of total energy |
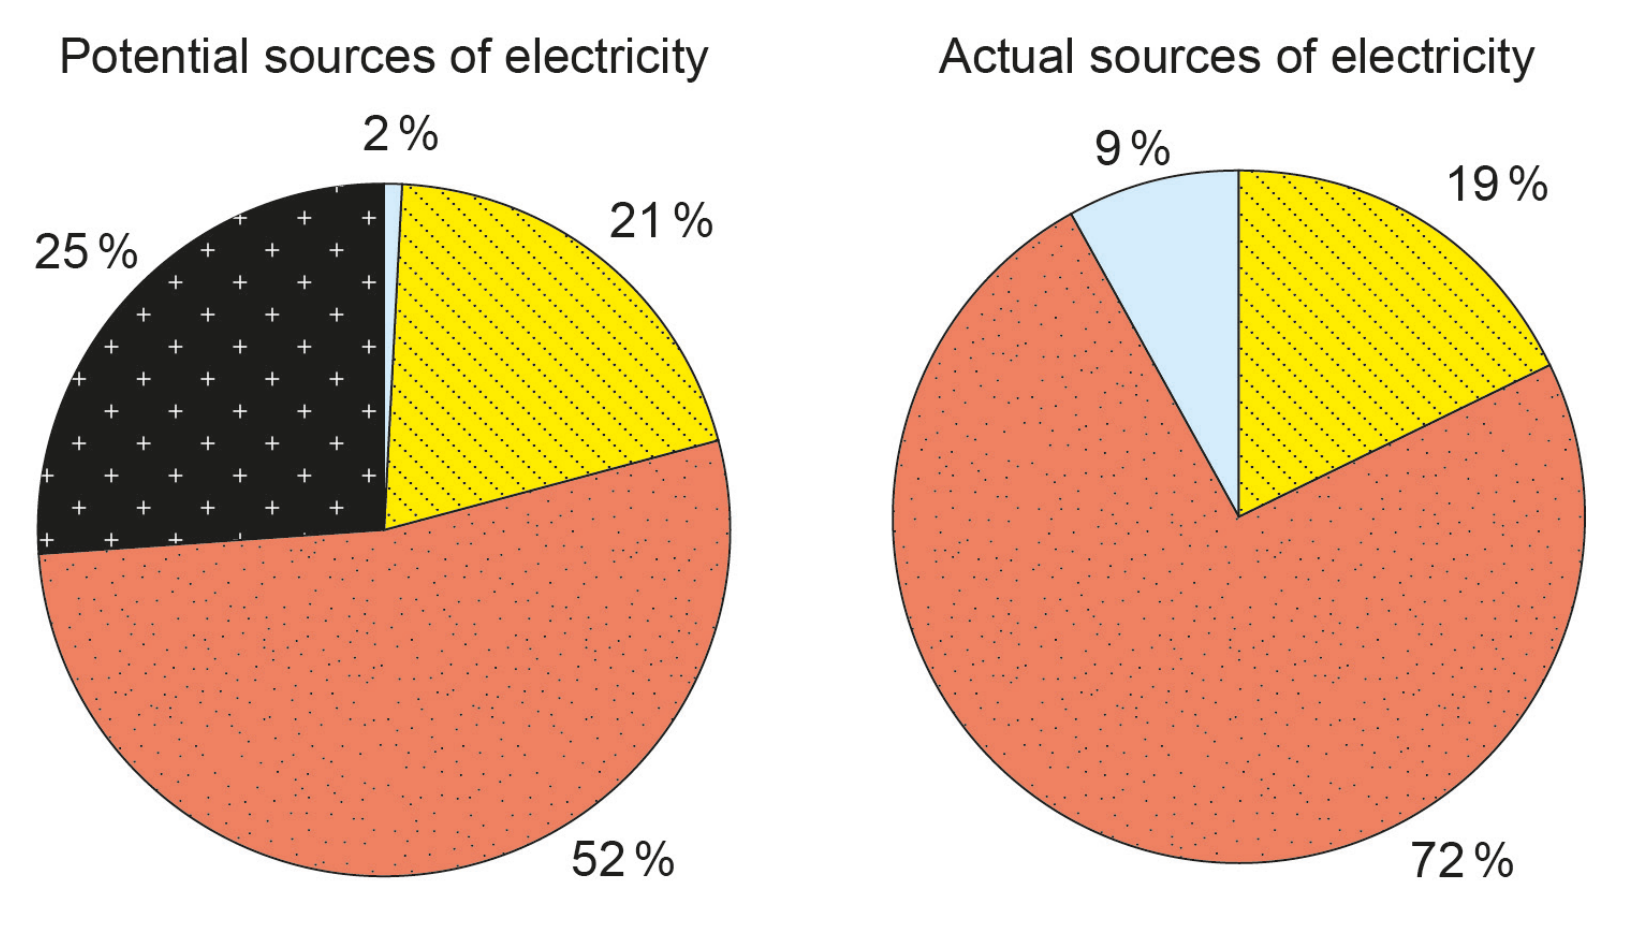
| Electricity from oil | 23.0\% |
| Electricity from hydro-electricity | 68.0\% |
| Electricity from geothermal sources | 9.0\% |
Figure 2: Fact file on Kenya
[ 1 ]
(ii)
Evaluate the effects of expanding the geothermal plant at O1 Karia.
| Population (2010) | 40 million |
|---|---|
| Population growth rate | 2.6\% per year |
| People connected to electricity grid | 9.0\% |
| Traditional fuel consumption | 70.6\% of total energy |
| Electricity from oil | 23.0\% |
| Electricity from hydro-electricity | 68.0\% |
| Electricity from geothermal sources | 9.0\% |
Figure 2: Fact file on Kenya
Figure 5: Lake Naivasha supports flower growing, geothermal power generation, tourism, fishing and dairy farming.
The flower industry depends on irrigation from the lake and uses fertilizer and pesticide inputs.
About 9% of Kenya electricity is supplied by the Ol Karia geothermal plant, with scope to expand geothermal production.
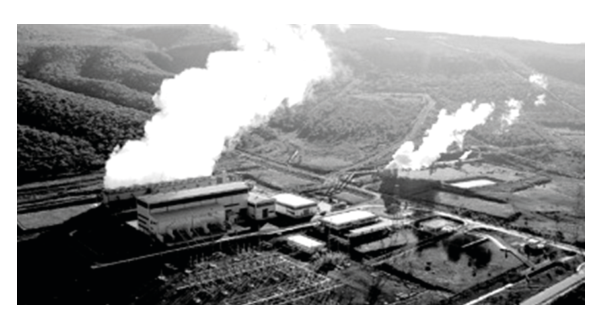
Figure 5: Ol Karia geothermal plant
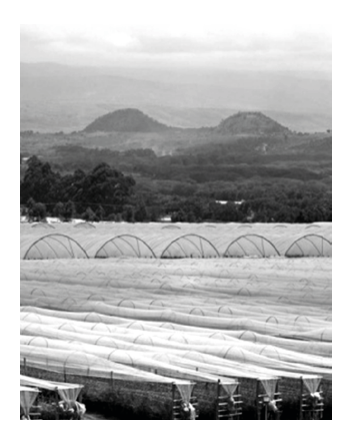
Figure 5: Geothermally heated greenhouses for flower farms
[ 4 ]