The figure refers to a typical Western European diet. This example shows recommended consumption of food types (on the basis of health) and the environmental impact of their production.
Figure 1(b): Environmental impact pyramid
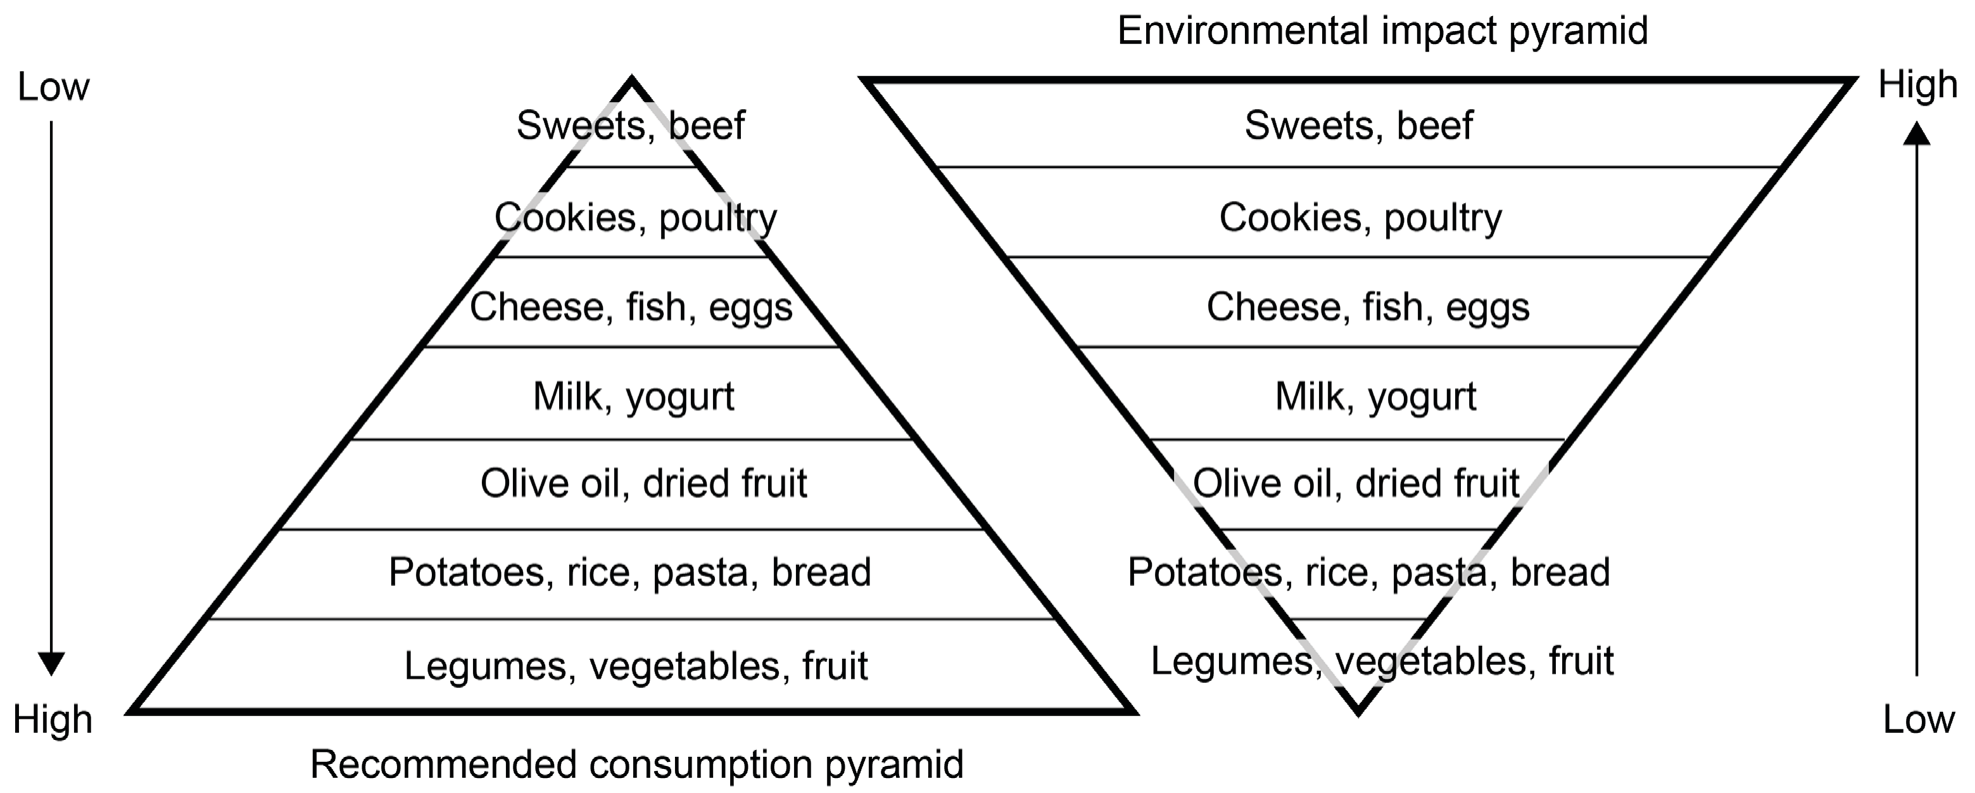
Figure 1(a): Recommended consumption pyramid and Figure 1(b): Environmental impact pyramid
With reference to Figures 1(a) and 1(b):
State the food that has the highest environmental impact.
State the food that has the highest recommended consumption.
Describe the relationship between both pyramids in Figures 1(a) and 1(b).
Identify two environmental impacts associated with producing the foods near the base of the recommended consumption pyramid (Figure 1(a)).
Outline two reasons why the composition of a typical diet in other regions of the world may differ from the Western European diet shown in Figure 1(a).