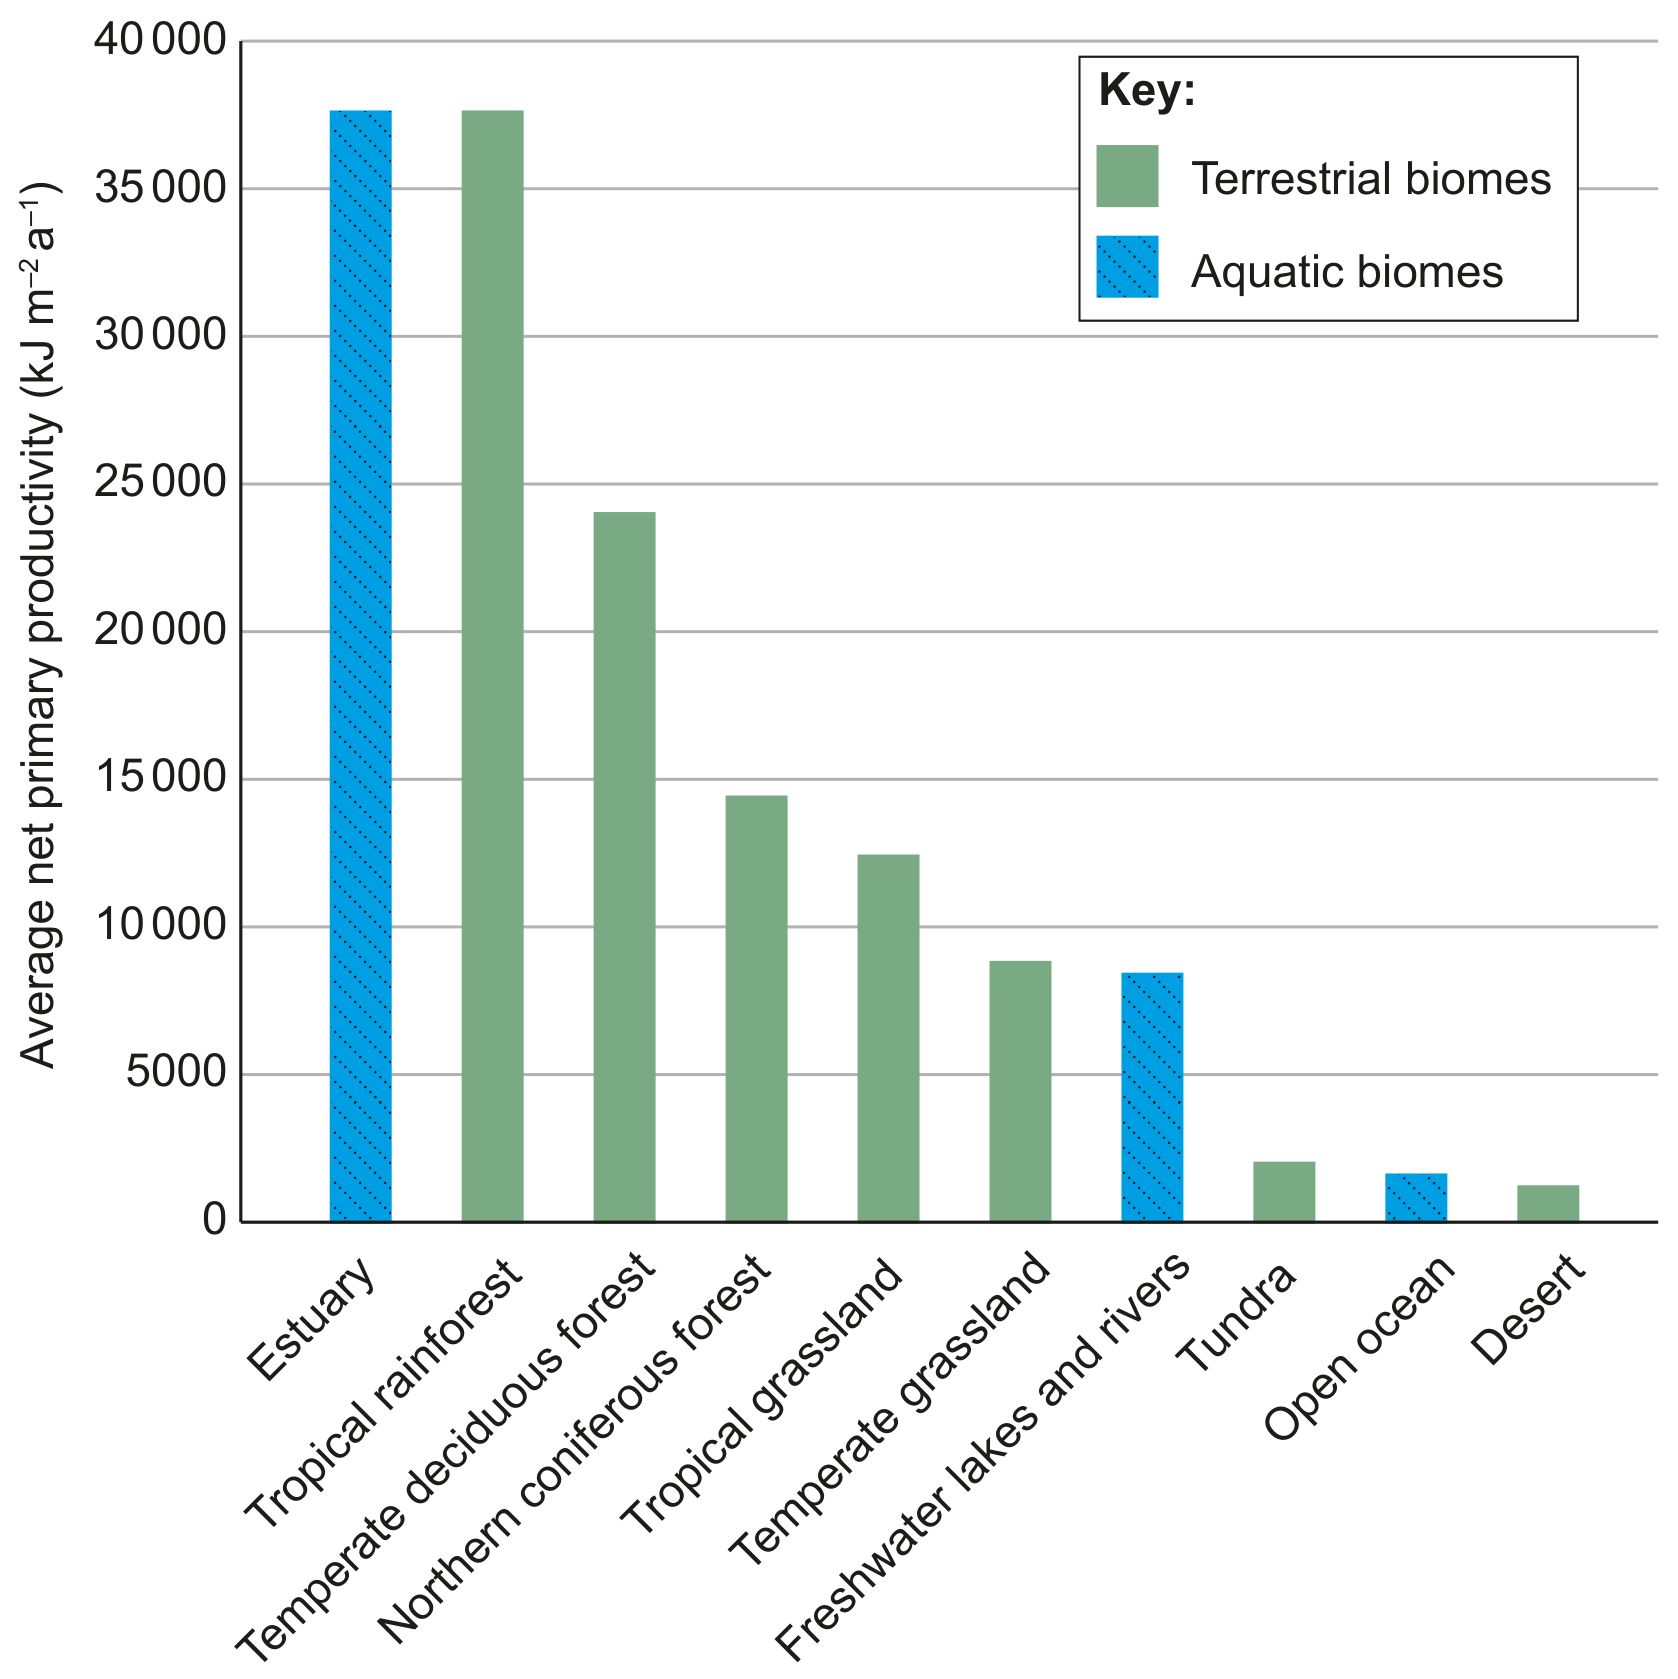
Figure 4(a): Average net primary productivity of ecosystems
Using Figure 4(a), identify an ecosystem that has an average net primary productivity above .
Estuaries are one of the most productive ecosystems in the world, but only account for 3 % of global productivity.
State one reason why this occurs.
Outline why estuaries are highly productive ecosystems.
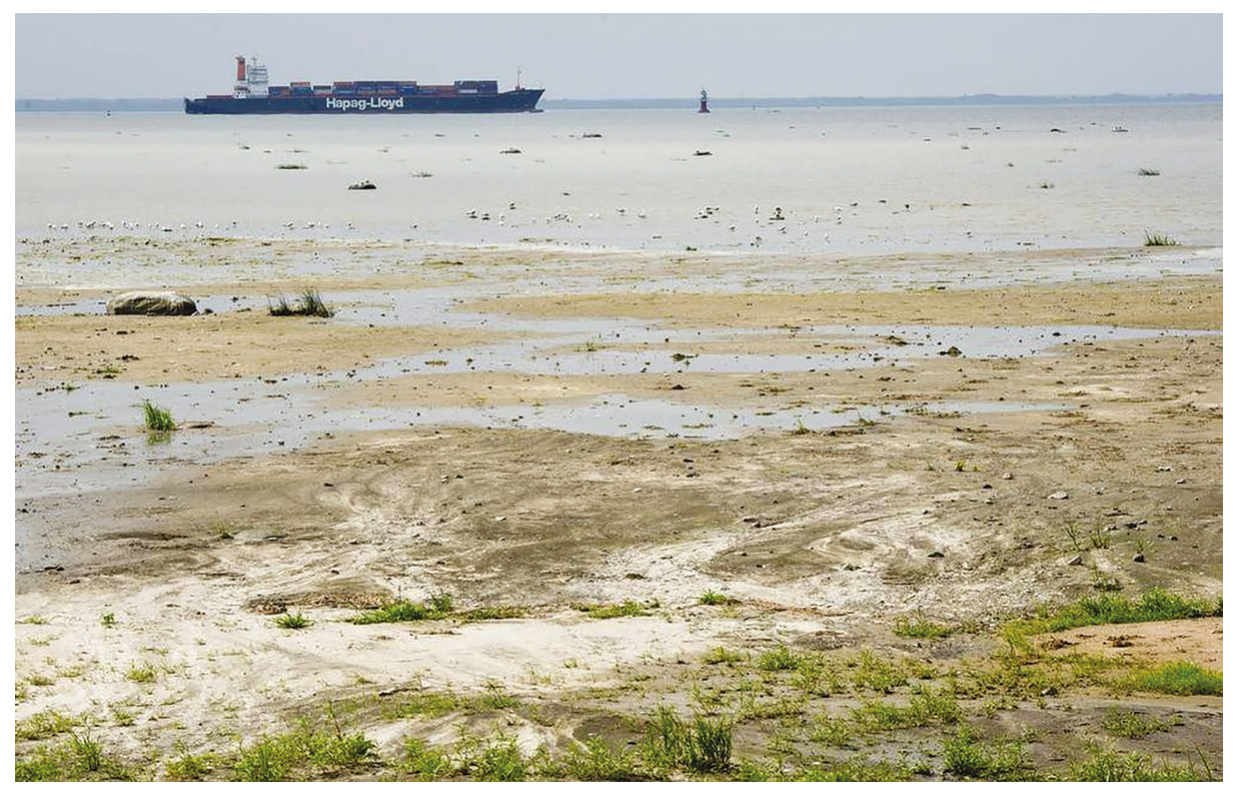
Figure 4(b): Mudflats along the St Lawrence River estuary at low tide
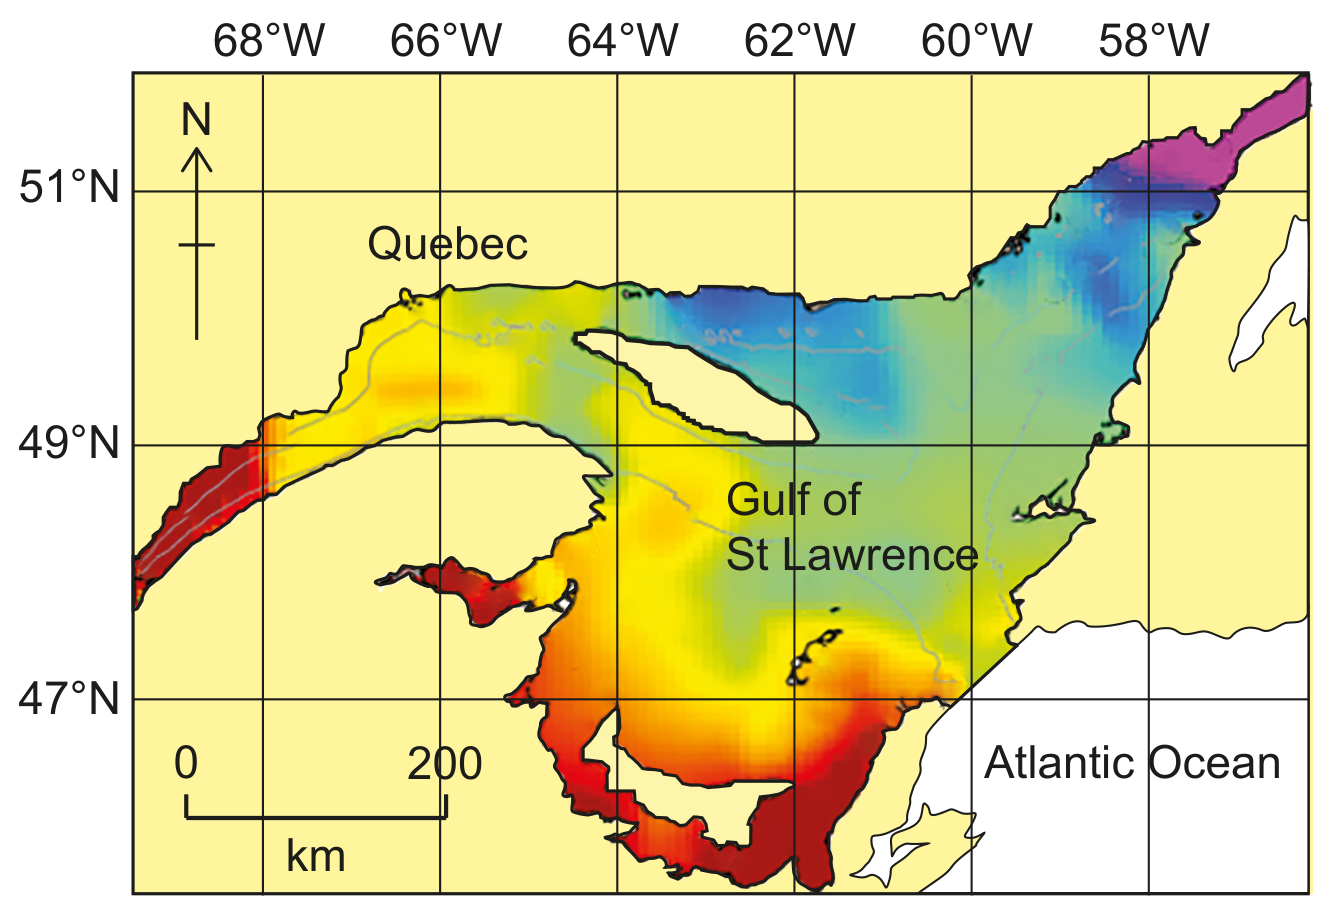
Figure 5(a): Salinity variation in the Large Ocean Management Area
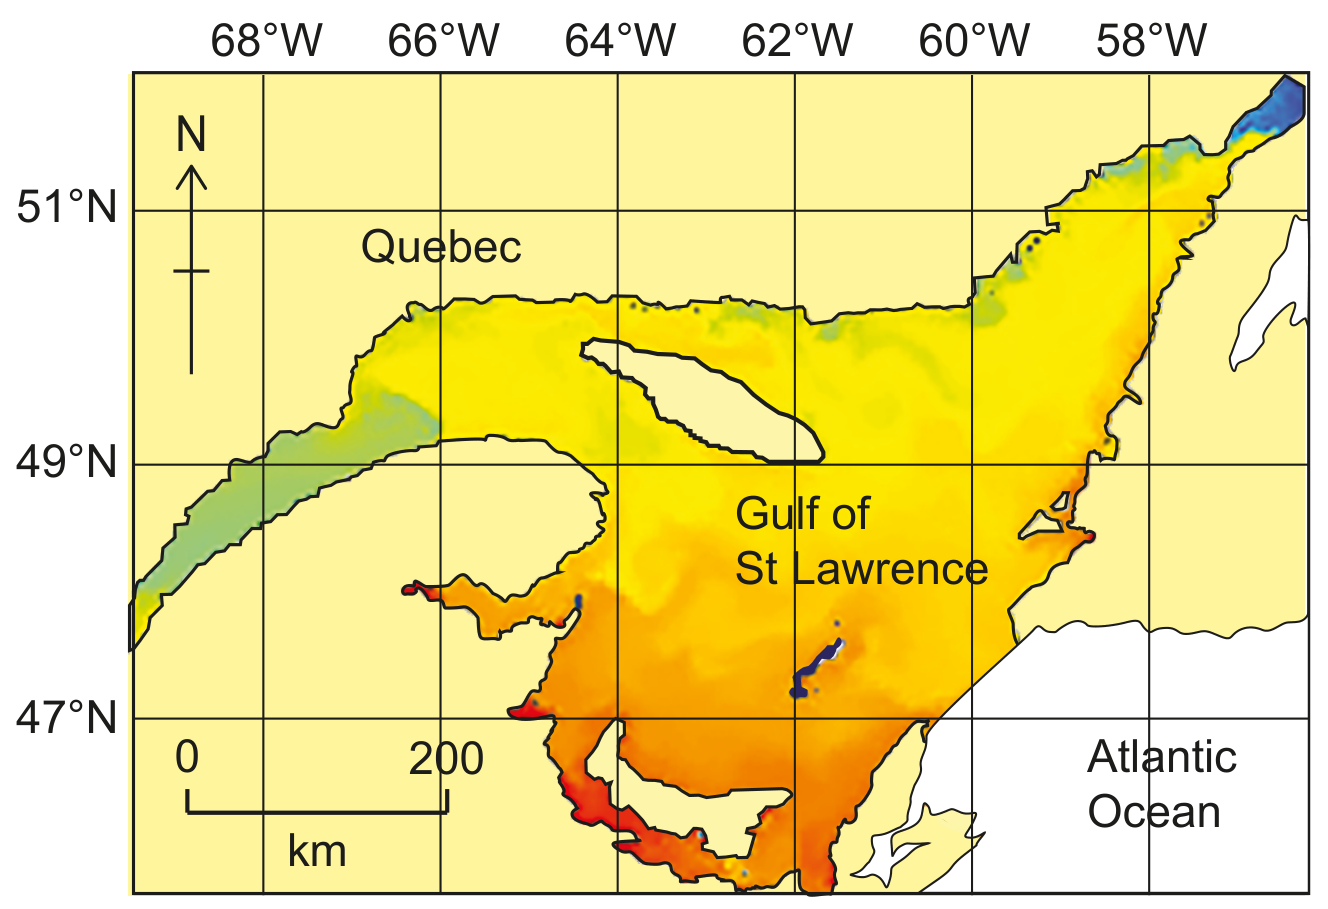
Figure 5(b): Water-surface temperature variation across the LOMA
The St Lawrence River estuary and Gulf of St Lawrence are recognized as a Large Ocean Management Area by the Canadian government.
The area is an important shipping route, highly productive, provides habitat for birds, whales and crabs, and provides nursery grounds for commercial fish species.
Management is challenging because stakeholder interests may conflict or be environmentally damaging.