Populations and communities describe abundance, sampling, growth limits, species interactions and trophic controls that shape ecological patterns across habitats and ecosystems.
A Population Is One Interacting Species in a Defined Area
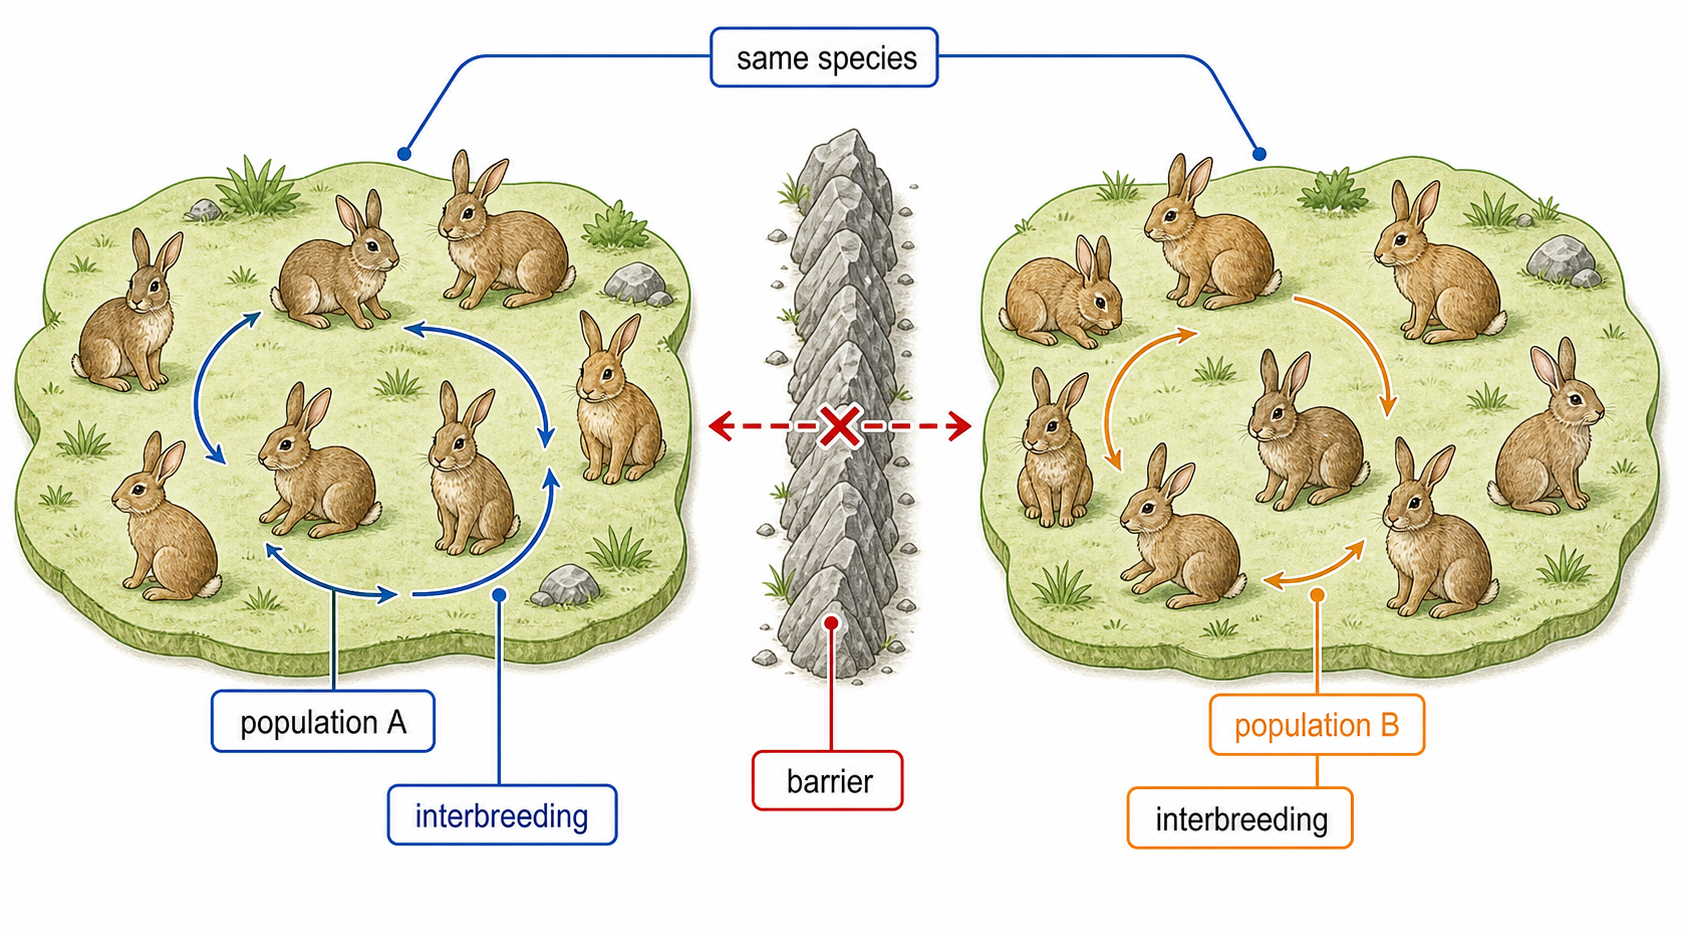
A population is all interacting individuals of the same species living in a defined area at the same time. In a sexually reproducing species, members have opportunities to interbreed.
Two groups can belong to the same species but form different populations when geography, behaviour or timing prevents regular gene flow between them.
Let Habitat Structure Choose the Sampling Design
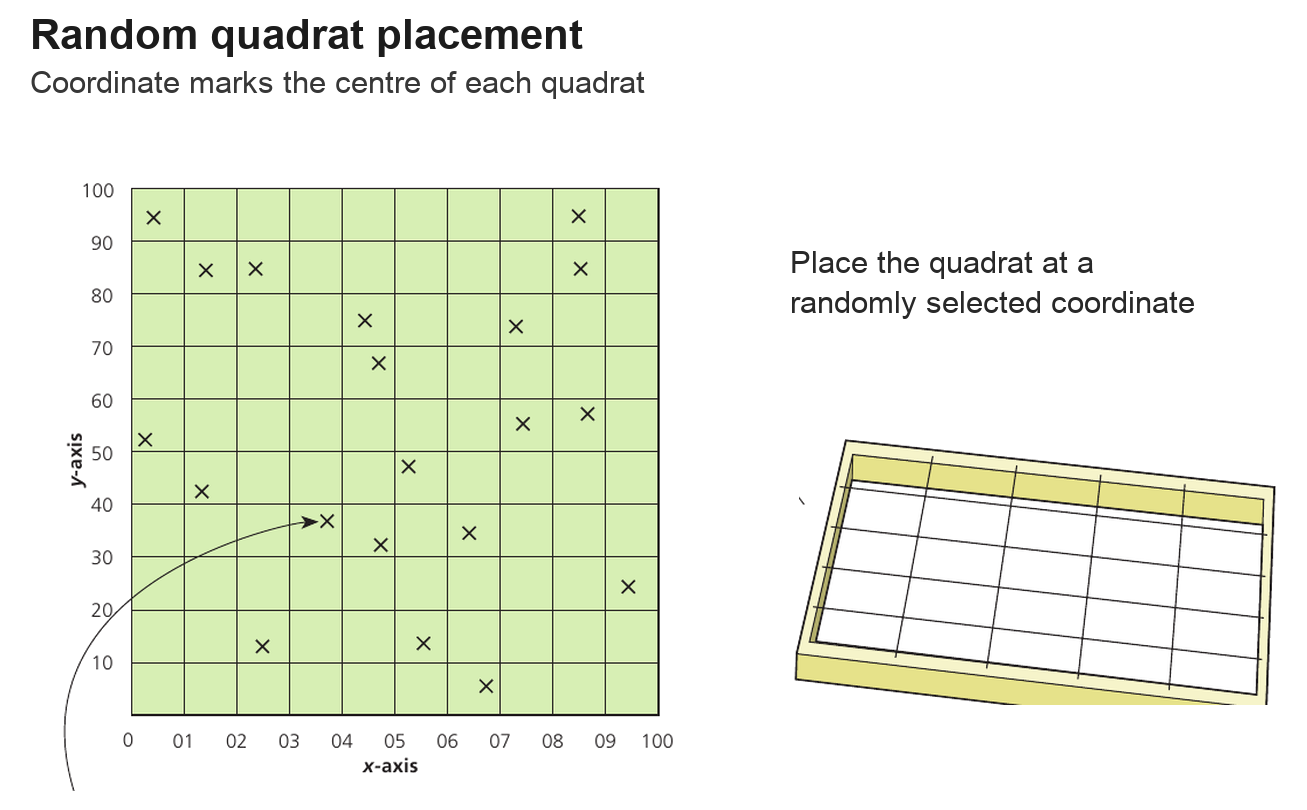
A sample must represent the study area. Random placement reduces selection bias, but the correct design also depends on spatial structure.
Site or question
Sampling design
one relatively uniform habitat
random points or coordinates
two or more habitat types
stratified: sample each in proportion to its area
change along an environmental gradient
systematic points at fixed intervals on a transect
More repeated samples reduce random sampling error. They do not repair a systematic bias such as choosing only species-rich patches.
Random Quadrats Turn a Fixed Area into Representative Samples
Mark the site's boundaries and coordinate axes.
Generate random coordinate pairs.
Place the same-sized quadrat with its centre at each coordinate.
Identify the target species and record the chosen response.
Repeat enough times to estimate a mean and variation.
Record
Best when…
density
individuals can be distinguished and counted
frequency
presence or absence across quadrats matters
percentage cover
individuals overlap or cannot be separated easily
abundance score
a defined ordinal scale is appropriate
Scale Mean Quadrat Density to the Whole Habitat
N^=nˉ×aA
The estimated population size equals the mean number of individuals per quadrat multiplied by total habitat area ÷ quadrat area.
Evidence
Value
mean count per 0.5 m² quadrat
6.4 plants
habitat area
250 m²
estimate
6.4 × (250 ÷ 0.5) = 3,200 plants
This is an estimate, not a full count. Report sampling method, number of quadrats and variation so the uncertainty and representativeness can be judged.
Marked Animals Reveal the Fraction Sampled Again
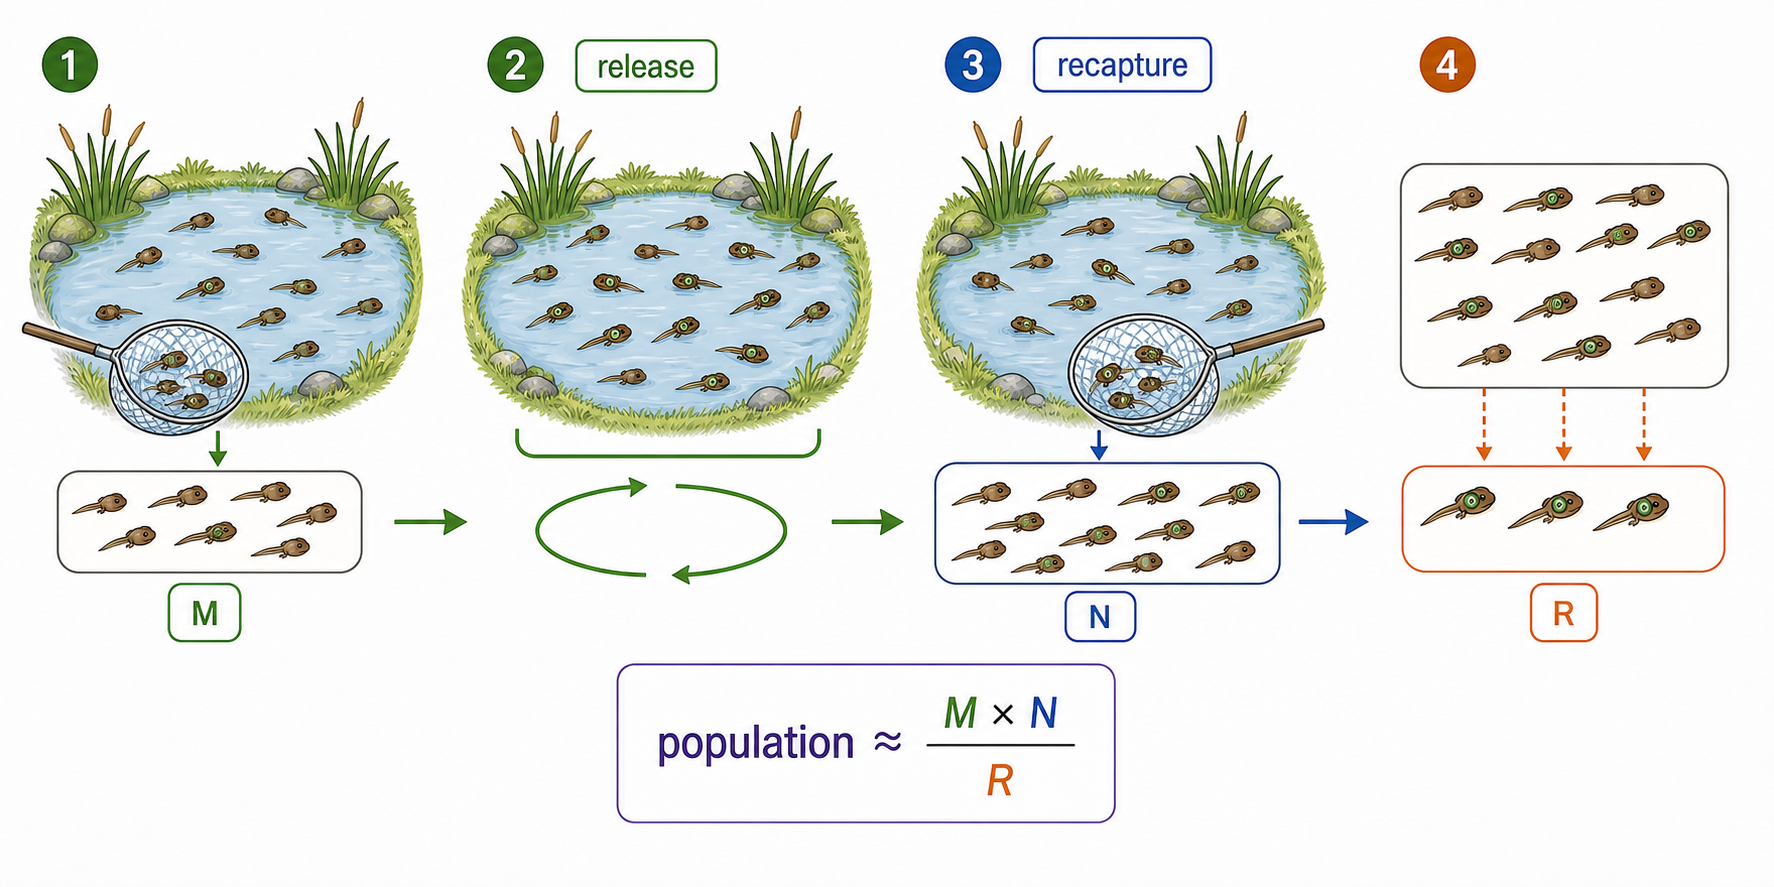
After marked animals mix back into the population, the marked fraction in the second sample should approximate the marked fraction in the whole population.
NR≈N^MN^≈RM×N
If M = 50, N = 40 and R = 10, then the estimated population size = (50 × 40) ÷ 10 = 200 animals. Fewer marked recaptures imply a larger estimated population.
Each Lincoln Assumption Protects the Ratio
Assumption
If violated…
Likely effect
marked animals mix completely
second sample contains too many nearby marked animals
R too high → underestimate
marks persist and are recognized
marked animals appear unmarked
R too low → overestimate
marking does not alter survival or capture
marked animals are lost or avoided
R too low → overestimate
population is closed
births, deaths or movement change the fractions
estimate no longer describes one stable population
equal catchability
some individuals dominate both samples
biased in either direction
Use a harmless, inconspicuous, durable mark; allow time for mixing; recapture in the same defined area; and keep the interval short enough that demographic change is limited.
Carrying Capacity Depends on Current Environmental Limits
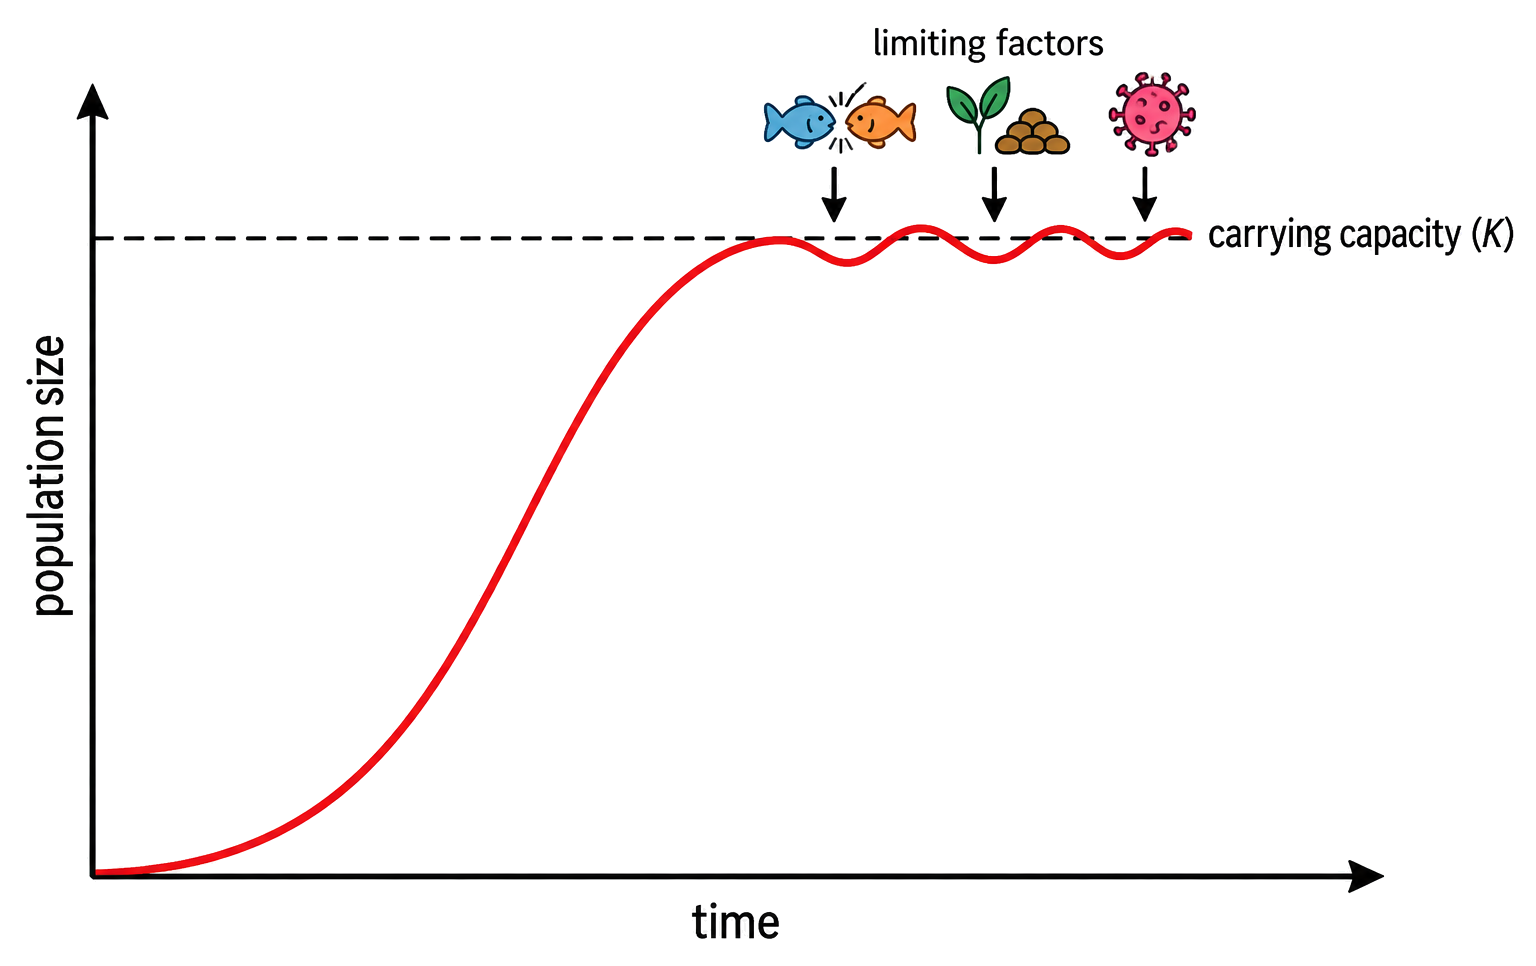
Carrying capacity, K, is the largest population that the current environment can sustain over time without exhausting the resources and conditions on which that population depends.
Plants may be limited by light, water, mineral nutrients, carbon dioxide, temperature or space.
Animals may be limited by food, water, mates, territory, nesting sites, disease or predation.
K is not permanently fixed. Seasonal change, disturbance, habitat management or evolution can alter the limiting environment and therefore alter carrying capacity.
Density-Dependent Feedback Opposes Departure from Capacity
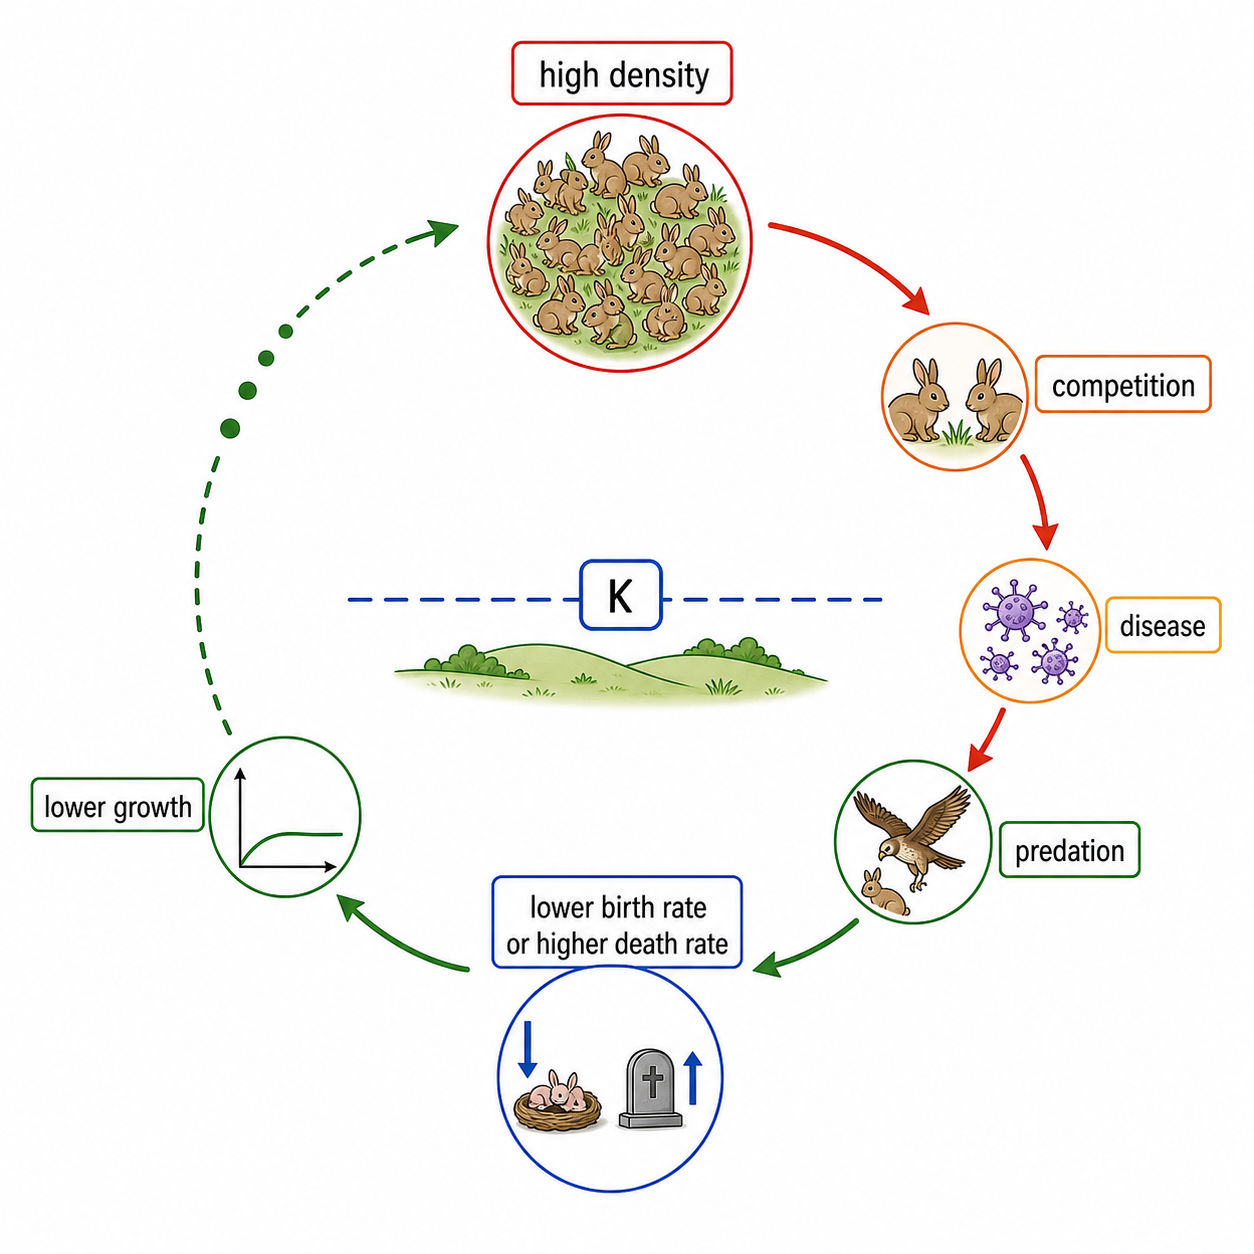
population density rises → competition, pathogen transmission, waste effects or predation intensify → birth rate falls and/or death rate rises → net growth falls → density moves back toward K
Factor
Density-dependent?
Regulatory pattern
competition, disease, predation
yes
effect becomes stronger as density rises
drought, frost, fire or storm
usually no
can change population size regardless of density
‘Negative’ describes opposition to change, not harm. The result is often fluctuation around K rather than a perfectly constant population.
Curve Shape Records How Net Population Change Is Changing
ΔN=(B+I)−(D+E)
Population increases when births B plus immigration I exceed deaths D plus emigration E. The graph's slope shows the net rate of change.
A rising curve can still be slowing: population size increases while its slope decreases during the transition toward carrying capacity.
Each Sigmoid Phase Has a Different Growth Balance
Phase
Population pattern
Mechanism
lag or establishment
small rise
few reproductive individuals; acclimation
exponential
increasingly steep rise
resources abundant; births greatly exceed deaths
transition
rise continues but slows
competition, disease or predation strengthen
plateau
fluctuates around K
average gains and losses are approximately balanced
The smooth sigmoid is an idealized model. Real populations show irregular departures caused by weather, disturbance, migration and changing resource supply.
A Growth Model Needs Replication, Repeated Counts and One Changed Factor
Start equal cultures with a small known number of duckweed thalli or a measured yeast inoculum.
Use at least five replicates per condition.
Hold temperature, light, volume and nutrients constant unless one is the independent variable.
Count or measure population size at regular intervals.
Plot the mean against time and show variation.
Observation
Interpretation
progressively steeper early rise
net growth rate is increasing
curve bends toward a plateau
limiting factors are strengthening
different plateau under changed nutrients
the treatment changed carrying capacity
large scatter among replicates
estimate is less precise; investigate uncontrolled variation
Counting duckweed area or yeast absorbance may be a proxy rather than a direct count. State what was actually measured and do not treat a smooth fitted curve as exact reality.
Estimate the Population, Then Explain Its Change
define the population → choose a representative design → sample sessile or motile organisms appropriately → calculate an estimate → test assumptions and uncertainty → follow size through time → explain slope and fluctuations using limiting factors and feedback
Evidence pattern
First question to ask
quadrat estimate differs between repeats
were placement, sample number and habitat structure representative?
few marked animals are recaptured
is the population large, or were marks lost / mixing poor?
growth slows near a plateau
which density-dependent factor is strengthening?
population drops far below K after a storm
is a density-independent disturbance responsible?
A population number becomes biologically useful only when the sampling inference and the mechanism of change are both explicit.
Competition and Cooperation Can Coexist within One Population
Intraspecific interaction
Immediate effect
Possible fitness consequence
competition for food, light, territory or mates
each competitor gains less access to a limiting resource
reduced survival or reproduction
dominance hierarchy
some individuals gain priority; repeated fighting is reduced
lower injury cost for the group, unequal access remains
cooperative hunting
individuals share pursuit and capture
prey too large or fast for one hunter becomes available
parental or colony care
time and energy support related young
more shared genes may survive into the next generation
Members of one species overlap strongly in resource needs, so competition can be intense. Cooperation is favoured when its direct or inclusive-fitness benefit exceeds its cost in that context.
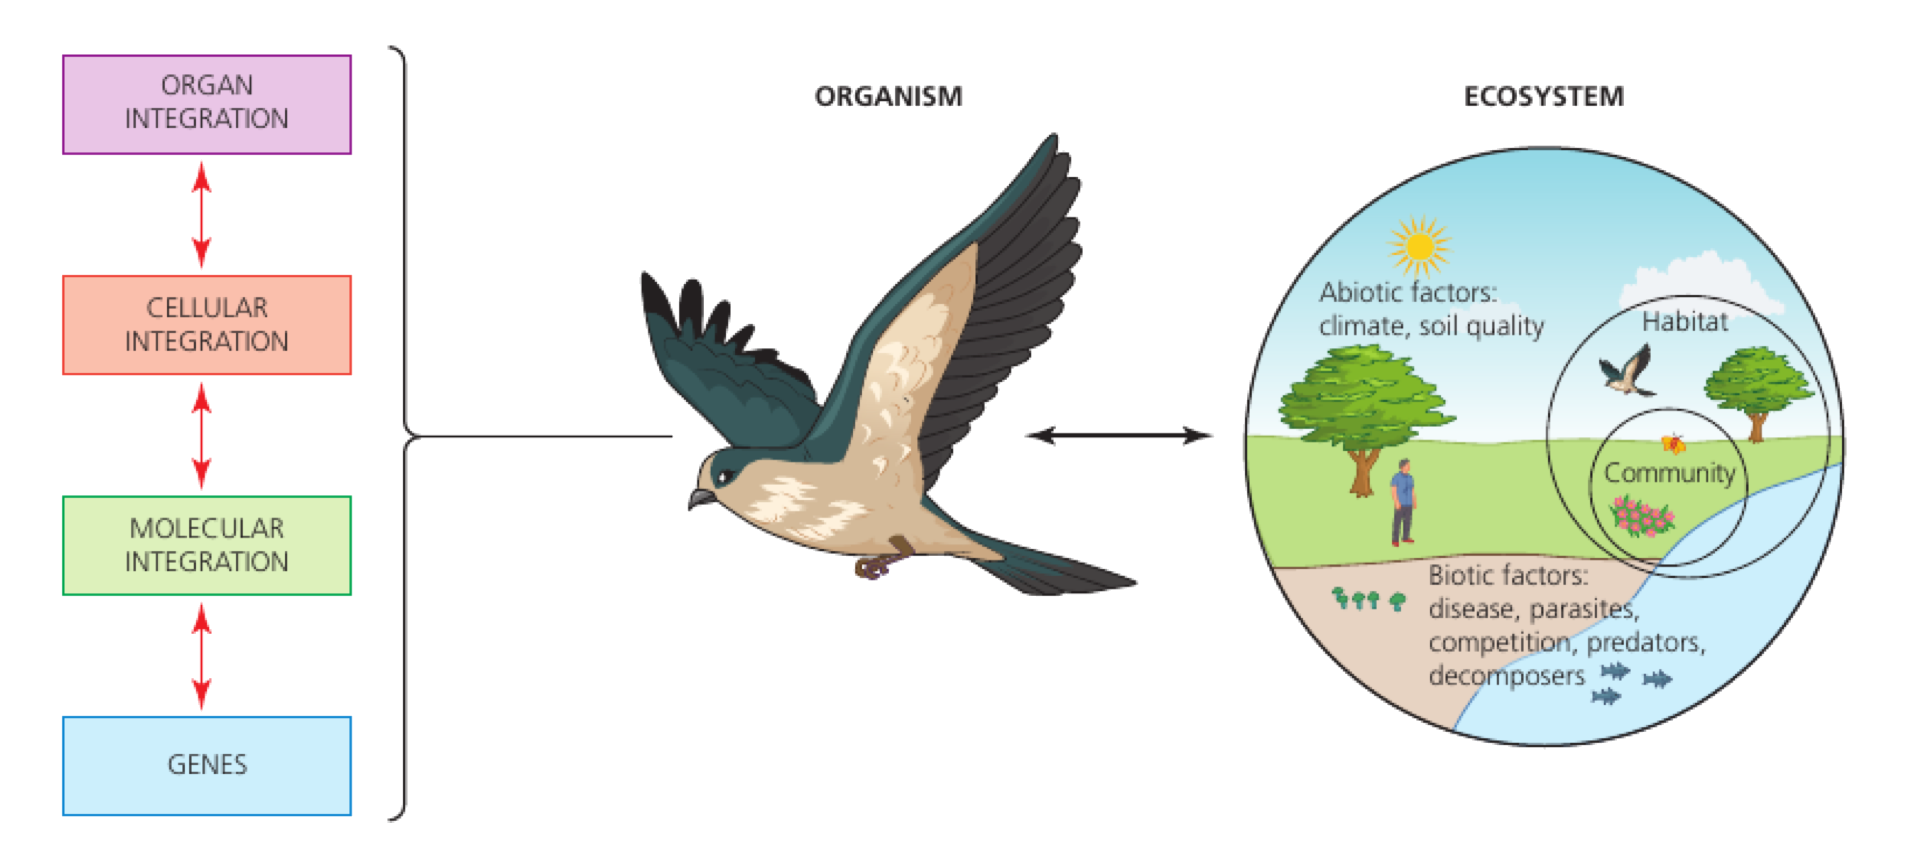
A Community Is the Interacting Biotic Part of an Ecosystem
Ecological level
Includes
population
one species in one area
community
all interacting populations in that area
ecosystem
the community plus abiotic conditions and their interactions
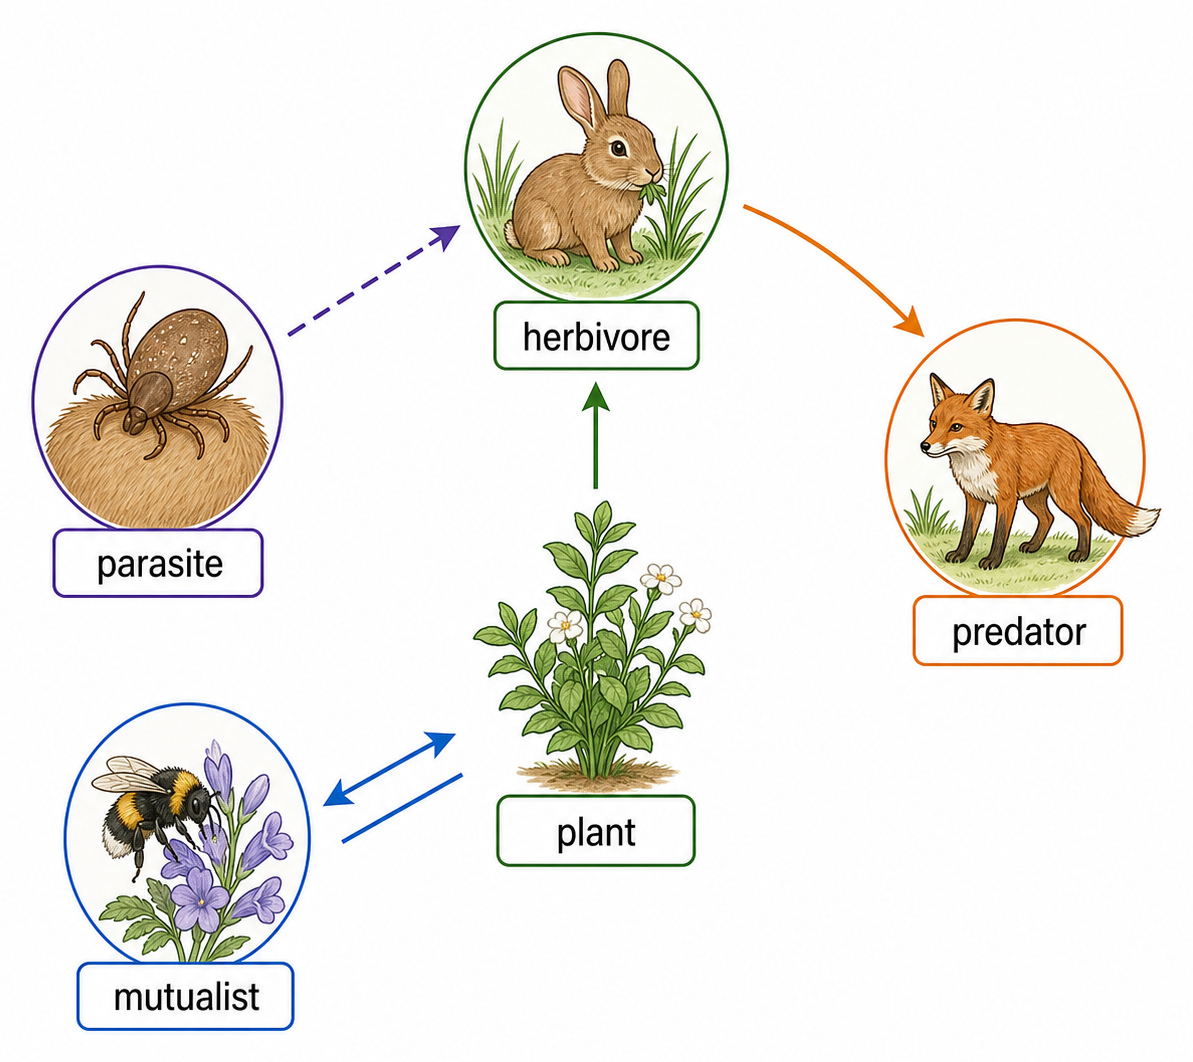
A change in one population can alter food, habitat, disease, pollination or competition for several others. Community structure is therefore a network outcome, not a list of species.
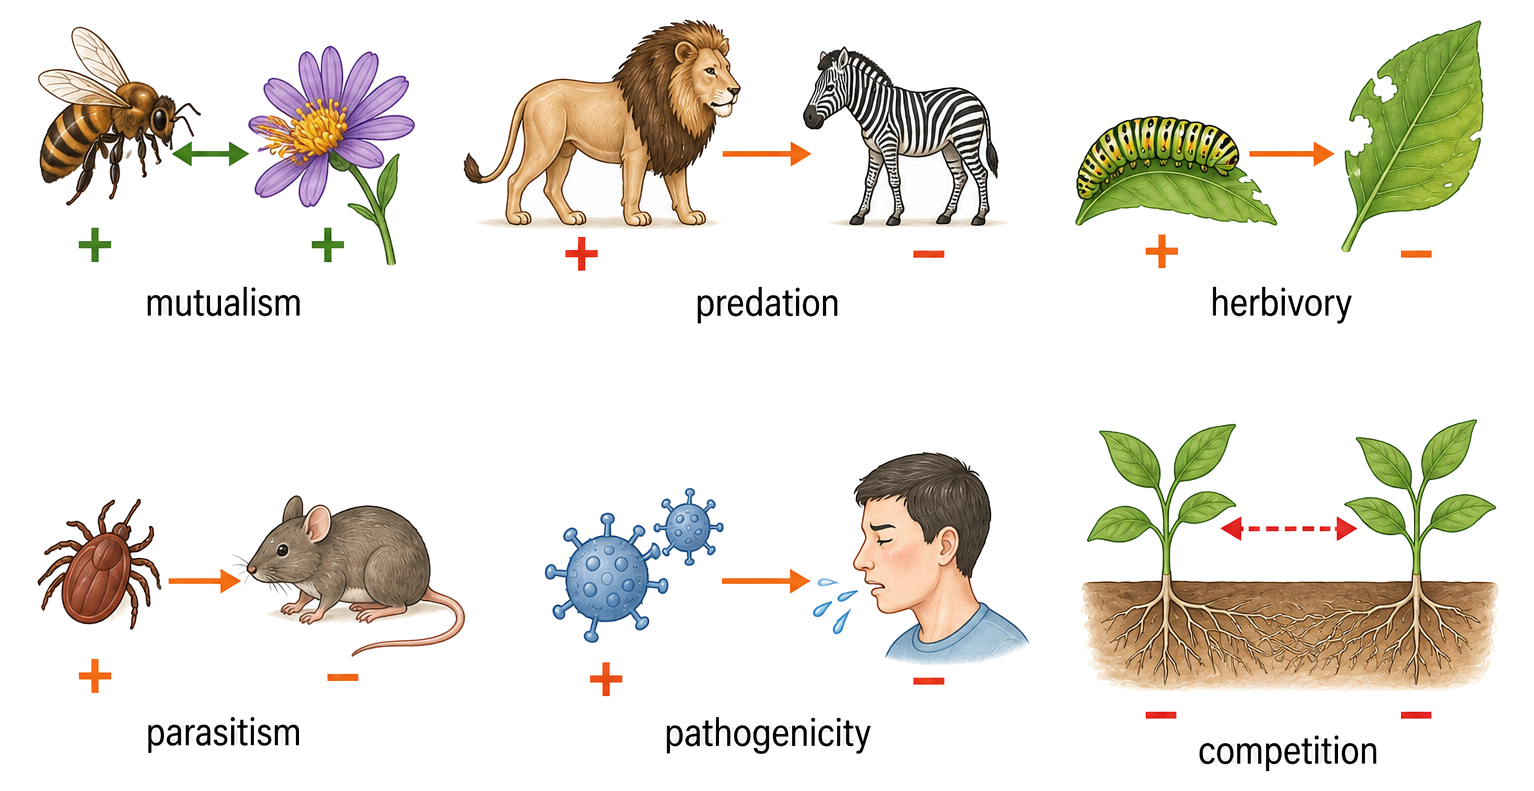
Interaction Signs Classify Effects on Two Species
Relationship
Species A
Species B
Defining transfer or effect
mutualism
+
+
each gains a resource or service
competition
−
−
both lose access or spend resources contesting
predation
+
−
predator kills and consumes prey
herbivory
+
−
animal consumes plant or algal tissue
parasitism
+
−
parasite gains resources while living on or in host
pathogenicity
+
−
pathogen reproduces while damaging host
The signs describe effects relative to no interaction. They do not mean every individual receives the same benefit or cost, and the outcome can change with conditions.
Mutualism Persists When Both Partners Gain
In mutualism, each species receives a net benefit from the interaction under the stated conditions. The exchanged benefits may be nutrients, energy-rich compounds, protection, habitat or transport.
Partners
One partner gives
The other gives
legume ↔ Rhizobium
carbohydrates and a root-nodule habitat
fixed nitrogen compounds
orchid ↔ mycorrhizal fungus
photosynthetic carbohydrates after establishment
water and mineral nutrients; crucial seedling nutrition
coral ↔ zooxanthellae
CO₂, mineral waste and protected habitat
glucose and O₂ from photosynthesis
Mutualism is not unlimited generosity: both partners incur costs, and the relationship persists when the received benefit exceeds those costs. Dependence may be facultative or obligatory.
Introduced Does Not Automatically Mean Invasive
Term
Meaning
native
occurs in an area without human introduction
endemic
native and restricted to a particular geographic area
alien / introduced
moved outside its native range by human activity
invasive
introduced, spreads rapidly and causes ecological harm
In Britain, introduced grey squirrels can digest acorns earlier and use a wider diet than red squirrels. Their niches overlap, so more grey squirrels compete for hazelnuts, pine cones and habitat while also carrying squirrelpox that strongly affects red squirrels.
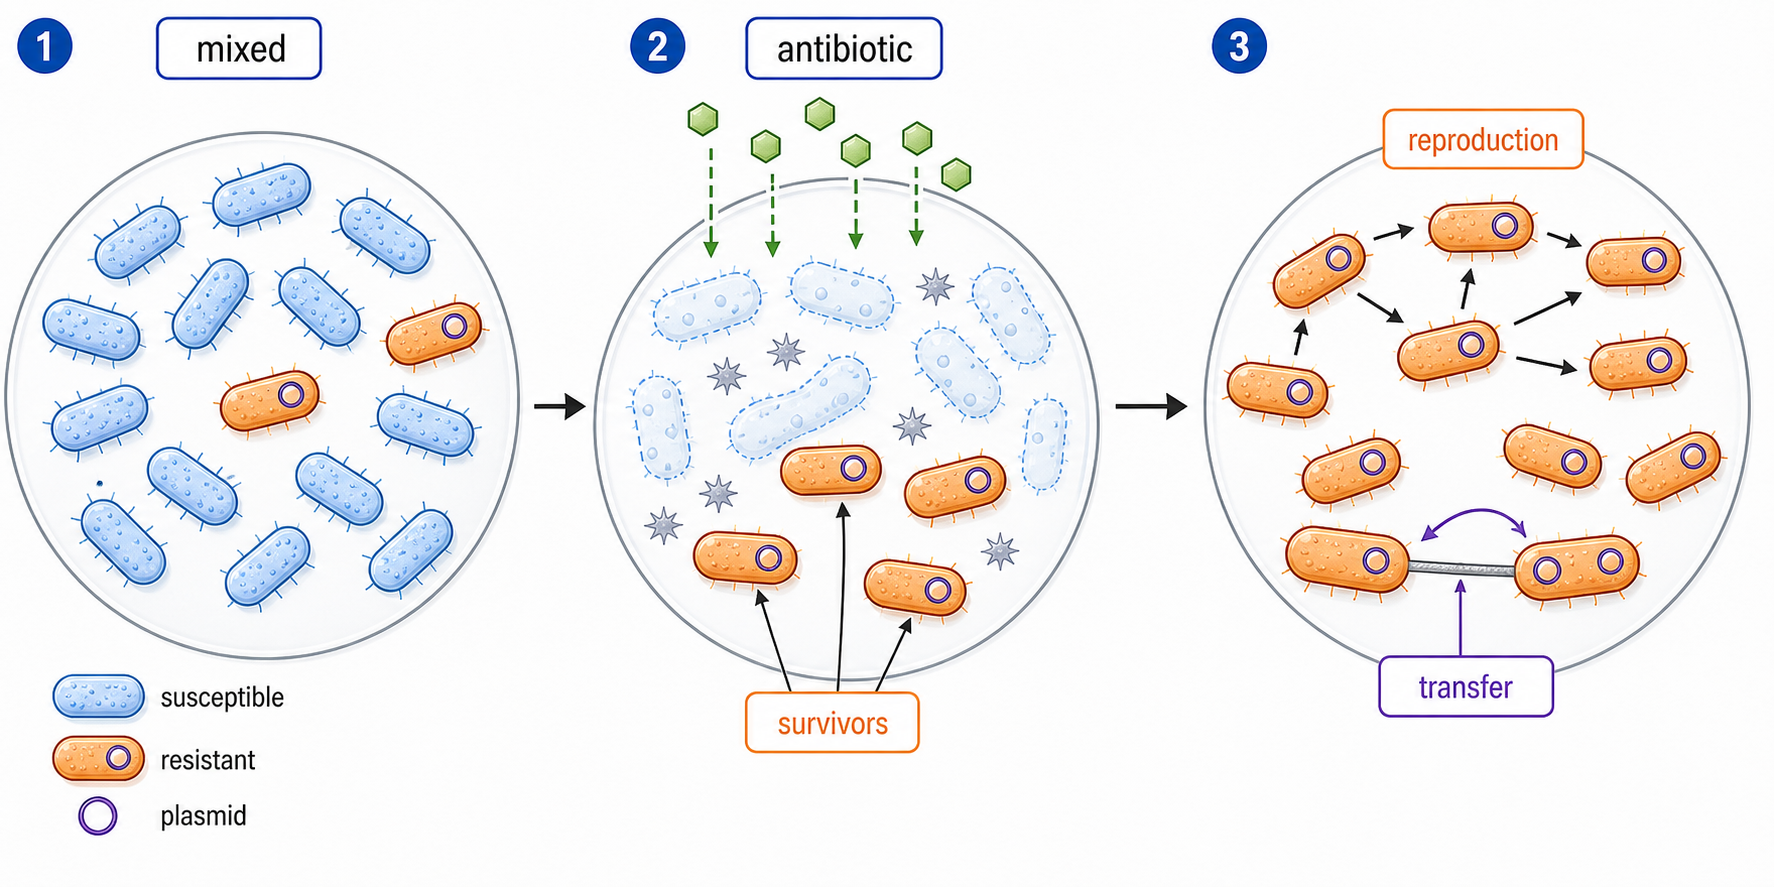
Escape from predators or pathogens, rapid reproduction and broad resource use can expand an introduced species' realized niche. The native competitor may then lose resources and occupy a smaller realized niche.
Competition Needs Evidence Stronger Than Co-Occurrence
Approach
What it can show
Main limitation
field observation / random sampling
species distributions are associated
shared abiotic conditions may cause the pattern
laboratory comparison
performance changes when species are grown alone versus together
simplified conditions may not transfer to the field
field removal or addition
one species changes when the other is manipulated
difficult controls and other field changes remain
Strong evidence predicts a response, manipulates the proposed competitor, measures the response, uses controls and replication, and rules out alternative explanations such as desiccation or substrate.
One species doing better where another is absent suggests competition; it does not by itself prove that competition caused the distribution.
Connell Revealed a Niche Hidden by Competition
Observation or manipulation
Inference
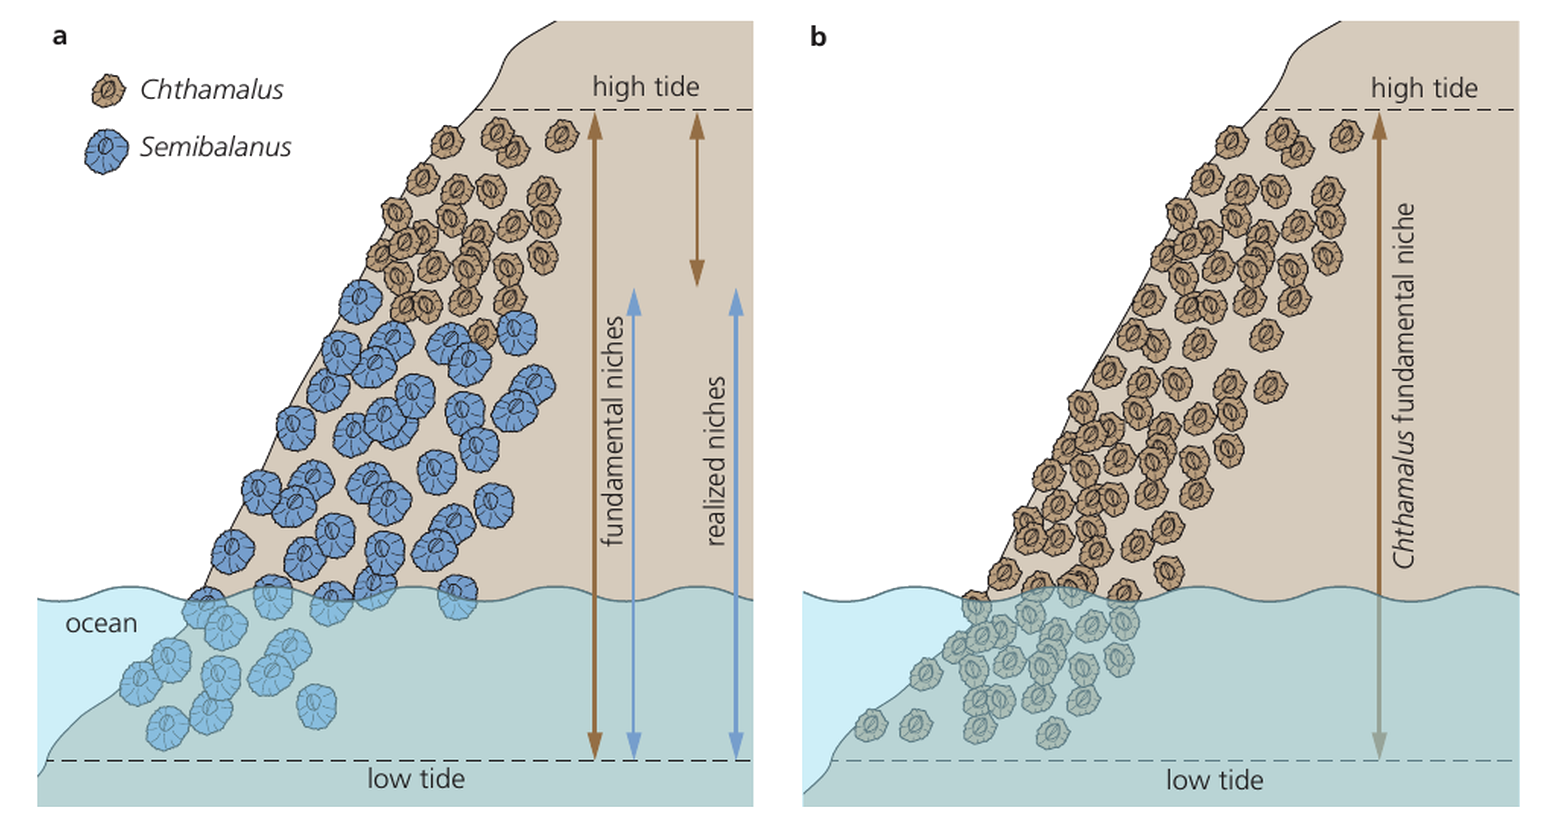
Semibalanus absent high on shore even when competitors are removed
desiccation restricts its fundamental niche
Chthamalus normally occupies upper shore
its observed realized niche is narrow
removing Semibalanus lets Chthamalus survive lower down
Semibalanus competition excludes Chthamalus from part of its fundamental niche
The fundamental niche is the range tolerated without biotic exclusion. The realized niche is the range actually occupied after competition and other biotic interactions.
Expected Counts Describe No Association
For two species scored present or absent in random quadrats, the null hypothesis H₀ states that their distributions are independent: there is no association between presence of one and presence of the other.
200 quadrats
Bell present
Bell absent
Row total
ling present
89
45
134
ling absent
31
35
66
column total
120
80
200
E=grand totalrow total×column total
Expected both present = (134 × 120) ÷ 200 = 80.4. Keep expected values unrounded during the calculation so rounding does not distort χ².
Chi-Squared Measures Departure from Independence
χ2=∑E(O−E)2
Cell
O
E
(O−E)²/E
both present
89
80.4
0.920
ling present, bell absent
45
53.6
1.380
ling absent, bell present
31
39.6
1.868
both absent
35
26.4
2.802
sum
6.97
For a 2 × 2 table, df = (2−1)(2−1) = 1. At p = 0.05 the critical value is 3.84. Because 6.97 > 3.84, reject H₀: the species show a statistically significant association.
Association is not proof of competition or causation. The species may respond to the same abiotic factor or interact in another way; biological evidence must identify the mechanism.
Predator Peaks Follow Prey Peaks
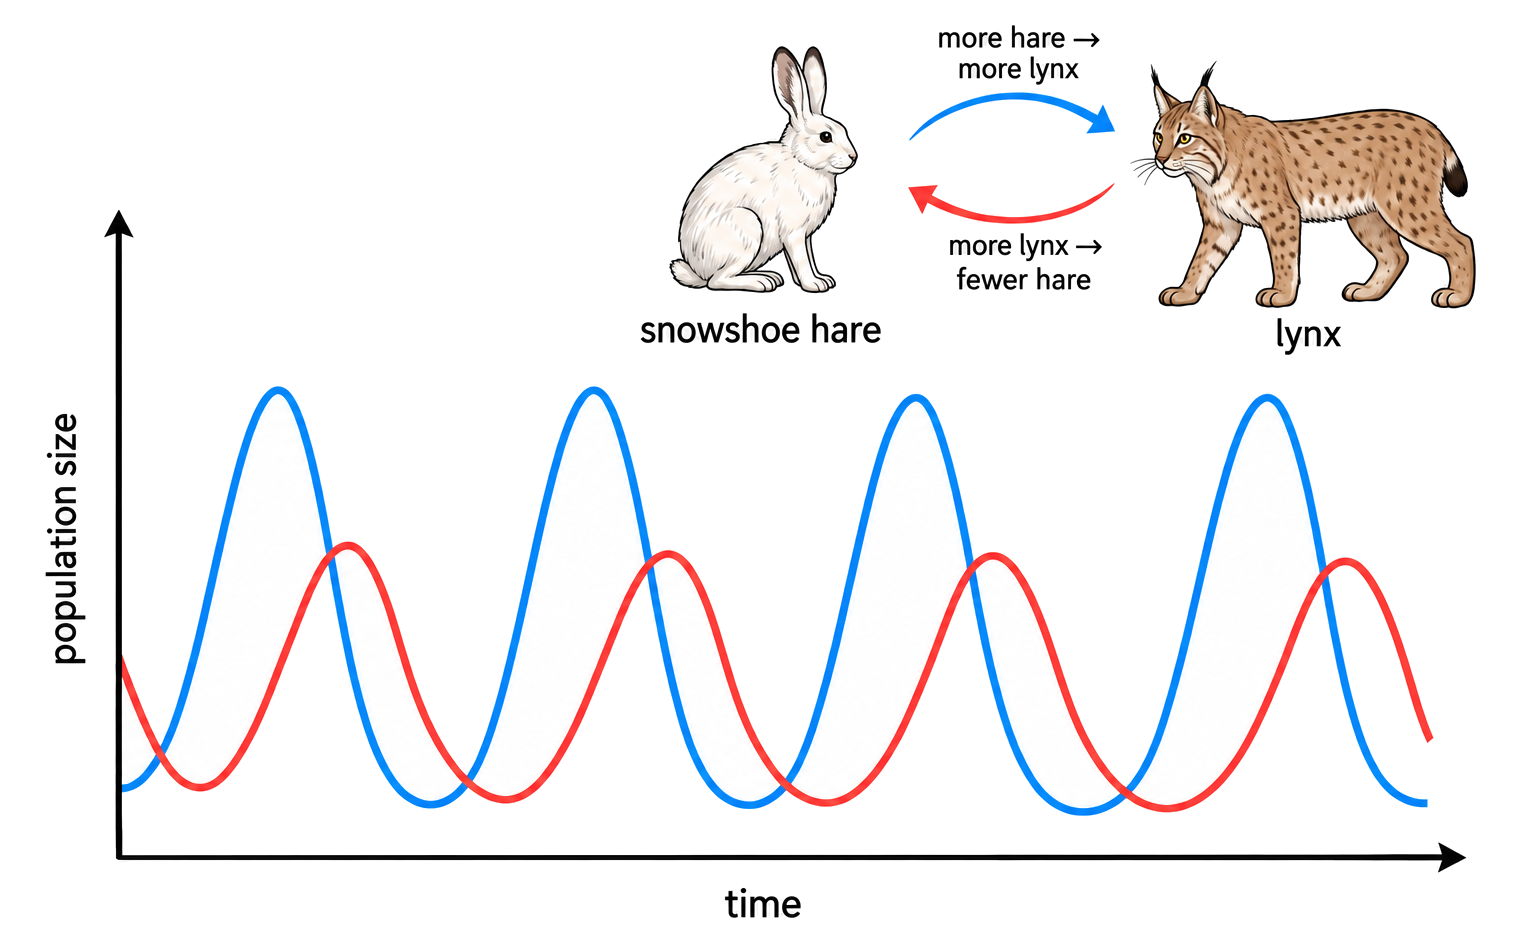
more hare → more food raises lynx survival and reproduction after a delay → more lynx increases hare mortality → fewer hare reduce food for lynx after a delay → lynx decline → reduced predation allows hare recovery
The predator curve lags behind the prey curve because births, maturation and deaths take time. Predation is density-dependent, but weather, vegetation and other predators can also affect the real cycle.
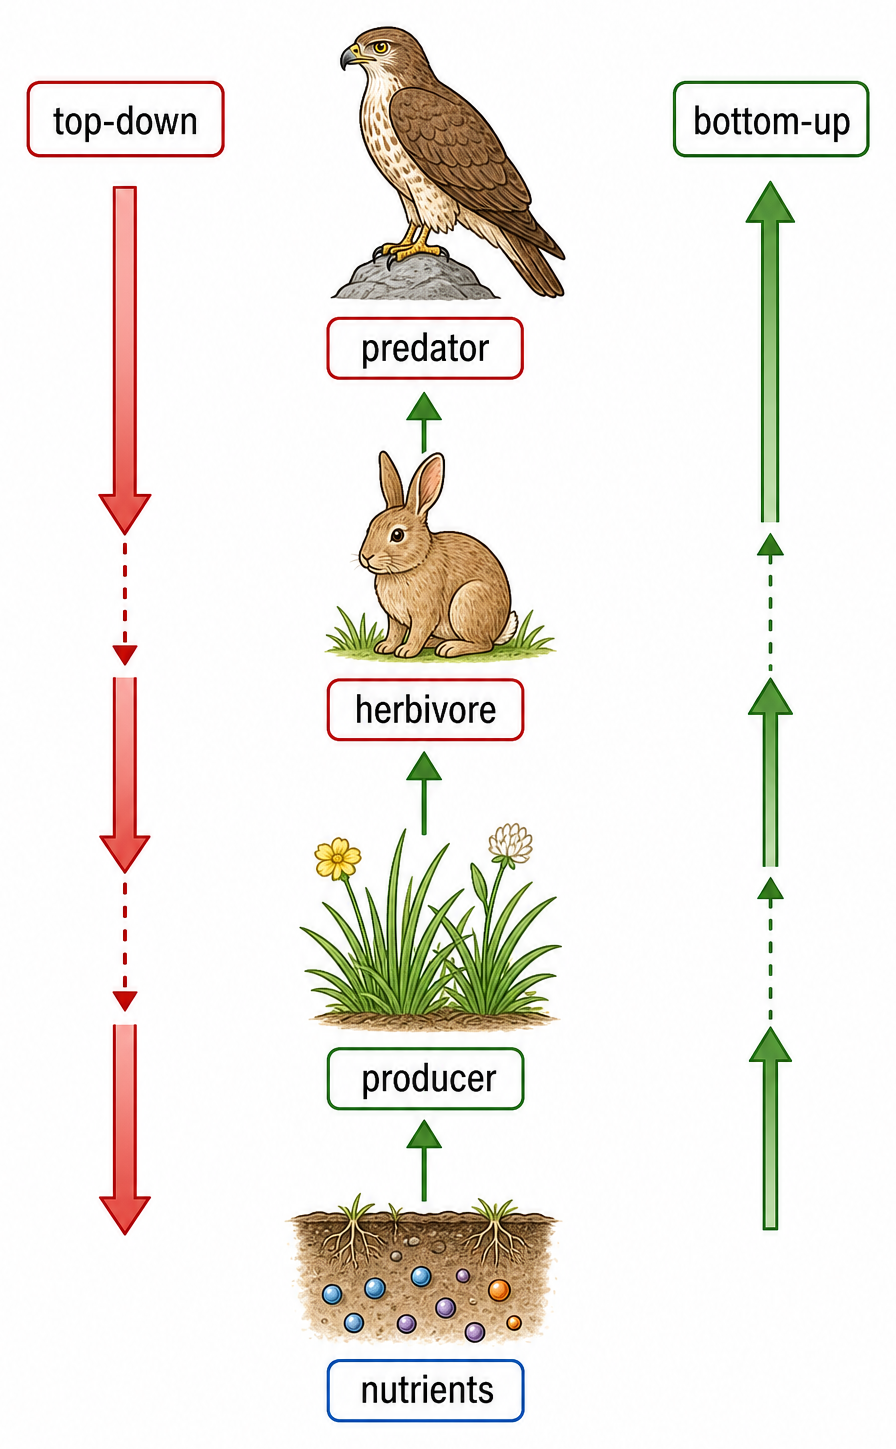
Top-Down and Bottom-Up Control Begin at Opposite Ends
Control
Initial change
Example cascade
top-down
predator abundance or predation
fewer predators → more herbivores → fewer producers
Identify where the disturbance begins, then follow its direct resource or predation effects one trophic level at a time. Many communities contain both controls, but one may dominate under particular conditions.
Allelochemicals Suppress Competitors at a Distance
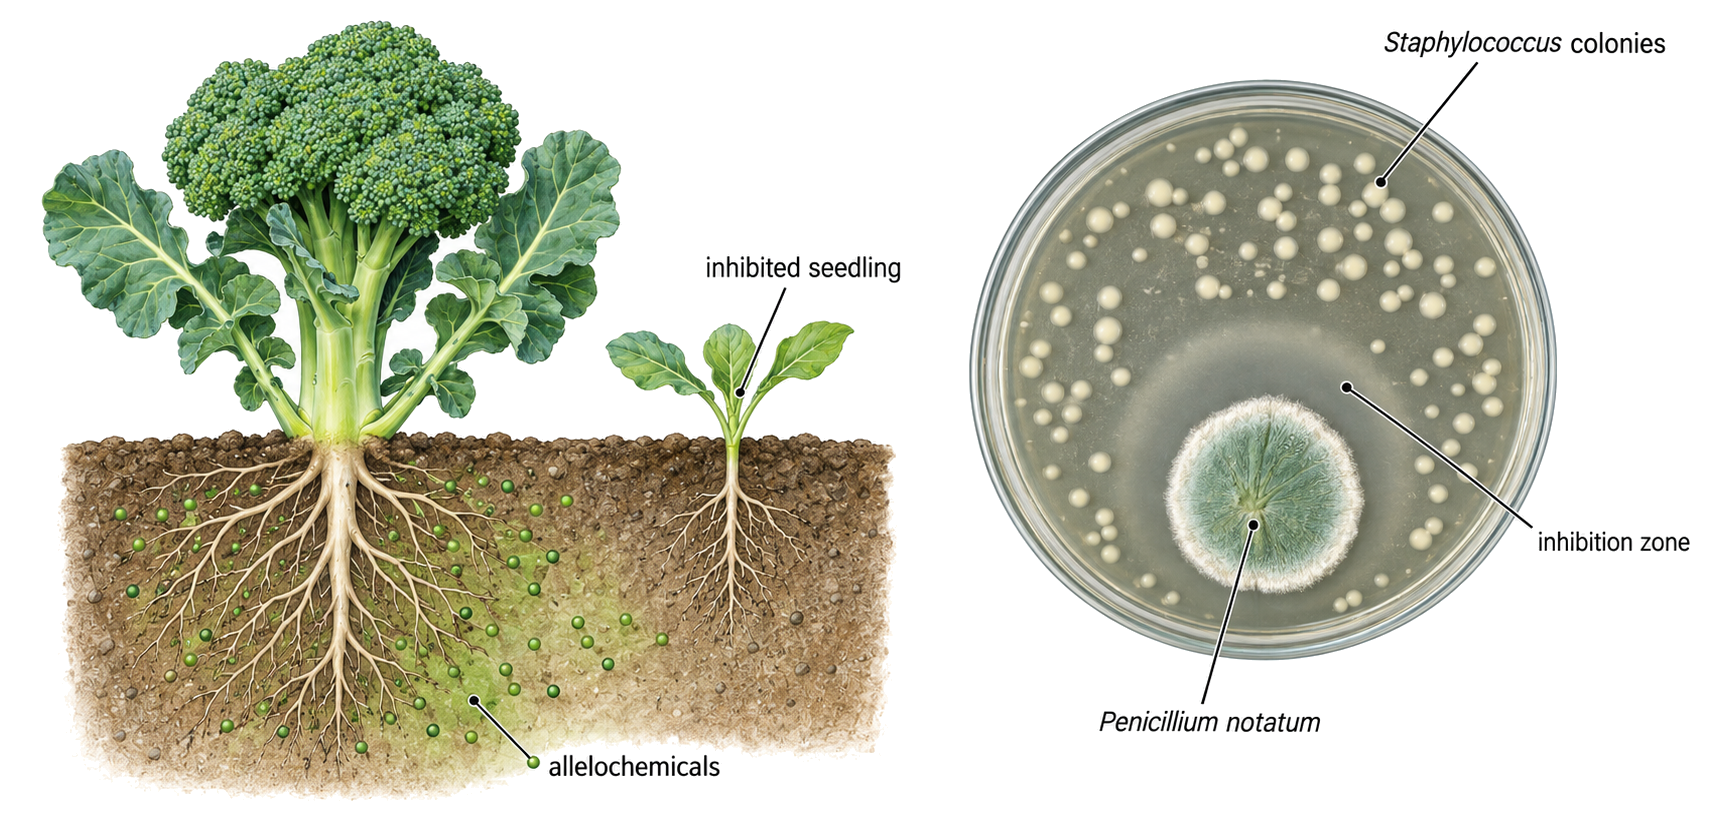
Allelopathy is chemical inhibition of another organism. An allelopathic plant releases an allelochemical that reduces a competitor's germination, photosynthesis or growth.
Release route
How a neighbour is exposed
root exudate
chemical diffuses through soil and is absorbed by roots
volatile release from leaves
gas reaches nearby shoots
decomposing litter
compounds enter soil as leaves break down
Broccoli residues can inhibit later brassica seedlings, so crop rotation reduces carry-over effects. Dense bracken stands release compounds that help exclude other plants and can reduce local diversity.
Poor growth beside a plant does not prove allelopathy; shading, water use and mineral competition must be controlled or measured.
An Antibiotic Can Be an Ecological Competition Chemical
Microbes also compete chemically. Penicillium releases penicillin, which inhibits susceptible bacteria nearby and reduces their competition for space and nutrients.
On an agar plate, a clear zone of inhibition around the fungal colony shows that a diffusible substance prevents bacterial growth. Zone size also depends on diffusion and dose, so it is not a direct measure of ecological success by itself.
Humans use antibiotics as medicines, but their original biological role is an interaction among organisms in a community.
Explain Community Change with Signs, Mechanism and Evidence
Question
What a strong explanation identifies
Who interacts?
populations and whether each gains or loses
What is transferred or limited?
food, habitat, nutrients, protection, disease or a chemical
Where does change begin?
individual pair, predator level, producer/resource level or introduced species
How does it propagate?
competition, feedback, trophic cascade or niche restriction
What supports causation?
manipulation, control, replication and a predicted response
What supports association?
representative sampling, expected counts and a statistical decision
Use observations to find a pattern, statistics to judge whether it is unlikely under a null model, and experiments or field manipulations to test the proposed mechanism.
Community structure emerges from many population interactions. Naming a relationship is only the start; explanation requires its mechanism, direction of effect, feedback through the network and the limits of the evidence.
Populations exam focus
1 mark
State the biological term for a group of organisms of the same species living in an area.
Population size estimation
6 marks
Discuss how wild fish populations are assessed to ensure sustainable fishing practices.
Random quadrat sampling
3 marks
Describe a method that can be used to measure the diversity of herbaceous plants in one of the green areas at different distances from the main road.
Capture-mark-release-recapture exam focus
6 marks
Explain the technique used to estimate the population size of a named species of organism that is able to move.
Carrying capacity
7 marks
Explain why populations that have grown exponentially reach a maximum size, rather than continue to grow.
Negative feedback control
2 marks
Explain the change in numbers of the cactus moth throughout the study period.
Population growth curves
6 marks
Discuss the factors affecting population growth that can result in an exponential growth curve.
Competition vs. cooperation
2 marks
Compare and contrast the frequency of monopoly and fighting when there is a change from two trays to one tray of food.
Community exam focus
3 marks
Compare and contrast the community structure within and outside the marine protected area.
Interspecific relationships
3 marks
Evaluate whether crop yield may be improved through enhancement of pollinator richness.
Mutualism as interspecific relationship
3 marks
Analyse the relationship between plants and their pollinators.
Endemic vs. invasive species
6 marks
Discuss, giving an example, the possible effects of the introduction of an alien species into an ecosystem.
Tests for interspecific competition
3 marks
Explain the results shown in this experiment.
Chi-squared test
3 marks
Outline how chi-squared can be used to test for an association between the distributions of the two species.
Predator-prey relationships
3 marks
Describe the effect of removing trout on frog density in Upper and Lower LeConte Lakes.
Top-down vs. bottom-up control
3 marks
Explain how nutrients can have a positive or negative bottom-up effect on seagrass.
Allelopathy and antibiotics
3 marks
Explain how a named plant can reduce competition by allelopathy.