C4.1.15—Chi-squared test

Chi-squared test explains how ecological evidence links organisms, resources and interactions to population size, distribution or community structure in a habitat.

Syllabus
First assessment 2025
Objective
C4.1.15
Level
SL

Exam analysis

Chance of appearing3%of analysed past papers
Latest appearanceMay 2023
Most common paperPaper1
Typical marks1–3

Common command terms

  • Identify
  • Outline
  • Determine
  • Explain
  • Calculate
  • State

Scoring notes

Common mistake
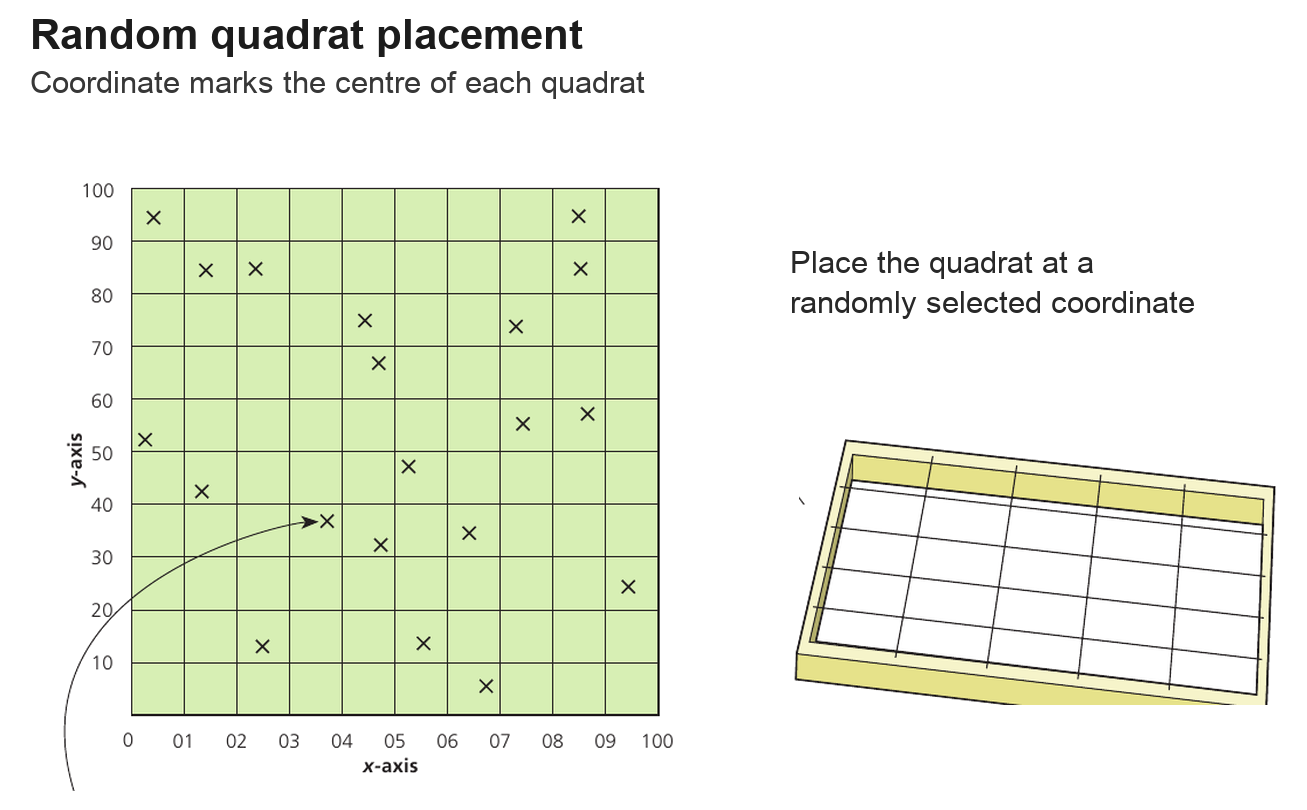
Using non-random sampling when the estimate requires representative quadrat positions.
Recent exam appearances

May 2023Paper1 ["SL"] · TZ221[ 1 ]C4.1.15—Chi-squared test
May 2022Paper1 ["SL"] · TZ217[ 1 ]C4.1.15—Chi-squared test
November 2018Paper1 ["SL"] · TZ024[ 1 ]C4.1.15—Chi-squared test
May 2018Paper3 ["SL"] · TZ22(b)[ 3 ]C4.1.15—Chi-squared test
Practice this objective

Coverage 2018–2023 · Updated 16 Jul 2026

Chi-squared tests compare observed and expected counts

A chi-squared test can test whether presence or absence of species A is associated with presence or absence of species B across several sampling sites.
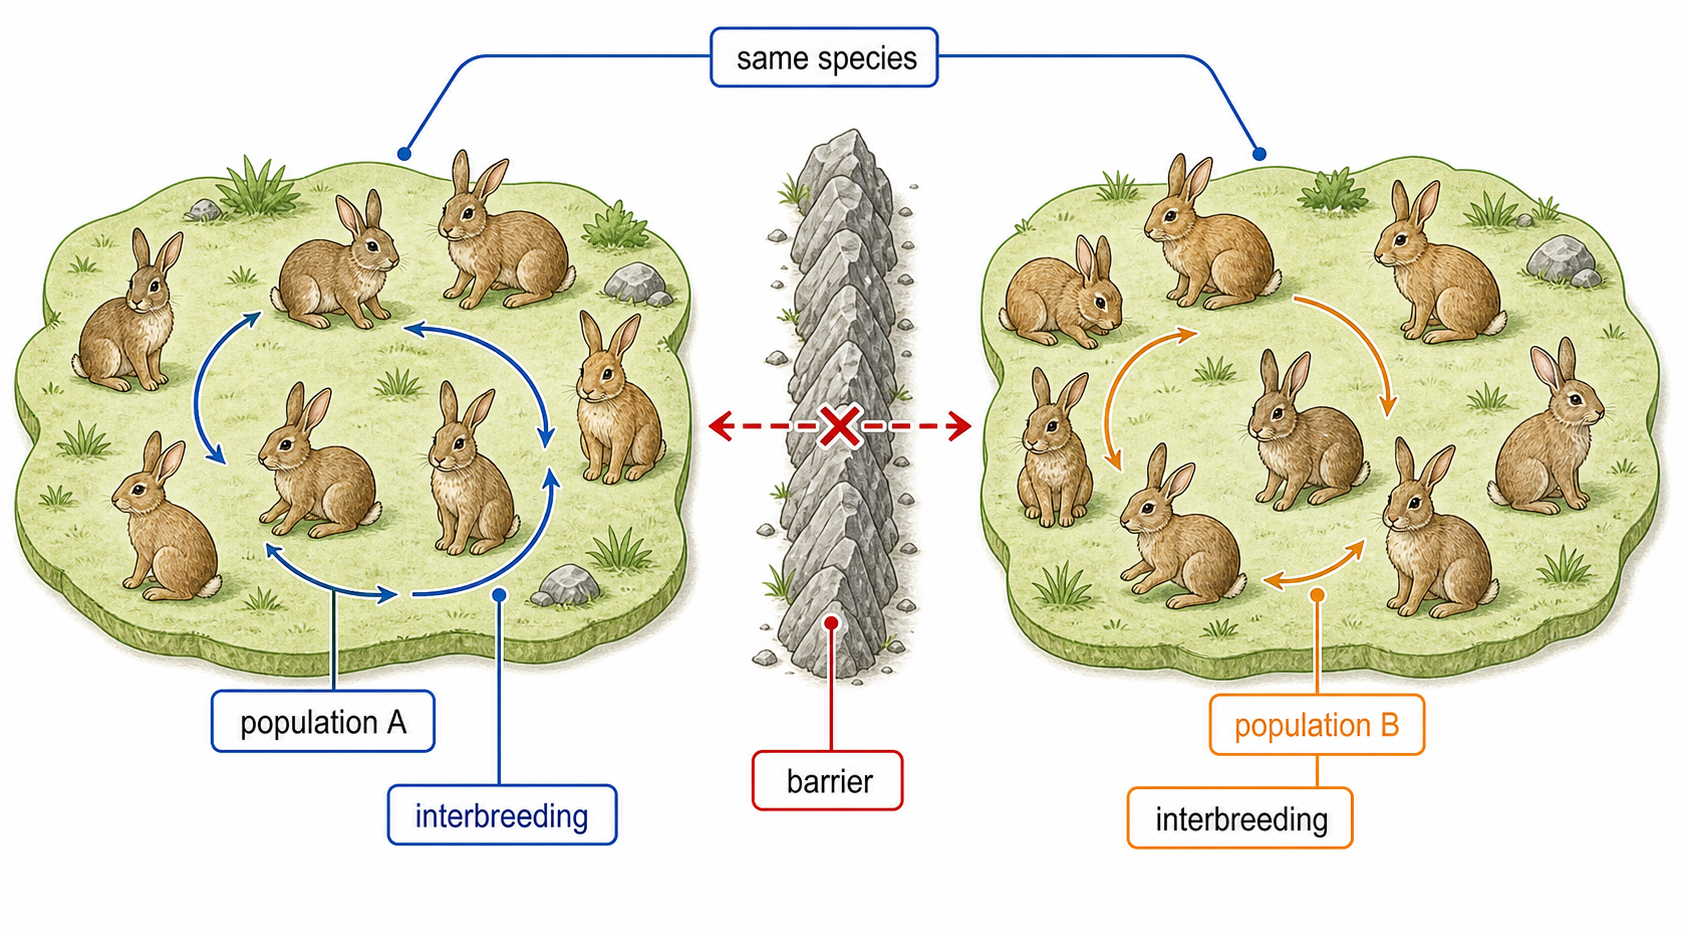
Build a 2 × 2 table: both present, A only, B only, neither. Null hypothesis: the species' distributions are independent. Calculate each expected count as (row total × column total) ÷ grand total.

χ2=Σ((observedexpected)2÷expected);degreesoffreedom=(rows1)(columns1)=1fora2×2table.χ² = Σ((observed − expected)² ÷ expected); degrees of freedom = (rows − 1)(columns − 1) = 1 for a 2 × 2 table.

Compare calculated χ² with the chosen critical value or p-value. A significant result rejects independence and supports an association between distributions.

Association does not prove interspecific competition: both species may respond to the same abiotic factor, or association may reflect another interaction. Sampling sites must be independent and expected counts suitable for the test.

Chi-squared test

Assessment in practice

1 marks
How it is assessed

This objective is assessed through structured response, commonly using Identify / Outline / Determine.

Command terms

Identify / Outline / Determine / Explain / Calculate / State

What earns marks

Build the answer around this relationship: Chi-squared test must be linked to the correct ecological unit, method or species interaction.

Watch for

Using non-random sampling when the estimate requires representative quadrat positions.

Representative question

Question 1

[Maximum number: 3]

Outline how chi-squared can be used to test for an association between the distributions of the two species.

Populations and Communities

  • A population is one species in an area; a community is all interacting populations there.
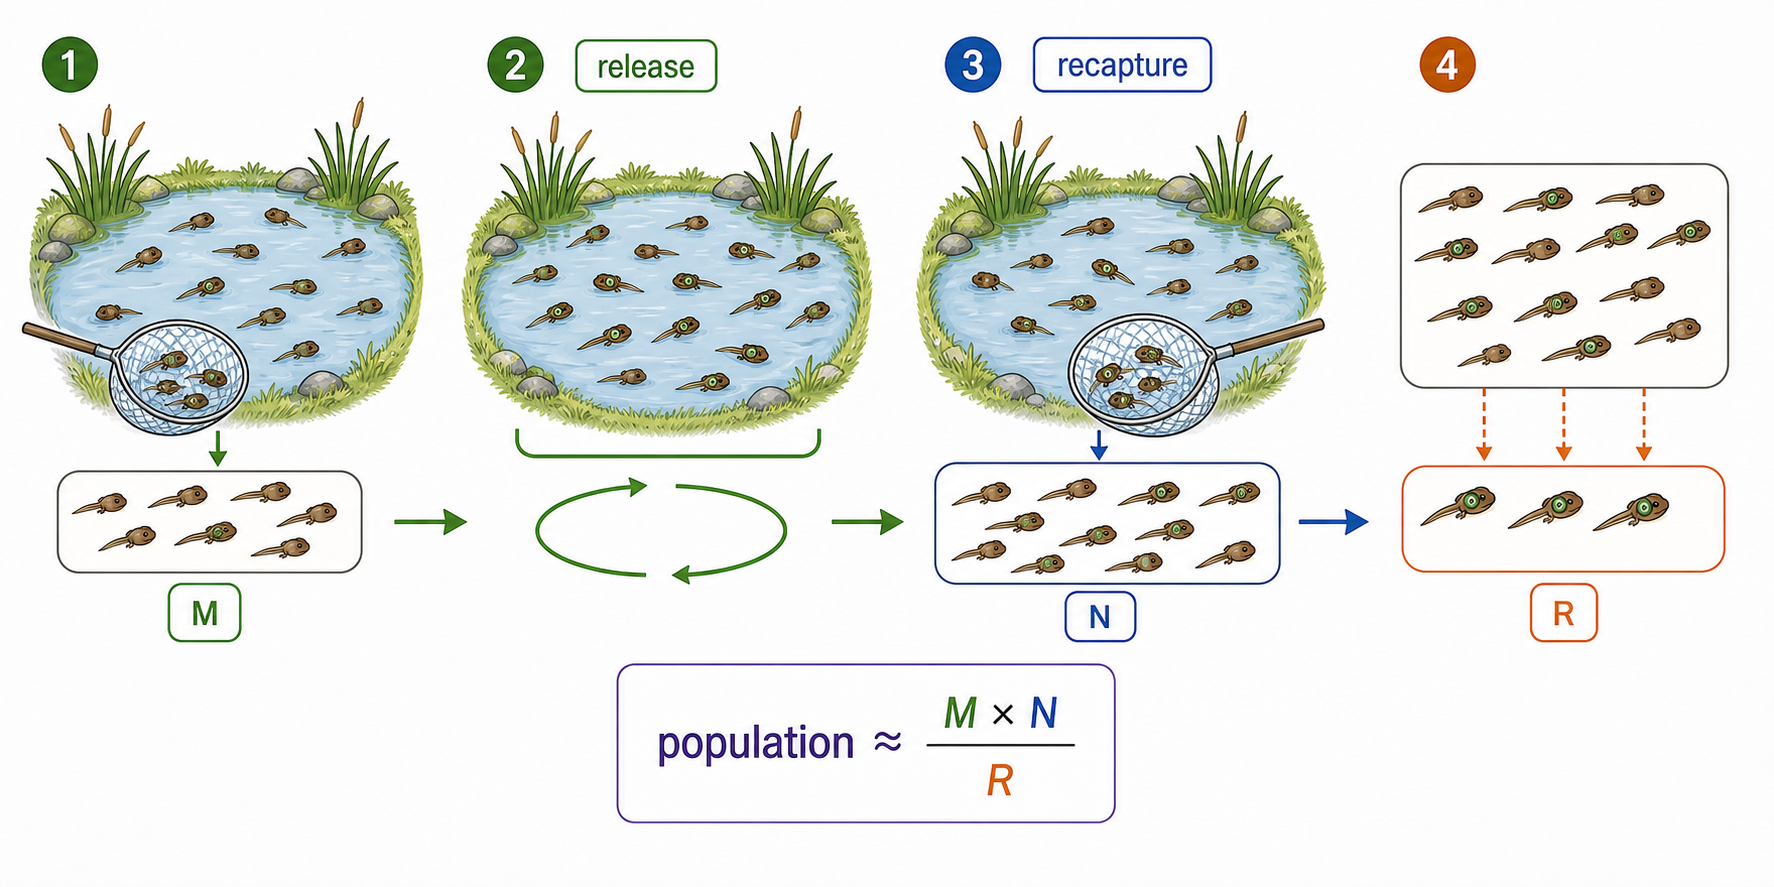
  • Estimate abundance with unbiased sampling: quadrats for sessile organisms and capture–mark–release–recapture for mobile animals, checking each method’s assumptions.
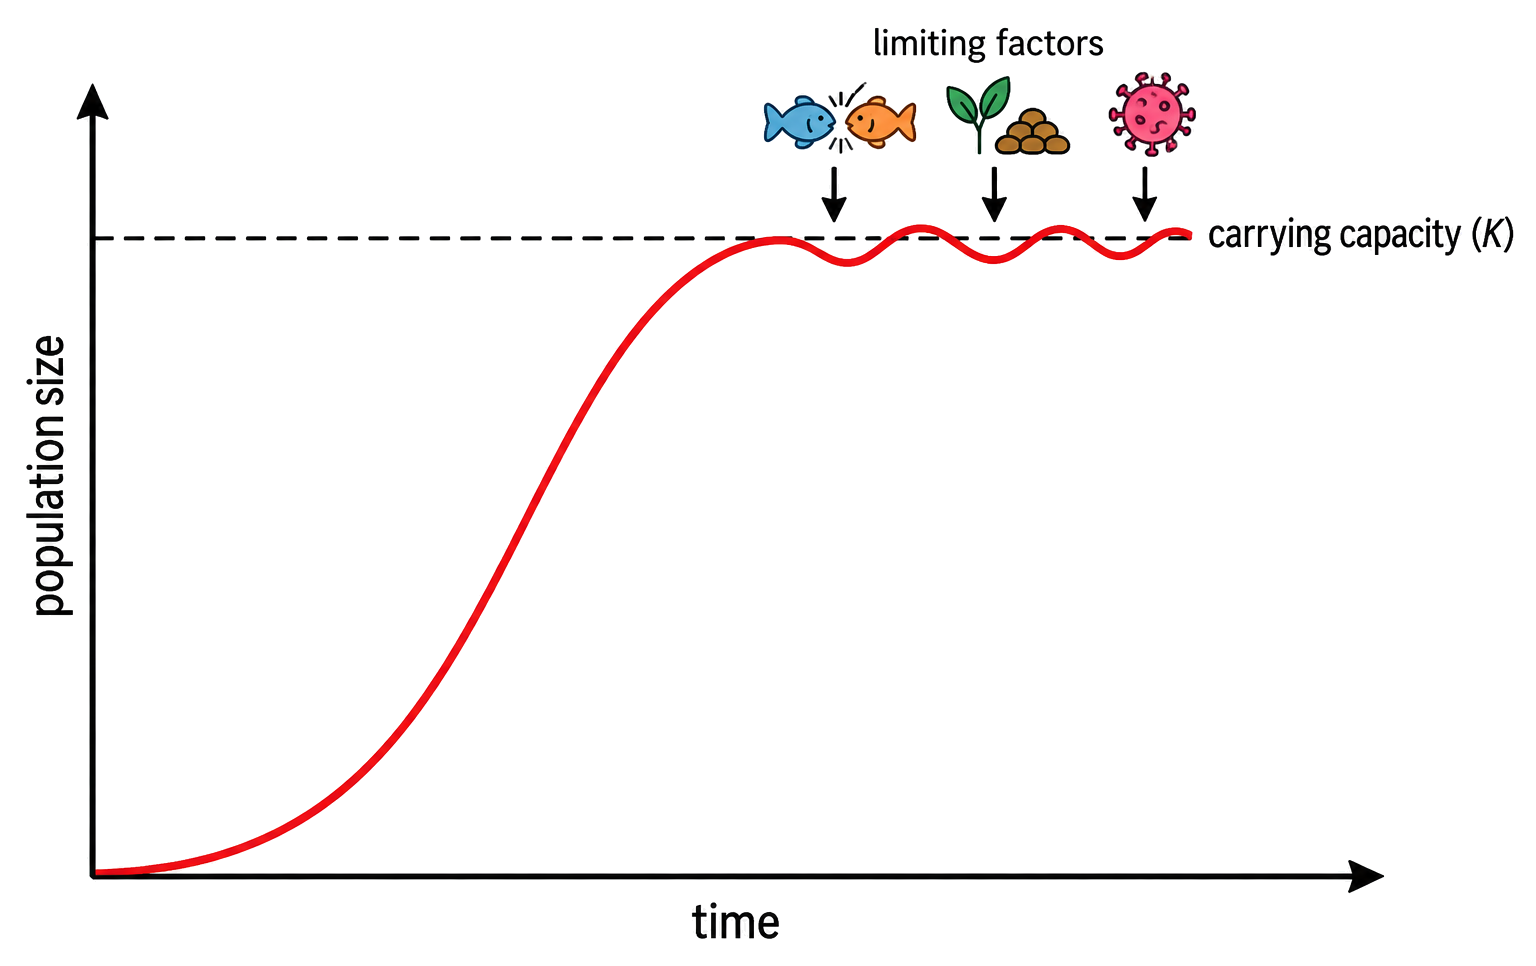
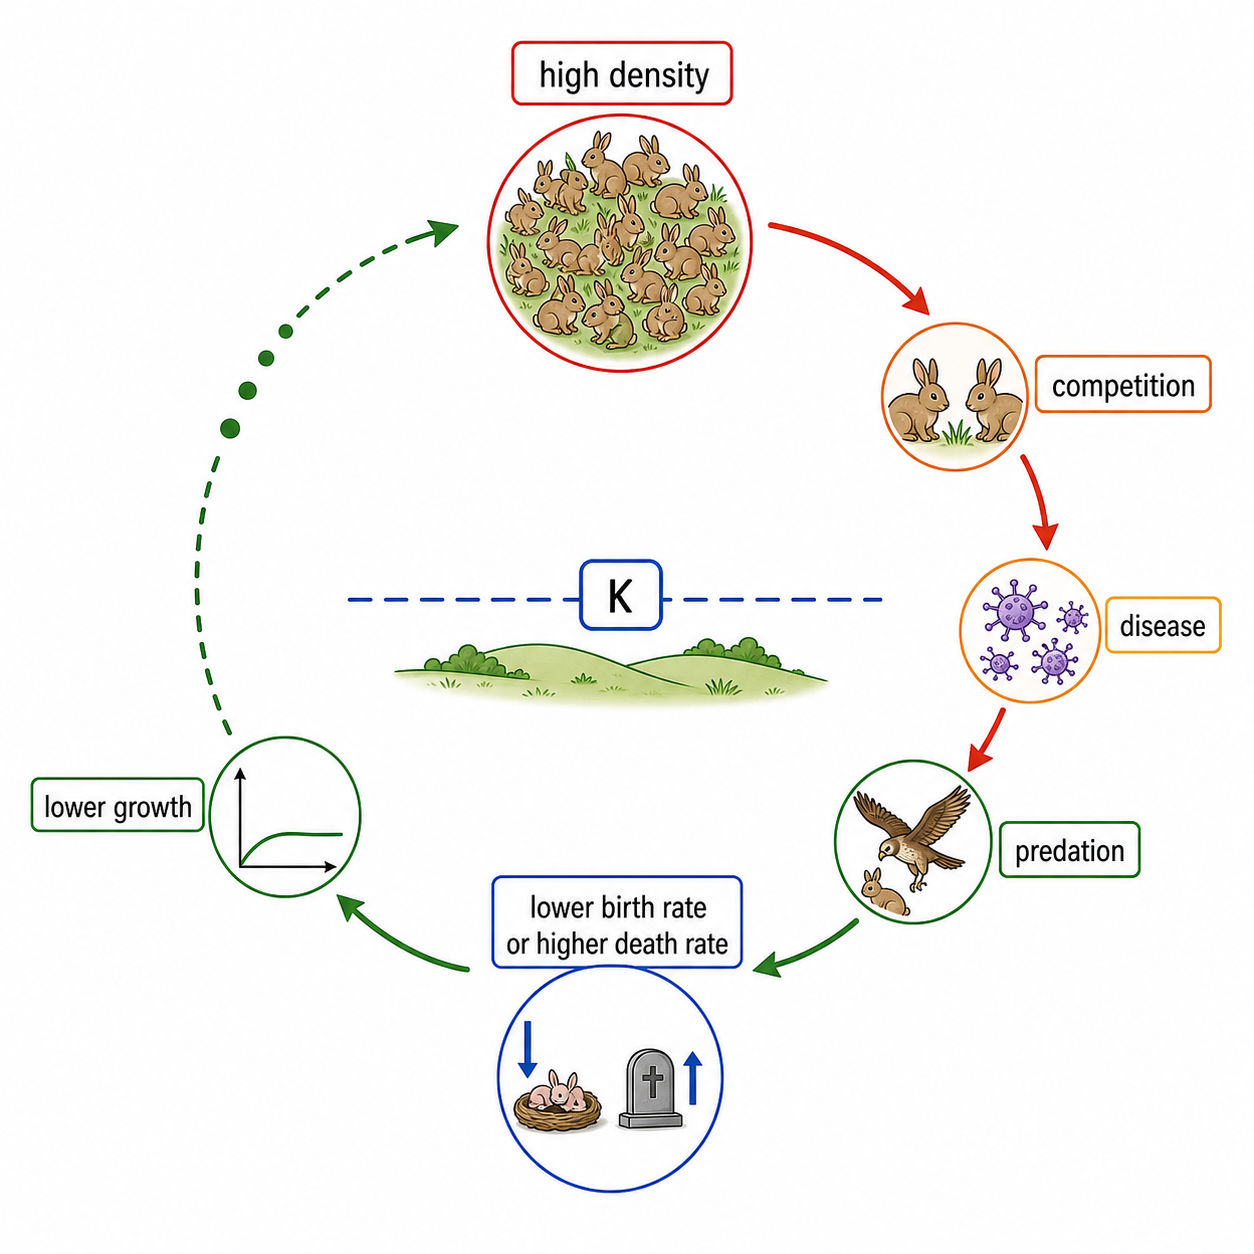
  • Density-dependent competition, predation, disease and waste create negative feedback around carrying capacity; exponential growth slows into a sigmoid curve as limits strengthen.
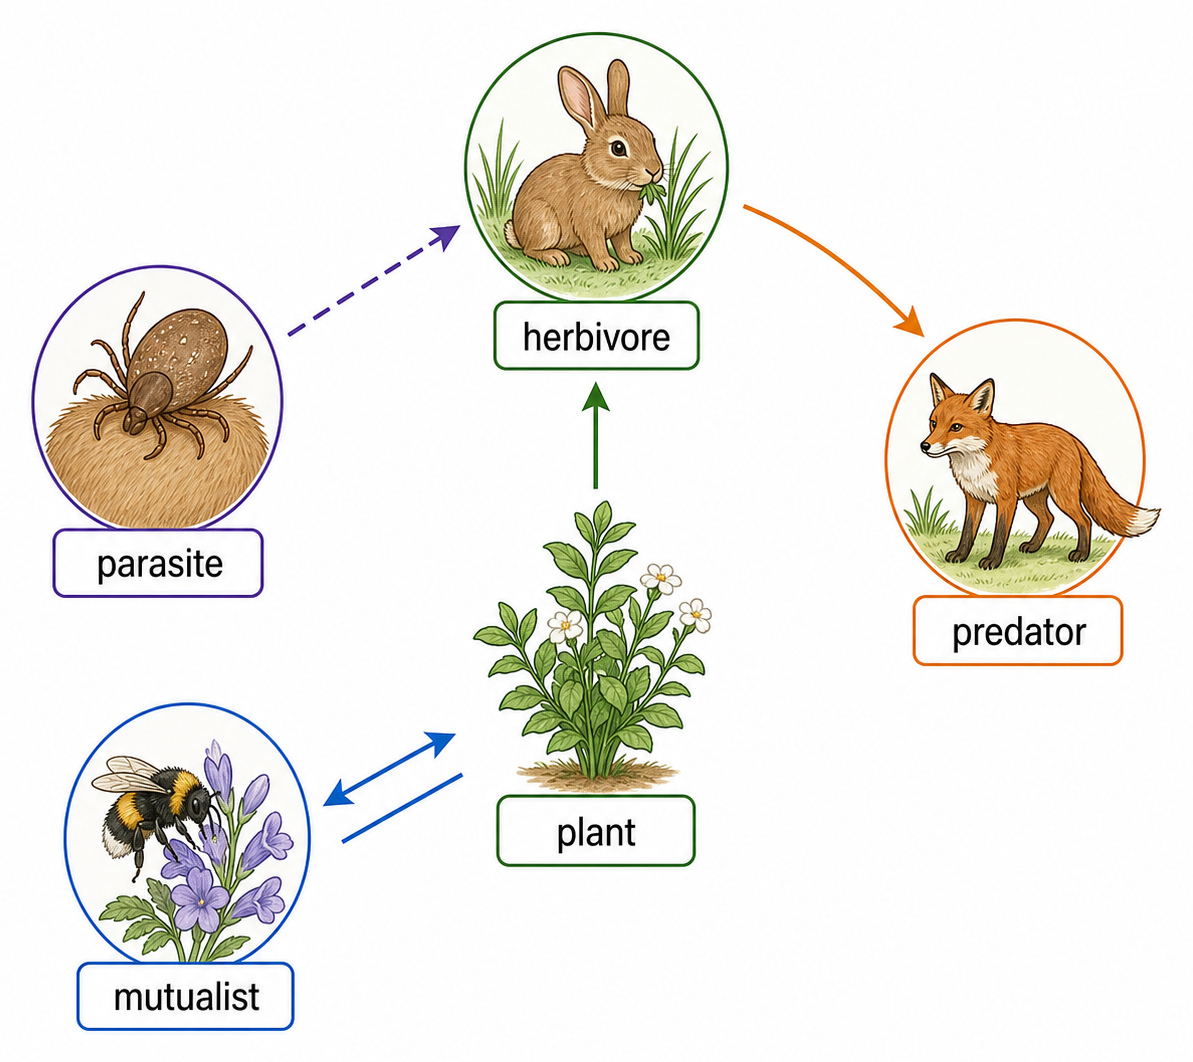
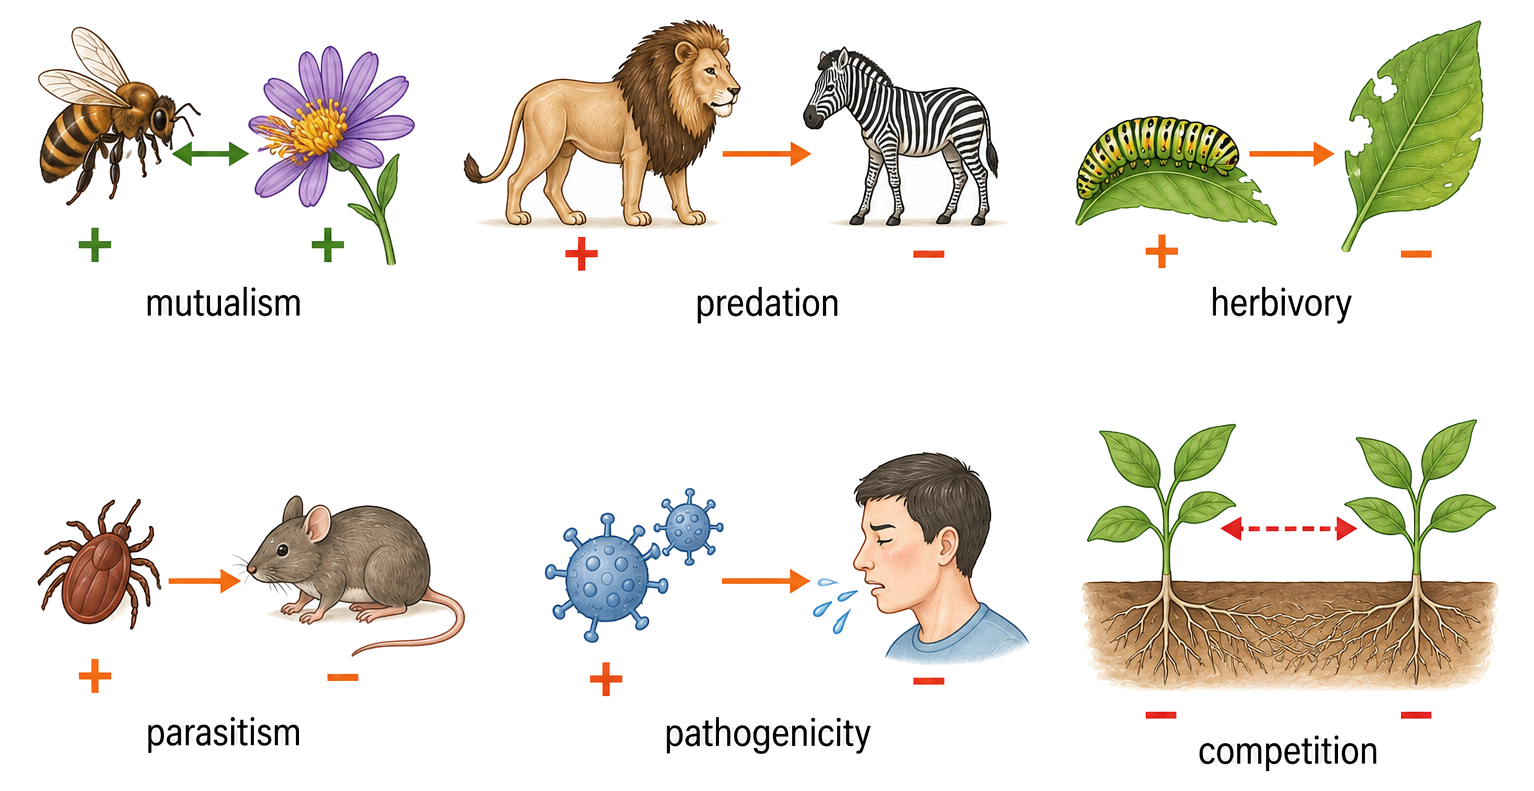
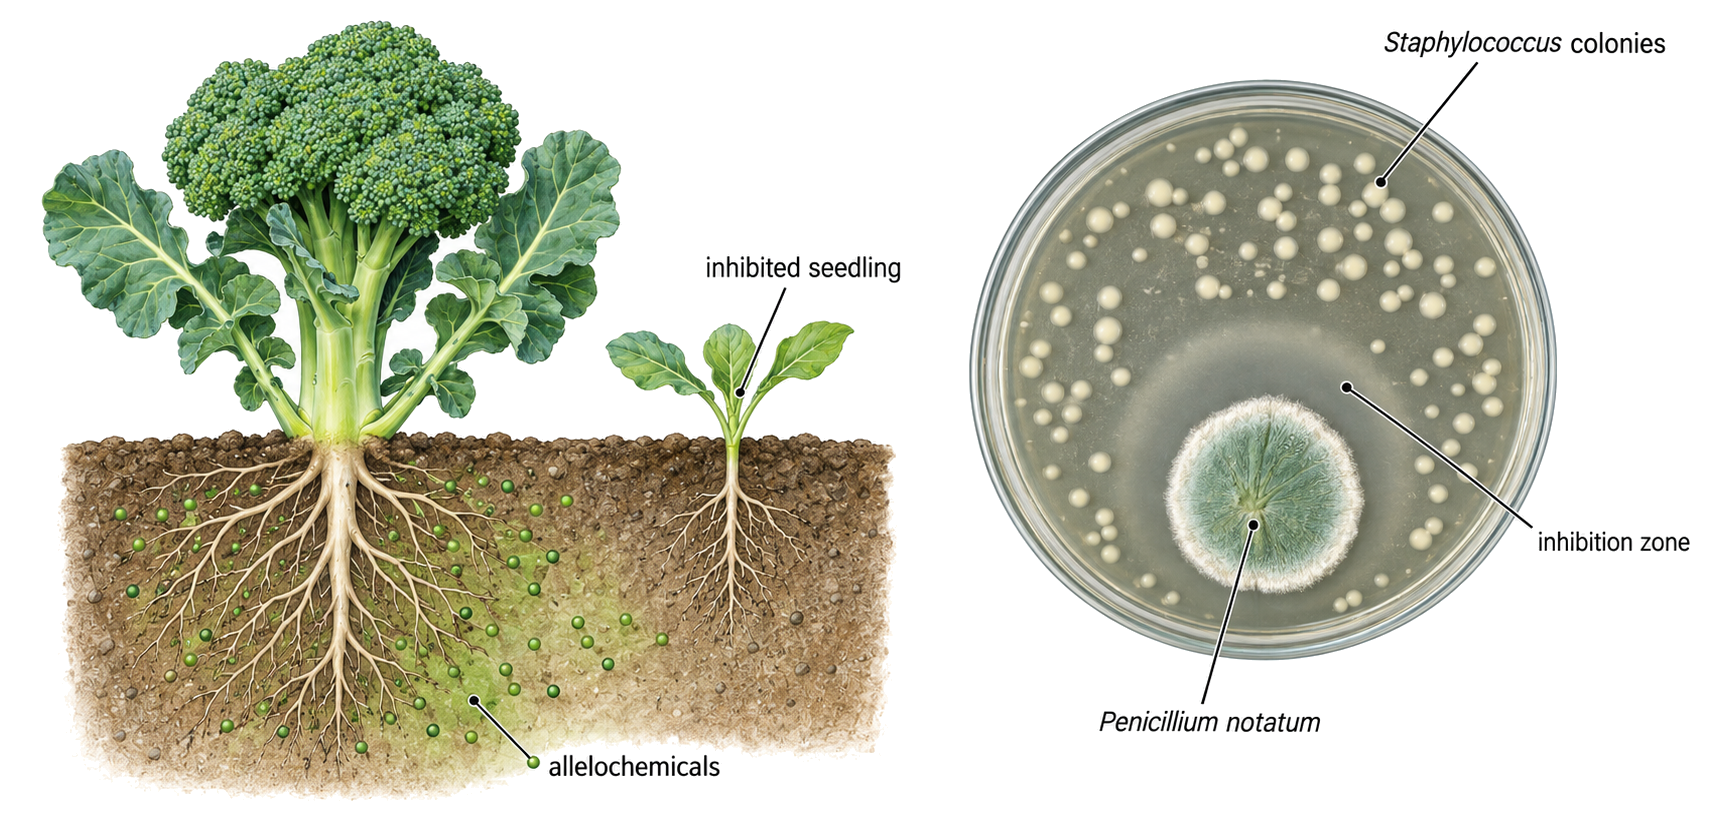
  • Classify interspecific relationships by costs and benefits: predation, herbivory, competition, mutualism, parasitism and pathogenicity.
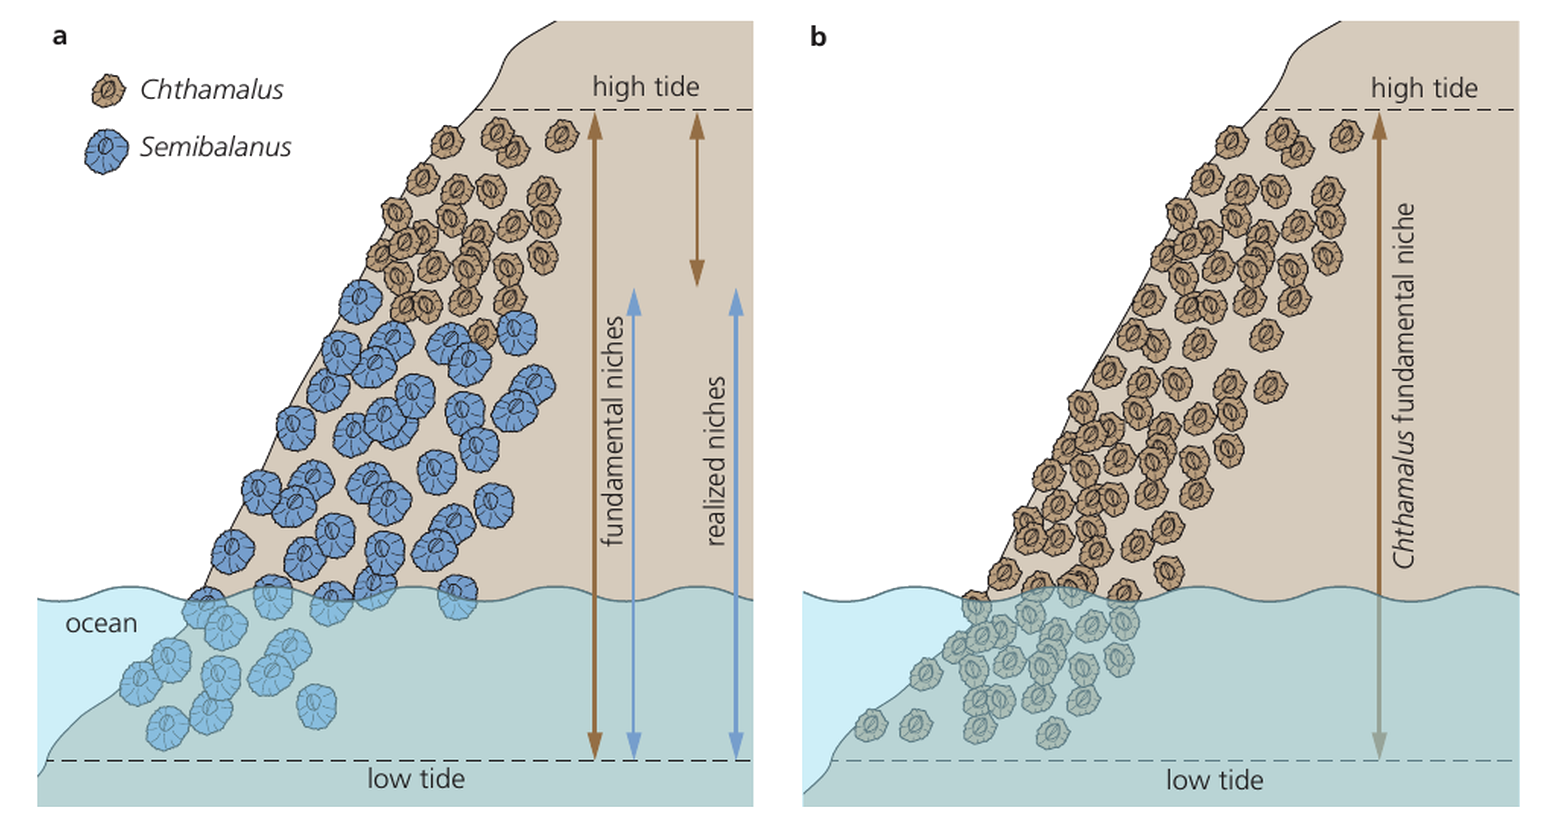
  • Invasive species may escape controls and displace endemic species. Removal experiments can reveal competition and fundamental versus realized niches.
  • Chi-squared tests assess species association from observed and expected quadrat counts.
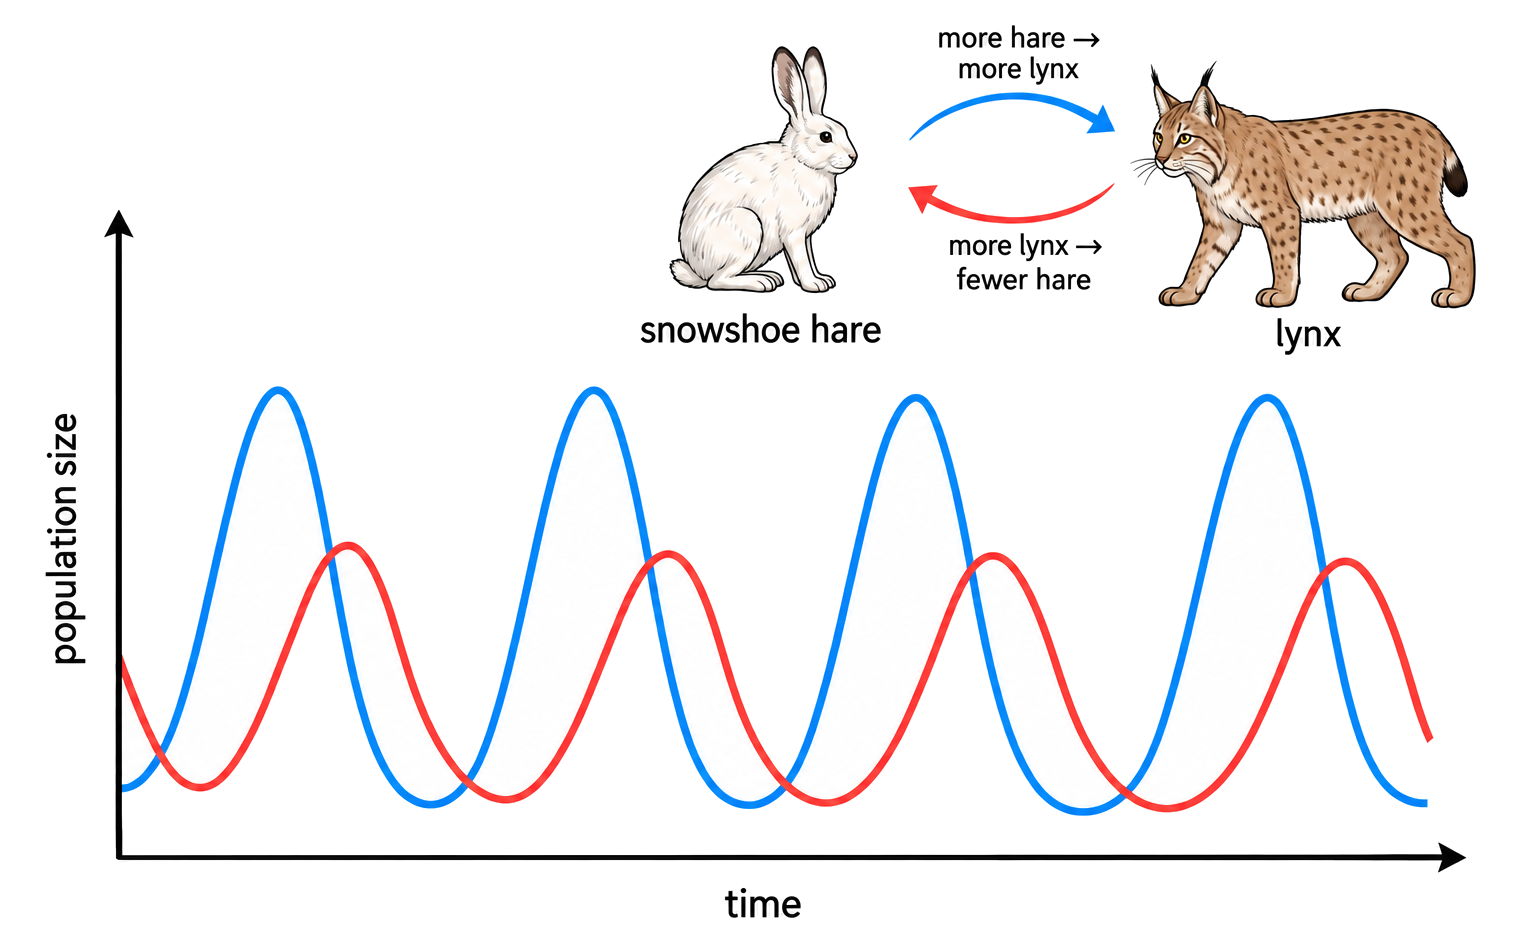
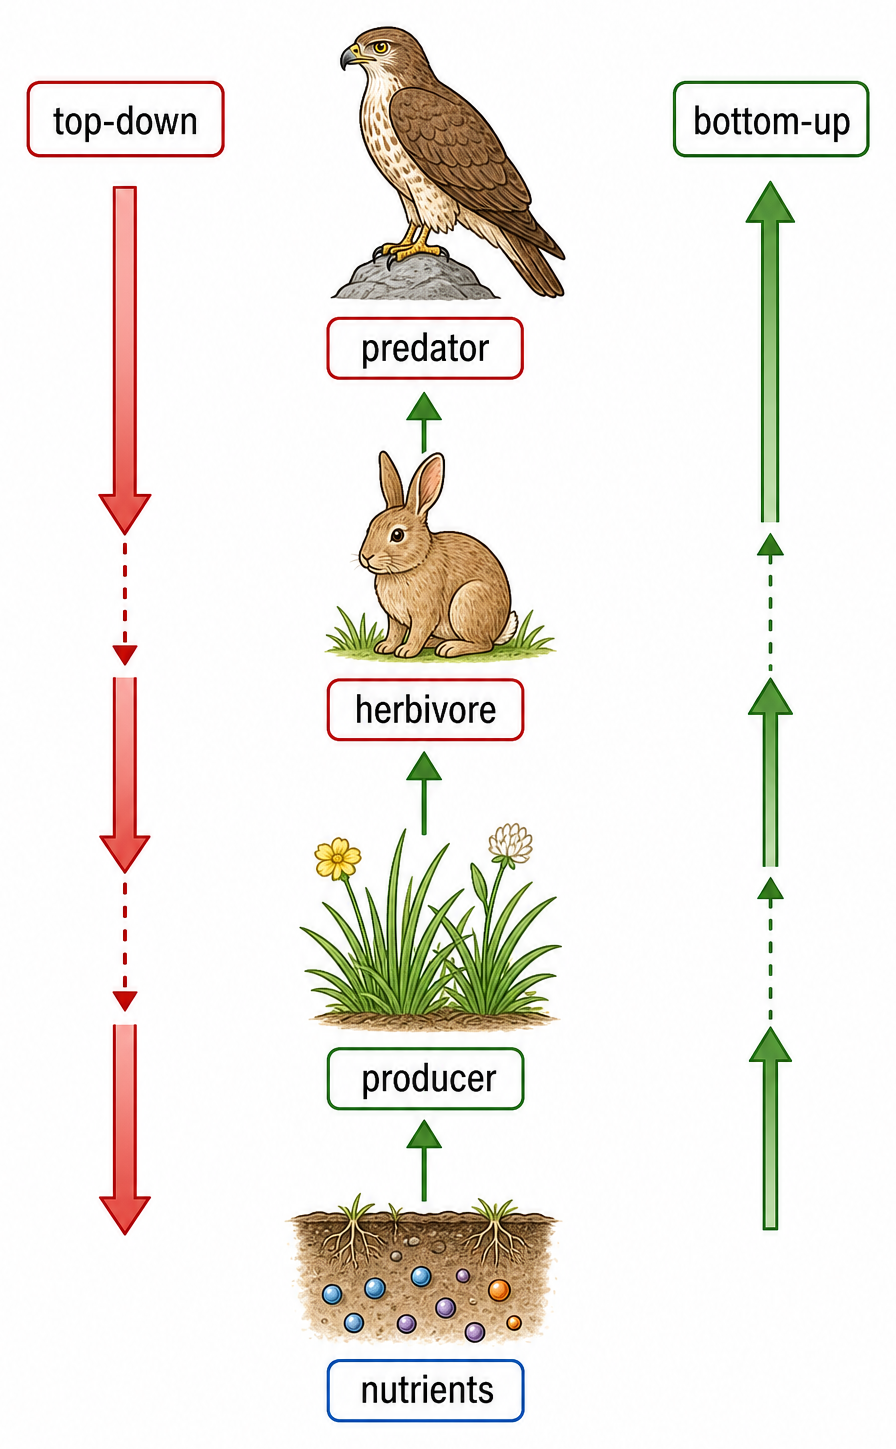
  • Predator peaks usually lag prey peaks; top-down control begins with consumers, while bottom-up control begins with resources or producers.

Concept essentials

  • Chi-squared test must be linked to the correct ecological unit, method or species interaction.
  • The evidence for chi-squared test depends on measurable abundance, distribution, survival or resource patterns.
  • Chi-squared test is clearest when cause, ecological process and population outcome are kept distinct.
  • Field or graph evidence for chi-squared test needs biological interpretation, not values alone.