Q BankQuestion BankDocsDocuments

C4.1.7—Population growth curves

Population growth curves explains how ecological evidence links organisms, resources and interactions to population size, distribution or community structure in a habitat.

Syllabus
First assessment 2025
Objective
C4.1.7
Level
SL

Exam analysis

Chance of appearing4%of analysed past papers
Latest appearanceNovember 2015
Most common paperPaper2
Typical marks1–4

Common command terms

  • Draw
  • Identify
  • Label
  • Outline
  • State
  • Explain
  • Discuss
  • Suggest
  • Compare

Scoring notes

Common mistake
Confusing a population with a community or with all organisms in an ecosystem.

Recent exam appearances

November 2015Paper2 ["SL"] · TZ03(a)[ 1 ]C4.1.7—Population growth curves
May 2015Paper1 ["SL"] · TZ122[ 1 ]C4.1.7—Population growth curves
November 2014Paper2 ["SL"] · TZ04(a)(ii)[ 2 ]C4.1.7—Population growth curves
November 2014Paper2 ["SL"] · TZ04(a)(i)[ 1 ]C4.1.7—Population growth curves
November 2013Paper2 ["SL"] · TZ06(a)[ 4 ]C4.1.7—Population growth curves
Practice this objective

Coverage 2010–2015 · Updated 16 Jul 2026

Growth curves show changing net population rate

Growth curves show changing net population rate.

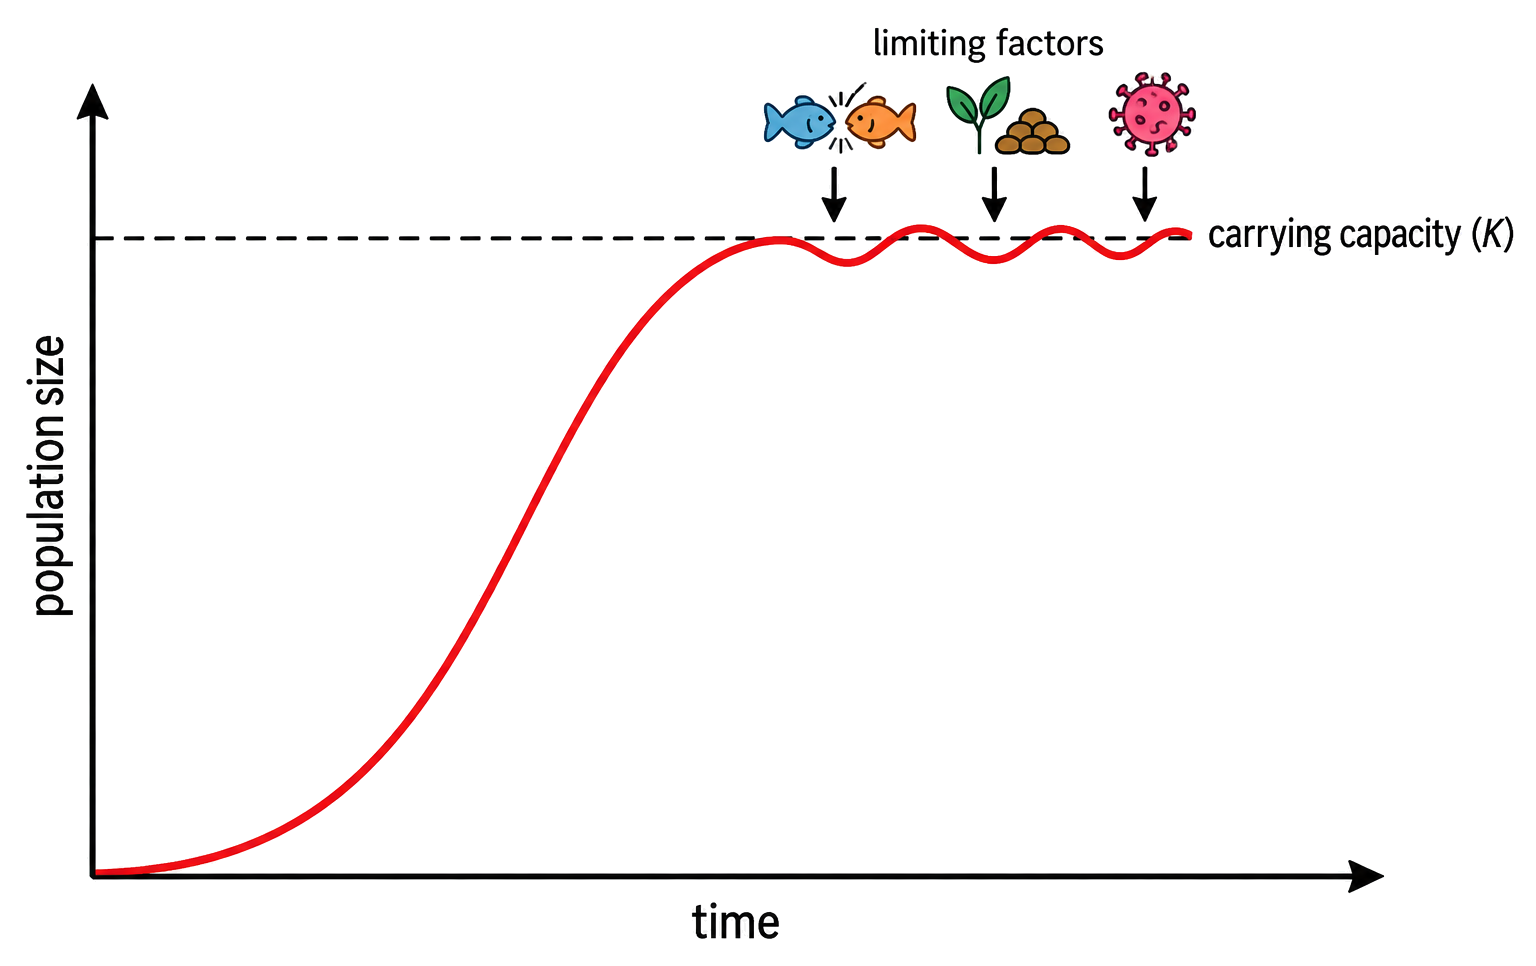
A population may show lag, rapid growth and then slowing as limiting factors intensify. The slope represents net change, not simply the number of organisms present.

read slope; identify phase; connect phase to resources and density; note scale.

A newly introduced species may grow slowly at first, rise steeply when resources are abundant and flatten near capacity.

A steep curve does not mean the population is largest; it means it is changing fastest.

Population growth curves

Assessment in practice

1–3 marks
How it is assessed

This objective is assessed through essay response, commonly using Draw / Identify / Label.

Command terms

Draw / Identify / Label / Outline / State / Explain / Discuss / Suggest / Compare

What earns marks

Build the answer around this relationship: Population growth curves must be linked to the correct ecological unit, method or species interaction.

Watch for

Confusing a population with a community or with all organisms in an ecosystem.

Representative question

Question 1

[Maximum number: 6]

Discuss the factors affecting population growth that can result in an exponential growth curve.

Populations and Communities

  • A population is one species in an area; a community is all interacting populations there.
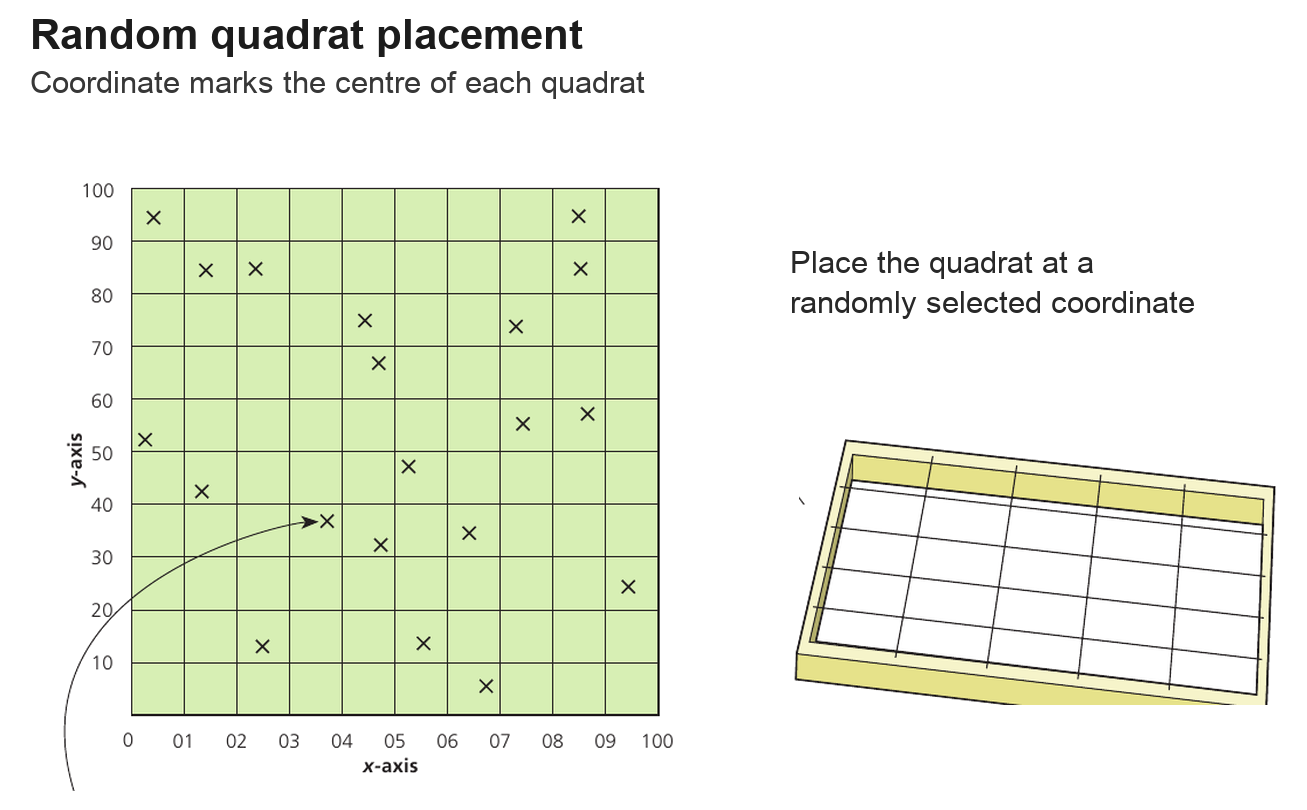
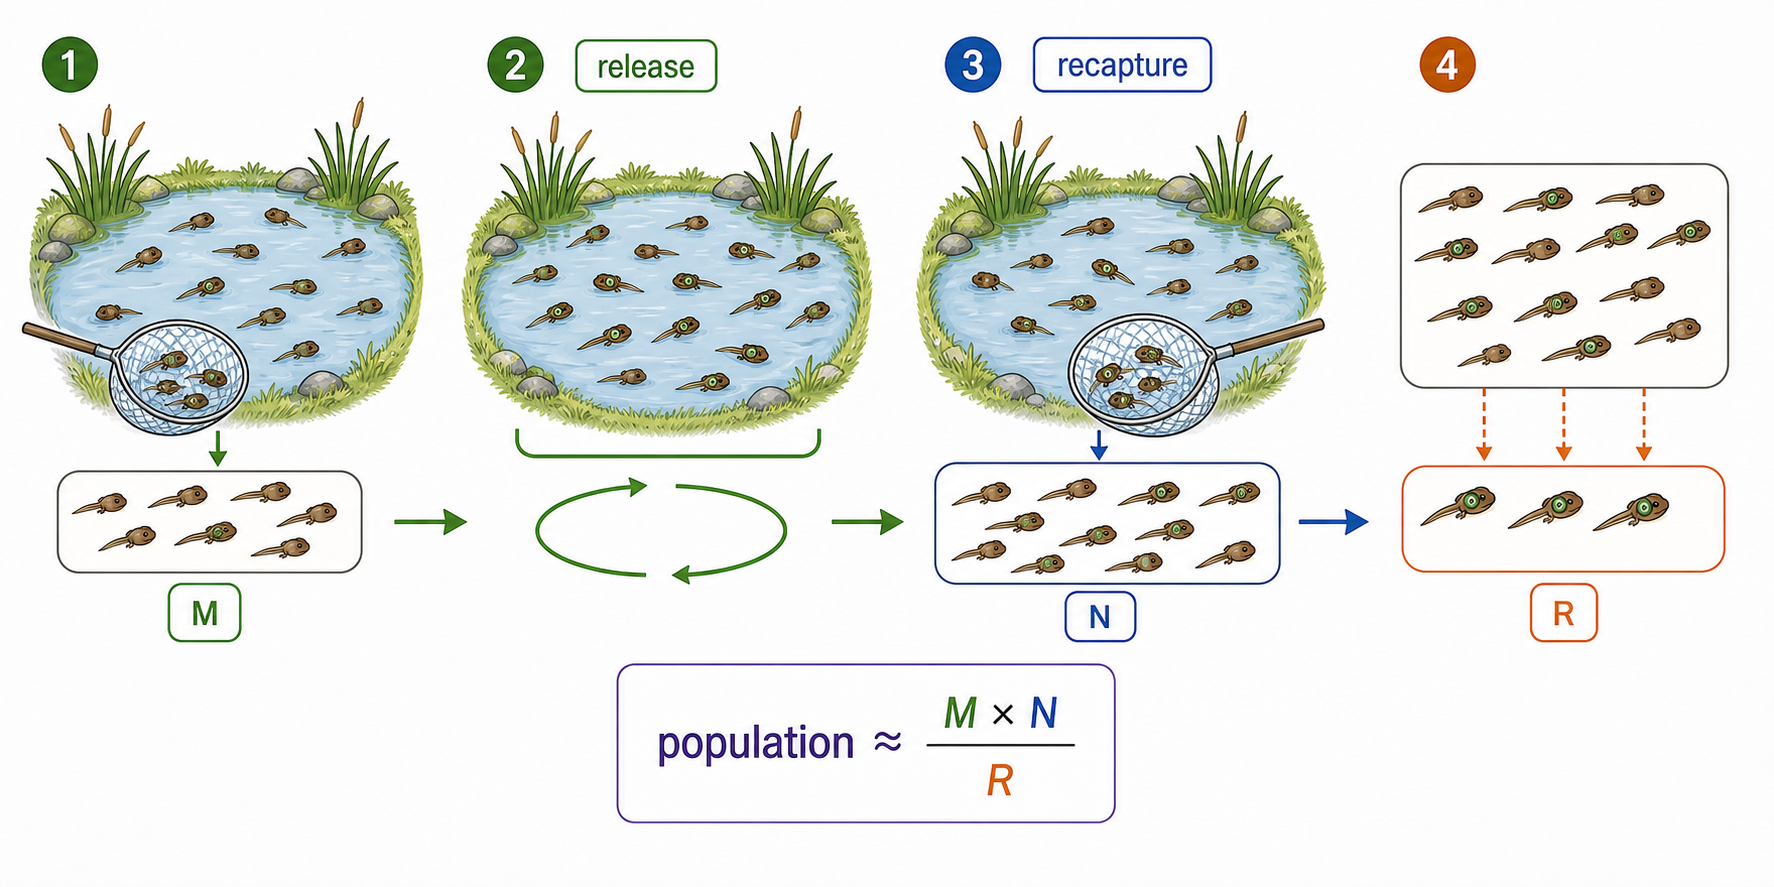
  • Estimate abundance with unbiased sampling: quadrats for sessile organisms and capture–mark–release–recapture for mobile animals, checking each method’s assumptions.
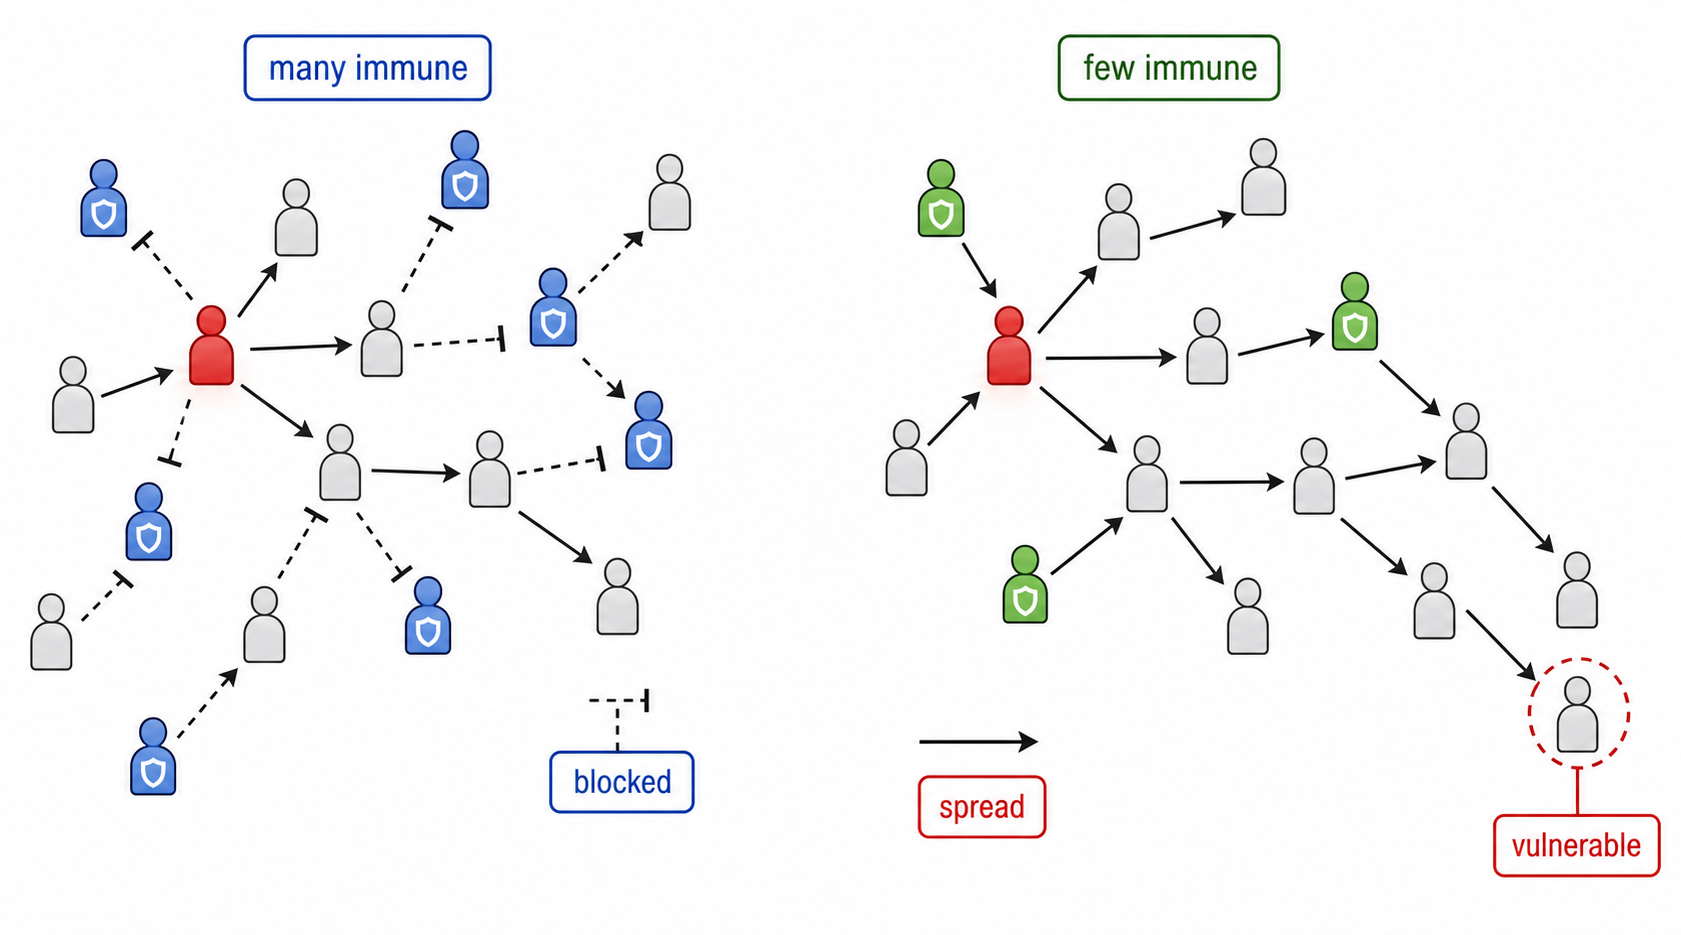
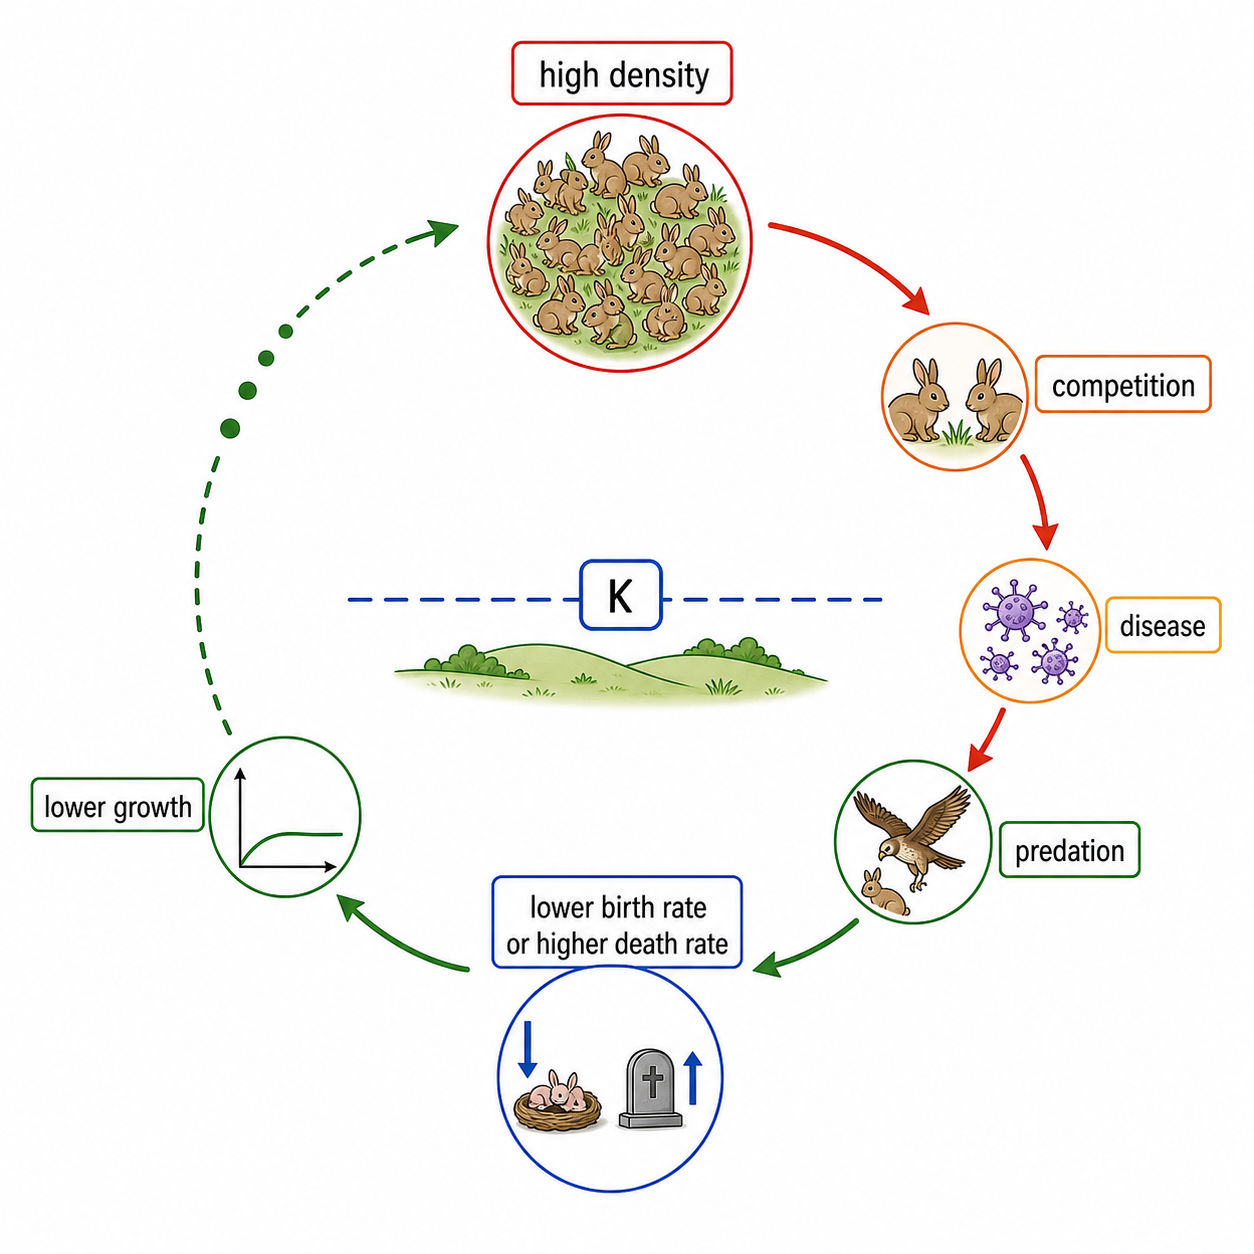
  • Density-dependent competition, predation, disease and waste create negative feedback around carrying capacity; exponential growth slows into a sigmoid curve as limits strengthen.
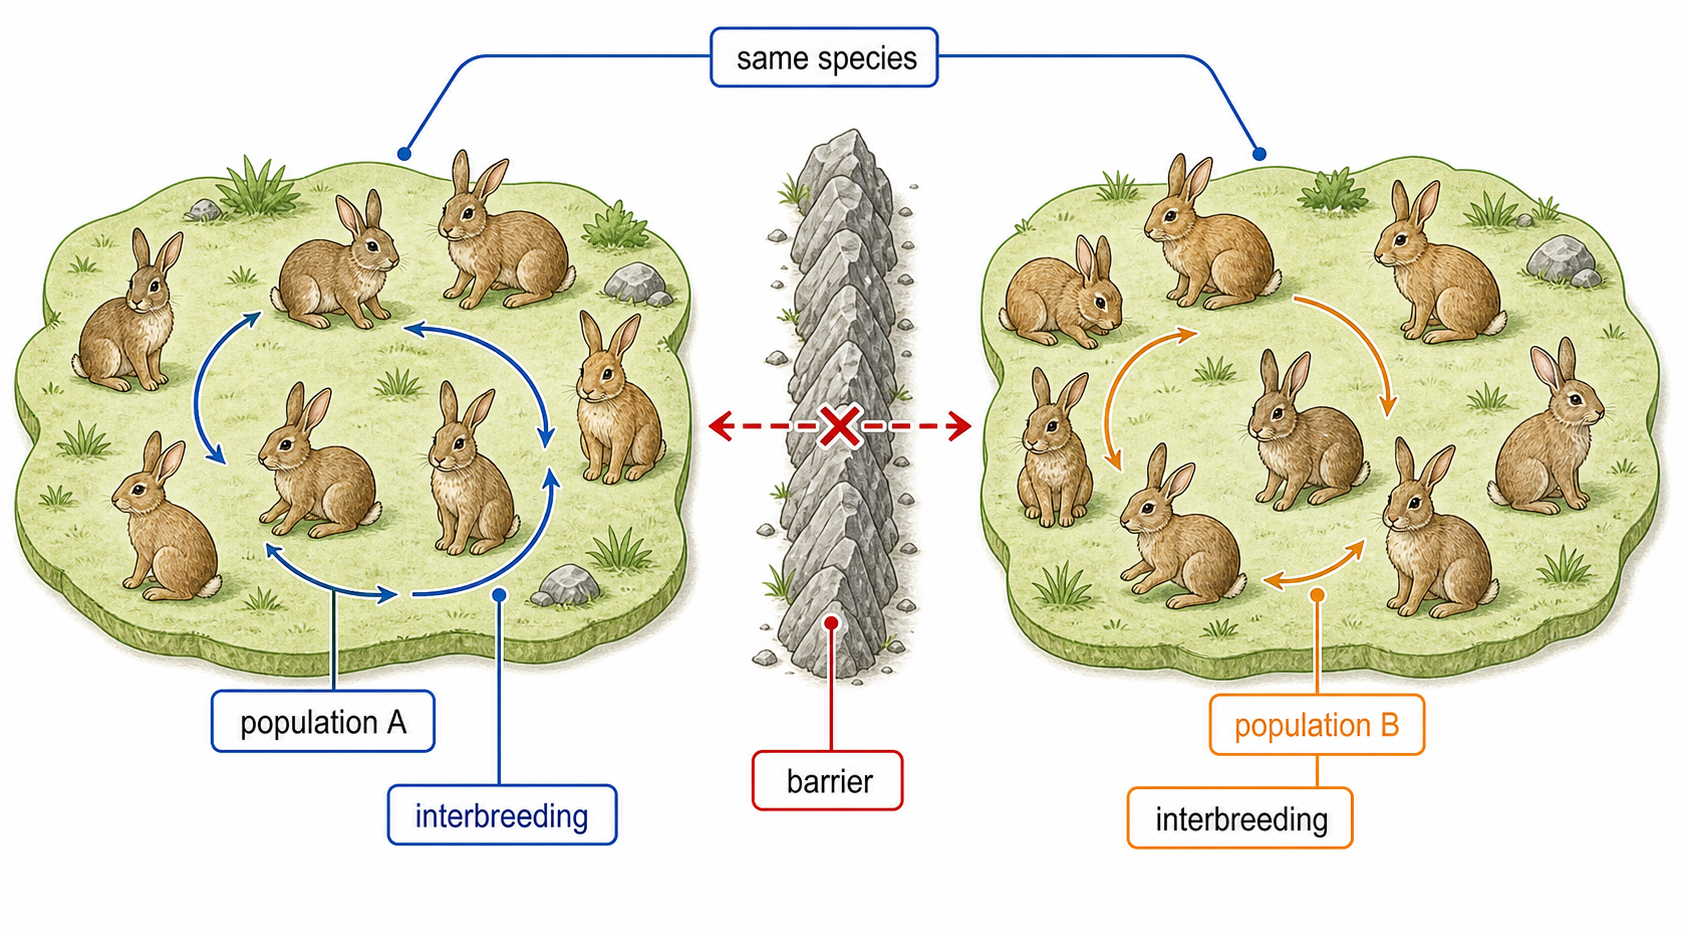
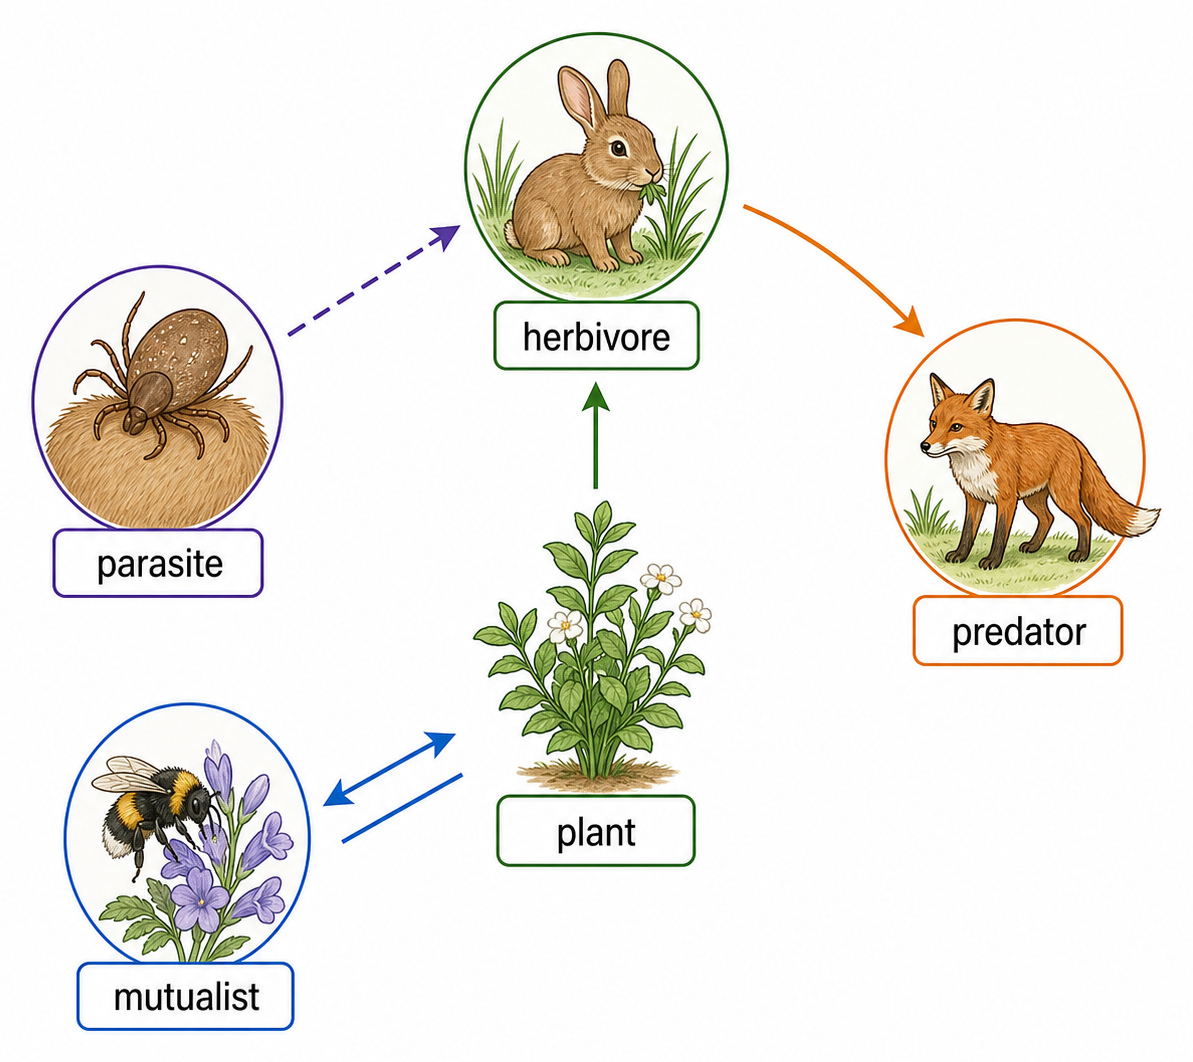
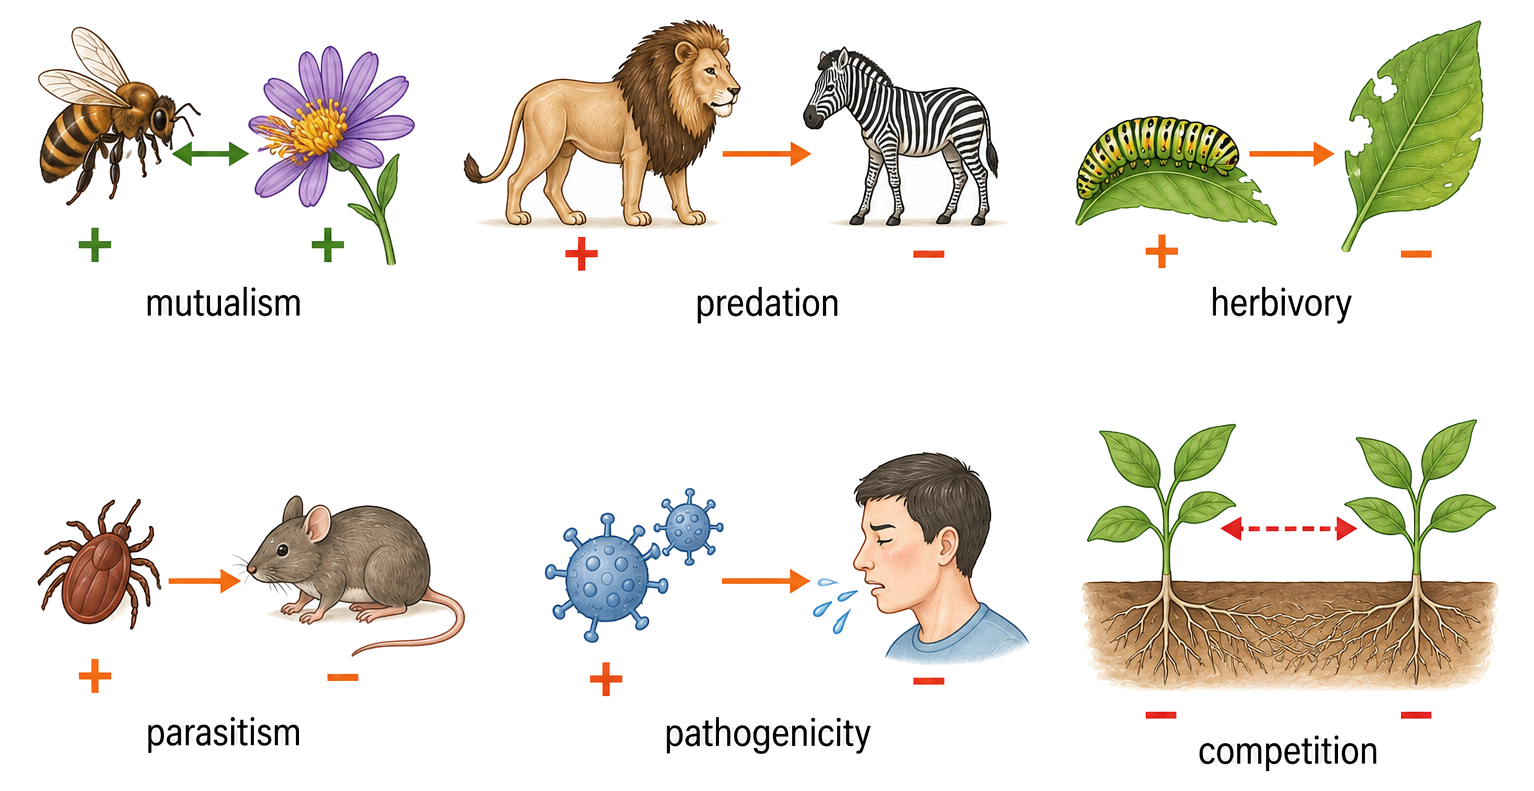
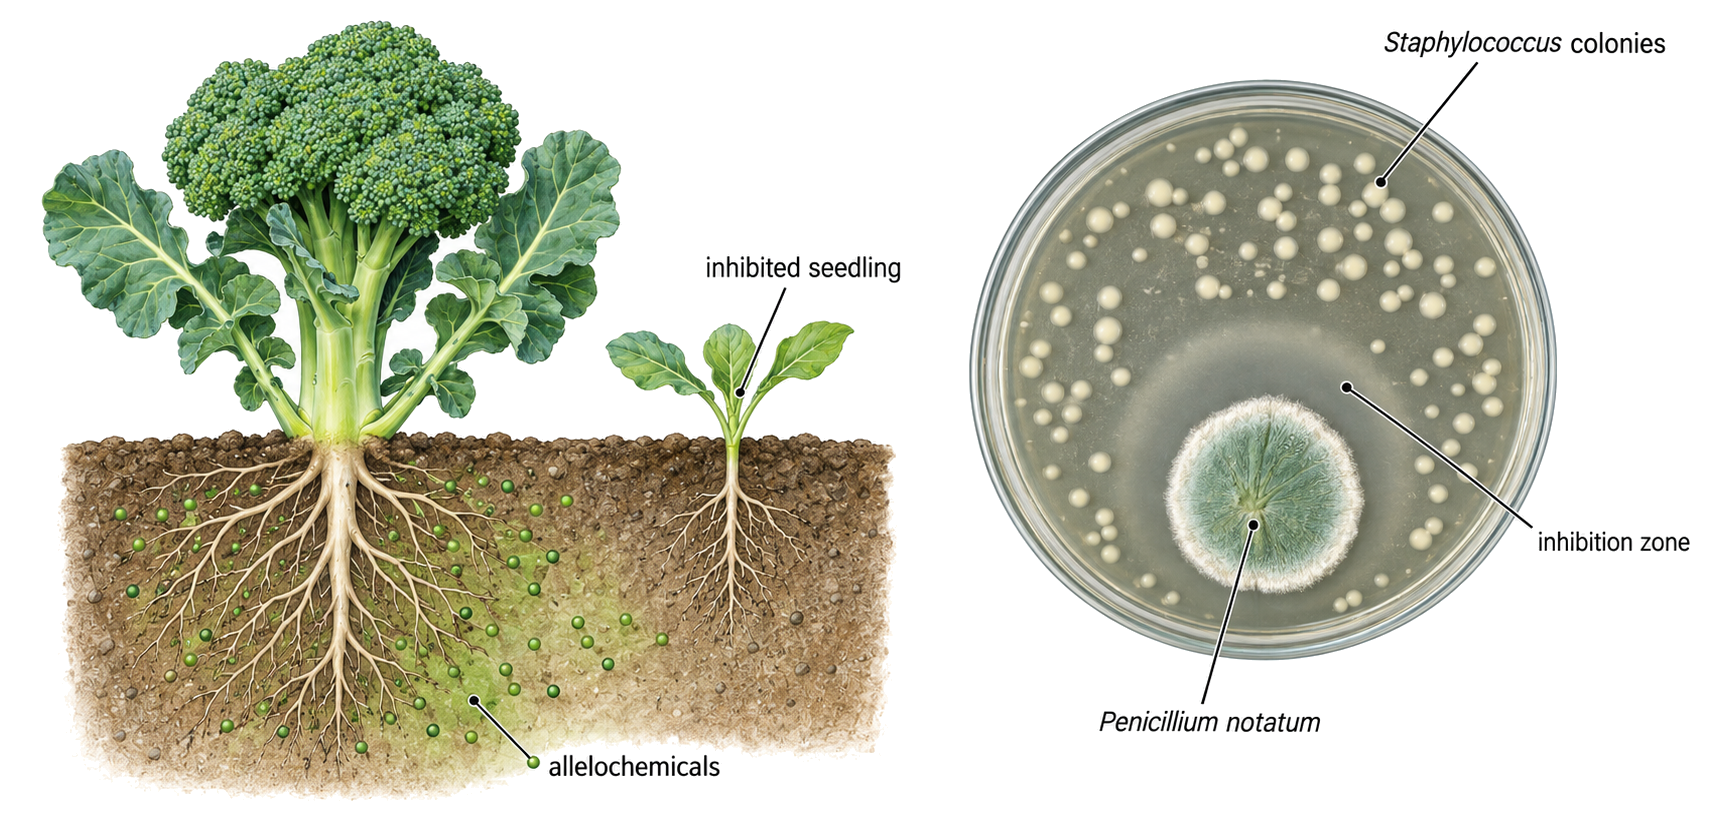
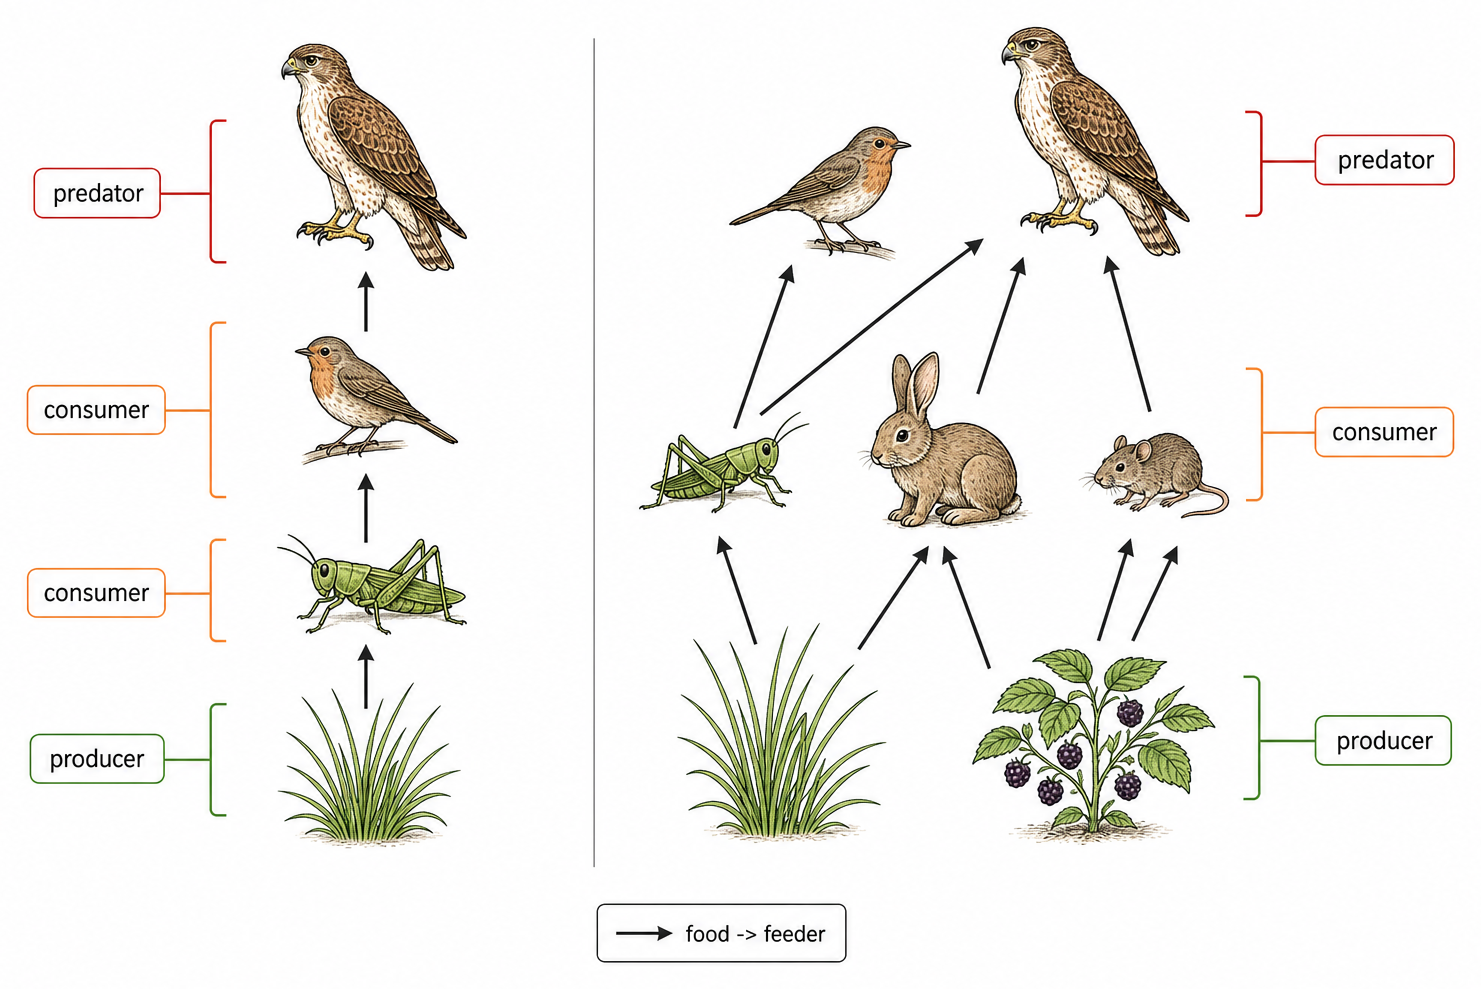
  • Classify interspecific relationships by costs and benefits: predation, herbivory, competition, mutualism, parasitism and pathogenicity.
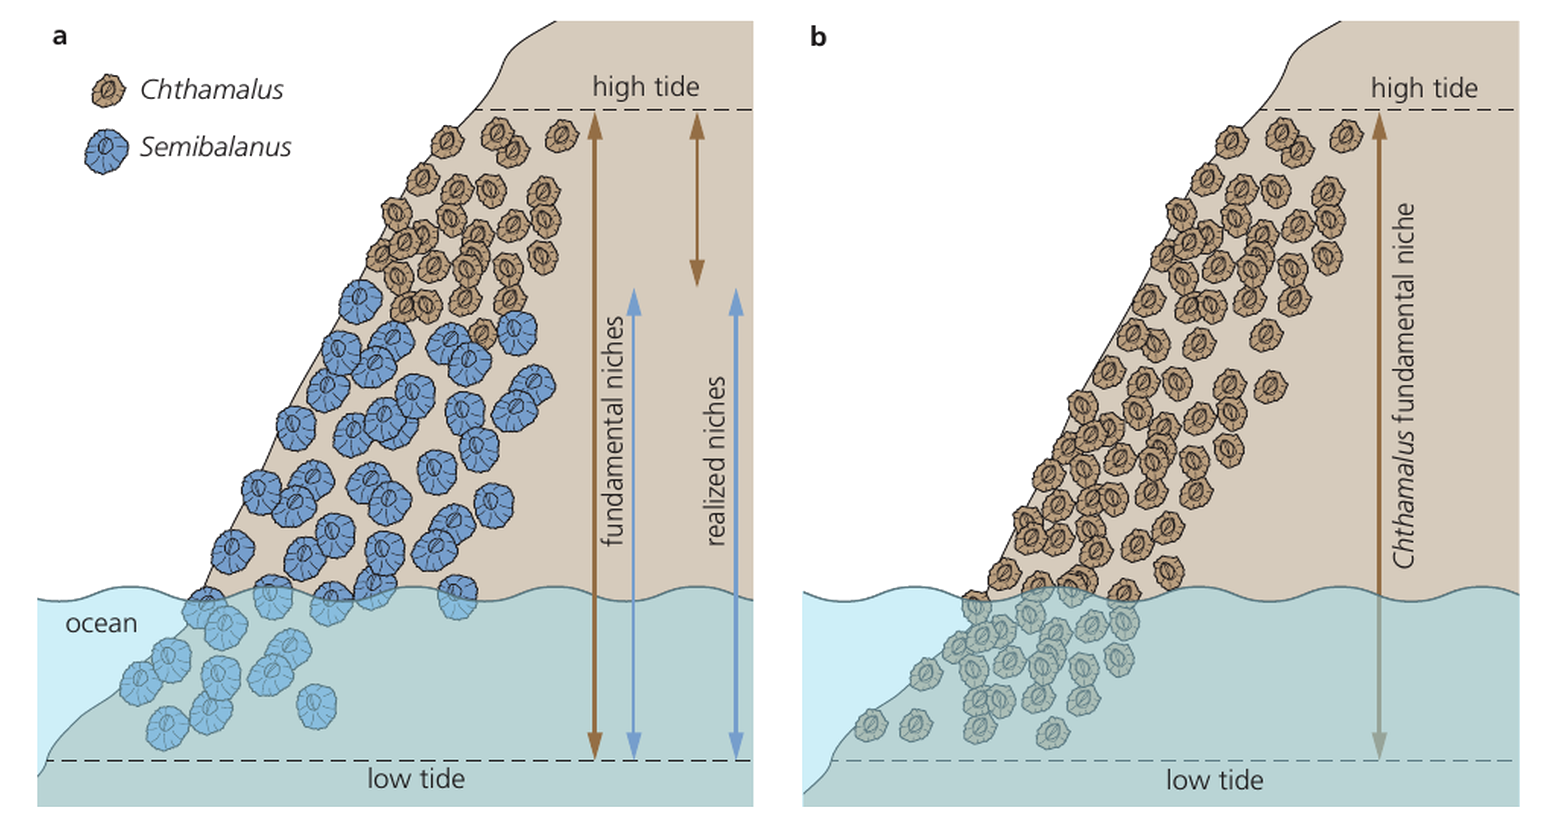
  • Invasive species may escape controls and displace endemic species. Removal experiments can reveal competition and fundamental versus realized niches.
  • Chi-squared tests assess species association from observed and expected quadrat counts.
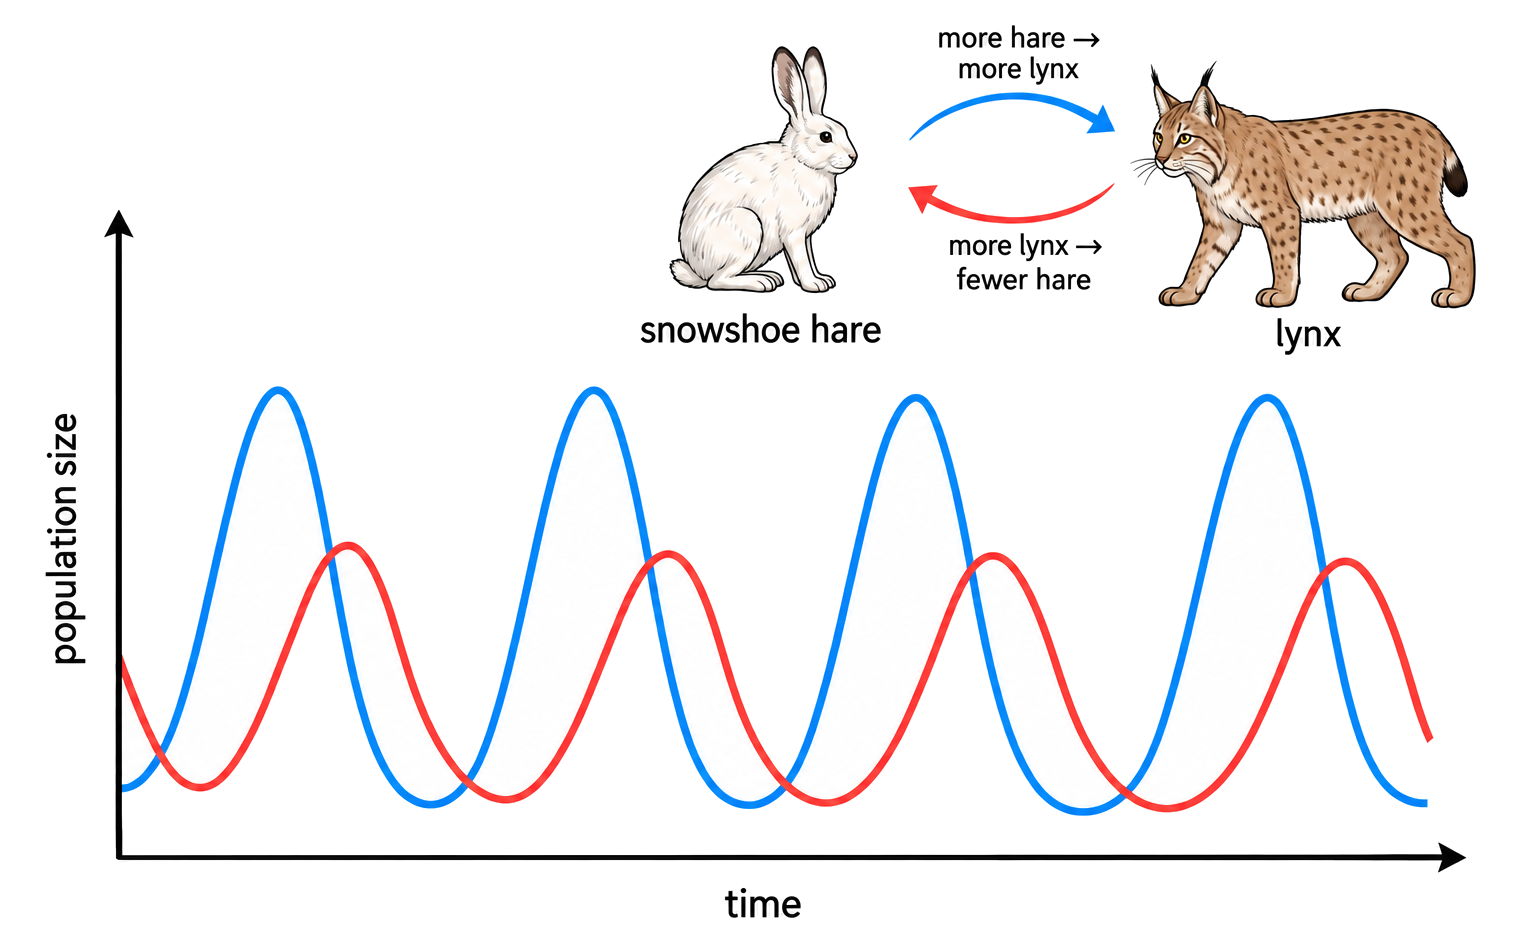
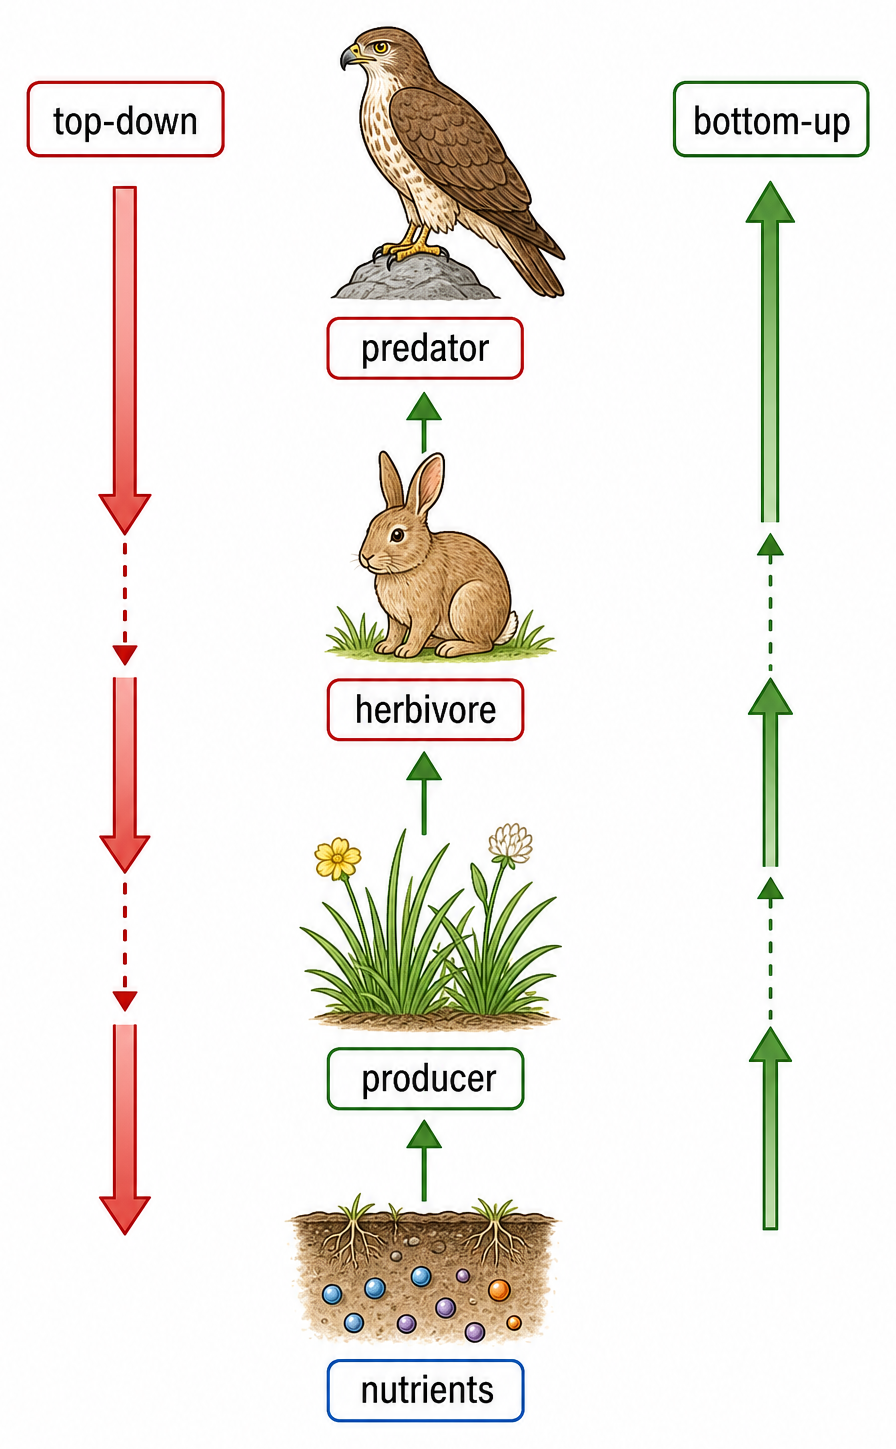
  • Predator peaks usually lag prey peaks; top-down control begins with consumers, while bottom-up control begins with resources or producers.

Concept essentials

  • Population growth curves must be linked to the correct ecological unit, method or species interaction.
  • The evidence for population growth curves depends on measurable abundance, distribution, survival or resource patterns.
  • Population growth curves is clearest when cause, ecological process and population outcome are kept distinct.
  • Field or graph evidence for population growth curves needs biological interpretation, not values alone.
ConceptIB Biology SL